In her article in the December 2022 issue of Stocks and Commodities, “Short-Term Continuation And Reversal Signals,” Barbara Star describes modifications to the classic directional movement indicator (DMI) and commodity channel index (CCI) that can aid in more easily identifying price reversals and continuations in a trend. Traditionally, the DMI is comprised of two lines: a positive line (+DI) and negative line (−DI).
In her article, Star creates a DMI oscillator by subtracting −DI from +DI. Historically, the DMI uses a default length of 14. In the article, this has been shortened to 10. The CCI has also been adjusted in the article to use a length of 13 instead of the usual 14 or 20. The oscillator is setup using an AIQ Color Study
The importable WinWayCharts EDS file can be obtained on request via email to info@TradersEdgeSystems.com. The code is also shown here:
! Short-Term Continuation And Reversal Signals
! Author: Barbara Star, TASC Dec 2022 ! Coded by: Richard Denning, 10/21/2022
C is [close].
H is [high].
L is [low].
H1 is valresult(H,1).
H2 is valresult(H,2).
L1 is valresult(L,1).
L2 is valresult(L,2).
GreenDMI if [DirMov] > 0.
RedDMI if [DirMov] < 0.
StartOfDownTrend if C < simpleavg(C,18) and [DirMov] < 0 and H < H1 and H1 > H2.
StartOfUpTrend if C >= simpleavg(C,18) and [DirMov] >= 0 and L > L1 and L1 < L2.
GreenTrend if C >= simpleavg(C,18) and [DirMov] >= 0.
RedTrend if C < simpleavg(C,18) and [DirMov] < 0.
Code for the author’s color study is set up in the WinWayCharts EDS code file. Figure 7 shows the color studies set up in the charts module. Figure 8 shows the color studies on a chart of Apple, Inc. (AAPL). The black bars are potential entry points in the downtrend.
FIGURE 7: WinWayCharts. The color bar setup in the charts module is demonstrated.
FIGURE 8: WinWayCharts This shows an example of the color studies applied to a chart of Apple, Inc. (AAPL) with a DMI histogram and an 18-bar simple moving average.
it’s been a challenging market this year, and making trading decisions has never been easy. Which direction the market is likely to move plays a huge part in stock trading decisions.
The Expert Rating system on the market with its combination of 400 rules on the Dow 30 index and the NYSE internals has always provided us an early indication of direction changes.
No system is infallible, and when the Expert System on the market was created, we noticed that ratings of 95 or higher to the upside or downside (maximum rating is 100 btw) were significant. We also noticed a marked improvement in the accuracy of the ratings if we used a confirmation technique with a momentum indicator.
After much research, we discovered that the Phase Indicator (a version of a MACD histogram) was the most accurate tool to confirm high ratings.
*** Here’s how we use Phase to confirm a high Expert Rating. ***
When a rating of 95 up or 95 down is triggered on the market, we look for the Phase histogram to change direction. The change in direction must be to the direction of the rating. This change does not have to happen on the day of the rating, but it must occur within 2 to 3 days on either side of the rating day.
If the Phase does not change direction, the rating is considered not confirmed.
This short video analysis of the last 4 ratings shows this process in action.
In this recent Zoom video Steve Hill, founder of WinWayCharts discusses the Group and Sector Reports, using them to identify groups that are moving up. He then uses Darren’s indicators to focus in on potential stock candidates within these groups.
The WinWay TradingExpert Pro Market Timing signals are not a perfect system. If they were no doubt the founders would have kept it secret and traded the signals themselves.
The signals that give us early waring of a change in direction of the market are proprietary. The 400 rules that are used by the Artificial Intelligence inference engine to determine change of market direction use many of the widely known technical tools, read review here.
The rating calculation and the indicators contributing to the ratings have not been changed for many years. A decision was made some years ago to avoid constantly moving the goalposts as the constant optimizing or back fitting erodes the validity of the system.
High ratings to the upside or downside of notice have to be 95 or greater (the maximum is 100). the ratings are considered confirmed when the Phase indicator that is outside of the AI system, changes in the direction of the high rating.
So ratings have fired in the last few months how do we confirm them?
We look for the Phase indicator ( a derivative of MACD) to change in the direction of the signal. This needs to occur within a 3 day window before or after the rating.
The last 2 market timing signals illustrate this nicely.
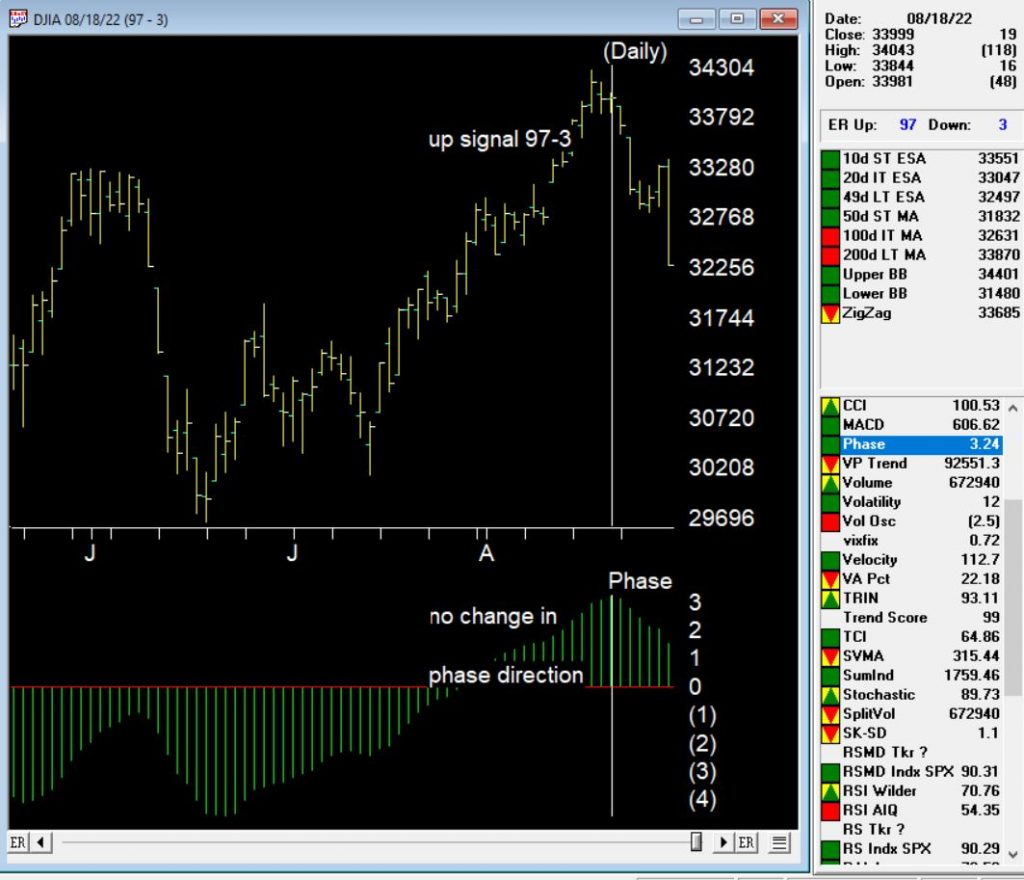
August 18, 2022 97-2 up signal on the market
The up signal occurred during a a 3 day down period on the uptrend, however the Phase indicator did not change direction (it would need to turn up after going down) within the window for confirmation. This signal is therefore unconfirmed by Phase.
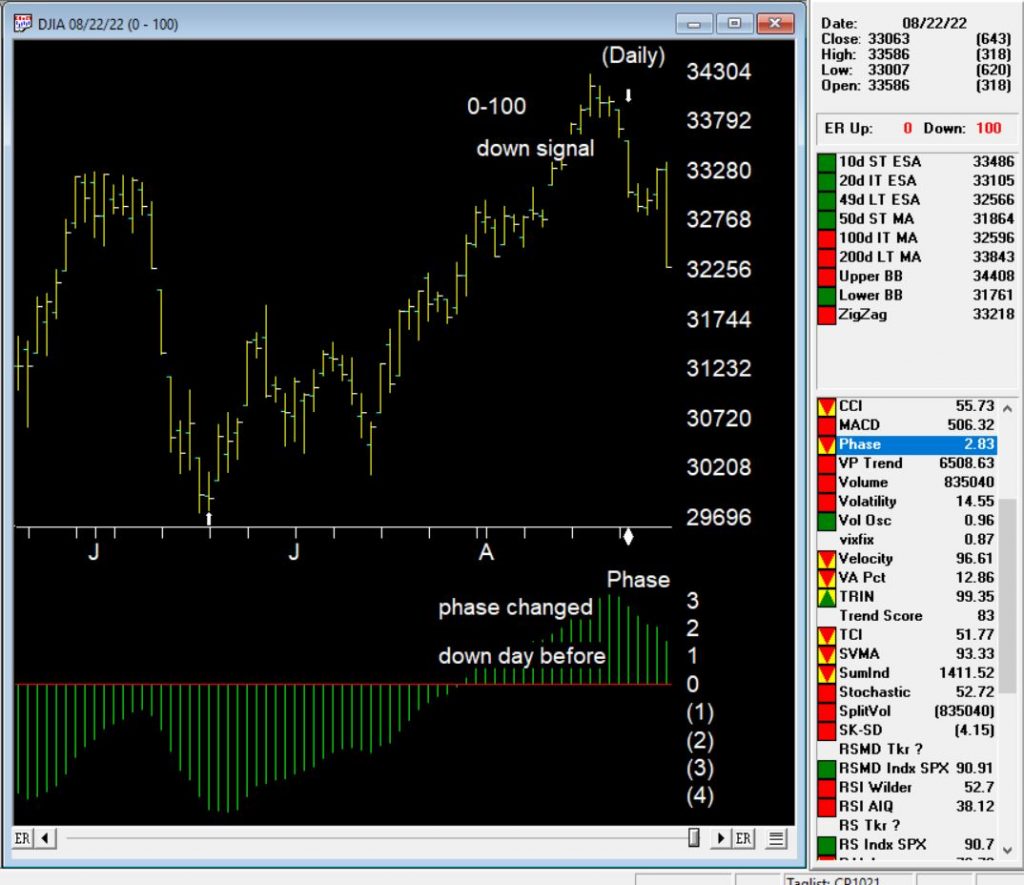
August 22, 2022 down signal on the market
The down signal occurred on 8-22-22. 100 down is the strongest signal the market timing generates. In this case the Phase turned down after a prolonged upward move, on the day before the signal. This is considered a confirmed down signal on the market.
The rules that contributed to 0-100 down on the market
The 100 down signal is the strongest signal the AI system generates. Here are the major technical events that contribute to this rating.
Trend Status has changed to a strong down trend. This indicates that a downward trend has started that may continue in this direction. This is a moderate bearish signal.
The 21 day stochastic has declined below the 80% line and the price phase indicator is decreasing. In this strongly downtrending market this is an indication that the downtrend will continue.
Volume accumulation percentage is decreasing and the 21 day stochastic has moved below the 80% line. In this strongly down market, this is taken as a very strong bearish signal that could be followed by a downward price movement.
The exponentially smoothed advance/decline line has turned negative when the up/down volume oscillator and the advance/decline oscillator are already negative. In this market, this is viewed as a bearish signal that could precede a downward price movement.
The up/down volume oscillator has turned negative when the exponentially smoothed advance/decline line and the advance/decline oscillator are already negative. In this market, this is viewed as a bearish signal that could precede a downward price movement.
The new high/new low indicator has reversed to the downside. This is a reliable bearish signal that is often followed by an downward price movement. In this market a continued strong downtrend can be expected.
September 7, 2022 – 3pm to 7pm London time, four hour in-depth webinar
covering these in-depth topics, crucial to your successful trading.
Early bird pricing now in effect, see below to book your discounted price and save over 20%
****** Includes PDF handouts and access to the recordings of the event ******
Session 1 – Power tools and features in your WinWayCharts and how to use them
Color Studies, Overlays, Custom Indicators, Seasonality, and Matchmaker. These are important and powerful tools in your WinWayCharts. In this session, we’ll show how to set a Color Study and why, what Overlays are useful for, and more. Learn how these tools will save you time and how they contribute to your trading decisions. Darren’s 3 favourite Bullish/Bearish strategies will be used as the basis for the color study.
Session 2 – Darren’s Indicators and how to apply them
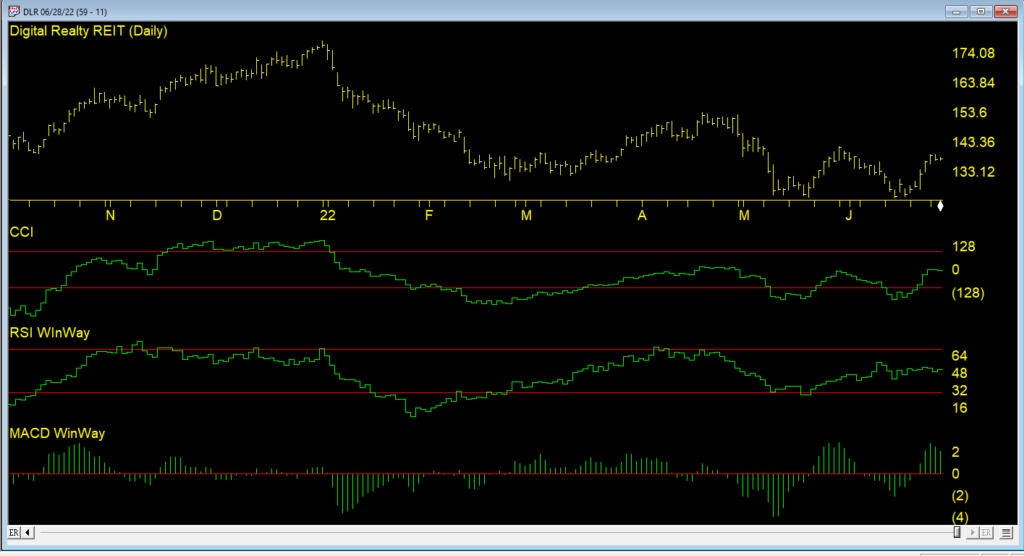
Some indicators are more reliable than others. In this session, we’ll look at some of the nuances of MACD WinWay, RSI WinWay and the CCI indicators and how they add confidence to our trading decisions. We’ll explore these 3 indicators in-depth with examples of them in action in the stock market.
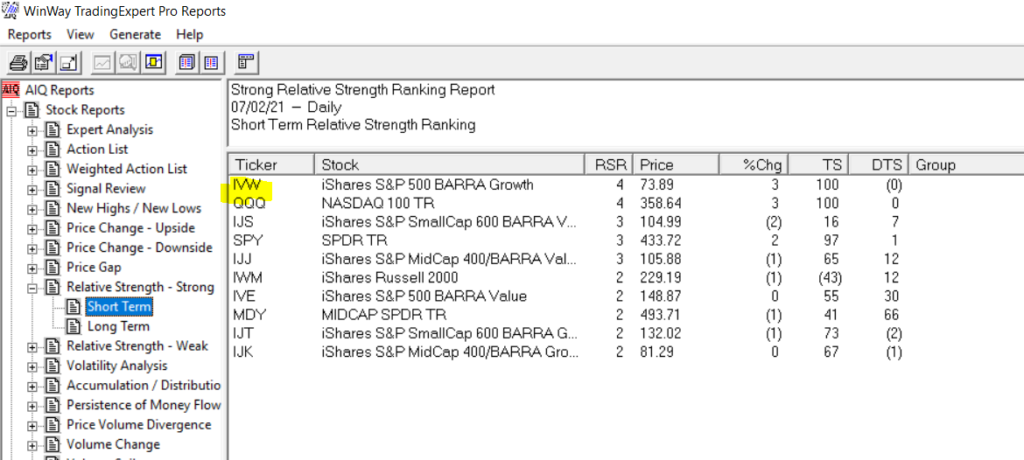
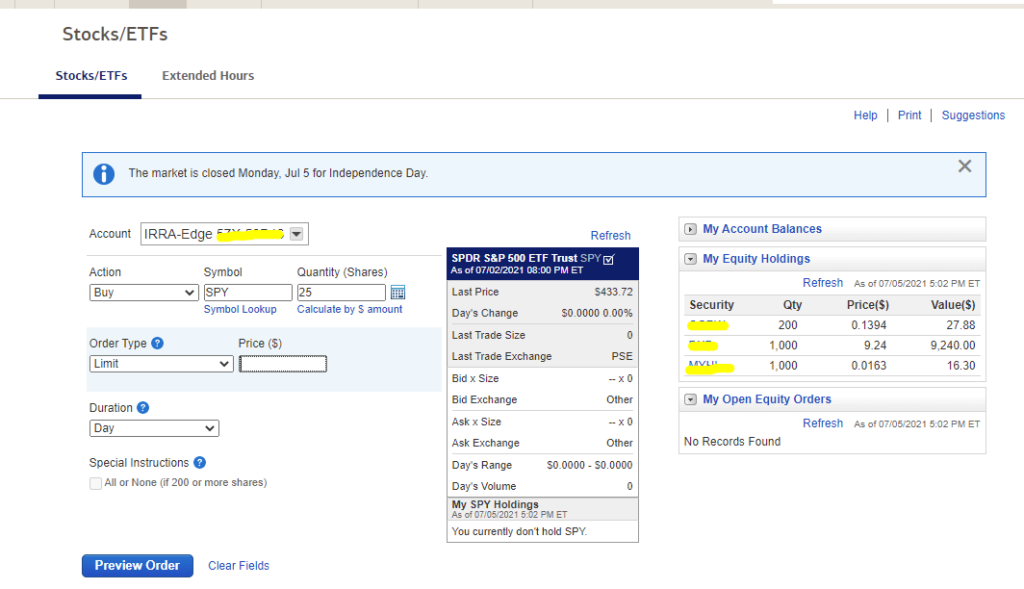
Session 3 – Exchange traded funds rotation strategy so you never have to go short
Using the reports in WinWayCharts we’ll look at a tried and tested ETF rotation strategy that is simple and yet effective at getting you in the right market segment at the right time. This strategy is simple to execute and has consistently beat the market over multiple years. While this strategy doesn’t replace your regular trading, it’s a good place to consider for a segment of trading.
Session 4 – Live Trading using Darren’s Favorite Candlestick Strategy and ETF Strategy
Starting from Market Timing, then moving to the Darren’s 3 Favourite Candlestick Strategy and the ETF Rotation Report, we’ll look for candidate stocks. Using the WinWayCharts indicators we’ll look to confirm the best of the best stock and ETF candidates to place trades with stops using a live trading account.
Your Presenters: Ray Foreman UK director WinWayCharts and, Steve Hill, CEO AIQ Systems, and founder WinWayCharts
Master Trading with WinWayCharts Webinar
September 7, 2022
Early bird pricing now in effect save over 20%
ONLY $299 229
includes all handouts in PDF and access to recordings