
FREE and Premium Seminars
Live Zoom meets
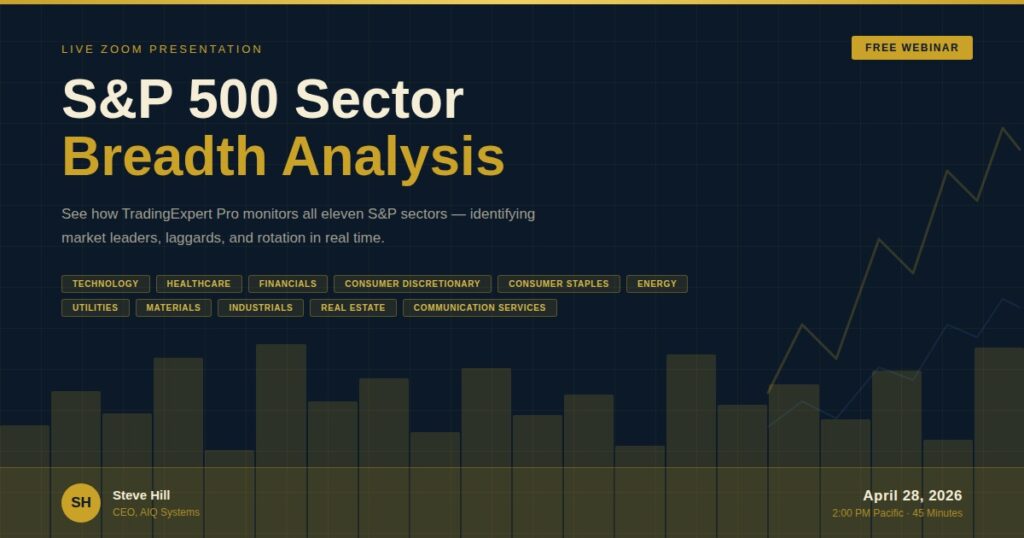
Getting Started right and See Every S&P Sector’s Pulse Fre Zoom Meet Wednesday April 29, 2025 4pm London TimeMaking the Most of Your WinWayCharts – A 30-minute session covering the power features in your WinWayCharts platform – great for new clients and those getting started. A 30-minute session with Steve hill, founder of WinWaycharts. In this session, Steve will show you how to set up special sector ETF tickers inside TradingExpert Pro to monitor relative breadth and performance across all eleven. Combined with the broader market picture, it creates a genuine multi-dimensional view of market health that most retail traders have never had access to. Register for FREE at https://us02web.zoom.us/meeting/register/RHLtmbtSR8qhn_LnVs6sAQ |
 |