WinWay TradingExpert

A history of excellence

  • Trade US and UK stocks 90%
  • Trade FOREX 80%
  • Spread bet 60%
  • Option Traders 48%
  • ETF traders 71%

WinWay TradingExpert

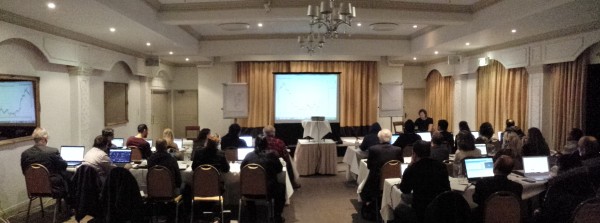
Darren Winters started The Wealth Training Company in 2000. Since that time it has been growing rapidly and is now the market leader in the UK (and Europe) for stock market training. Darren Winters and The Wealth Training  Company have successfully trained more people to invest than any other stock market training company in Britain.

It has been the No 1 choice for over 165,000 people in the UK and also attracted clients from abroad. It has maintained its number one position by providing very high quality training courses that teach easy to follow and easy to apply investment strategies. This has resulted in 1000’s of graduate success stories and testimonials, with happy clients then referring friends and family.

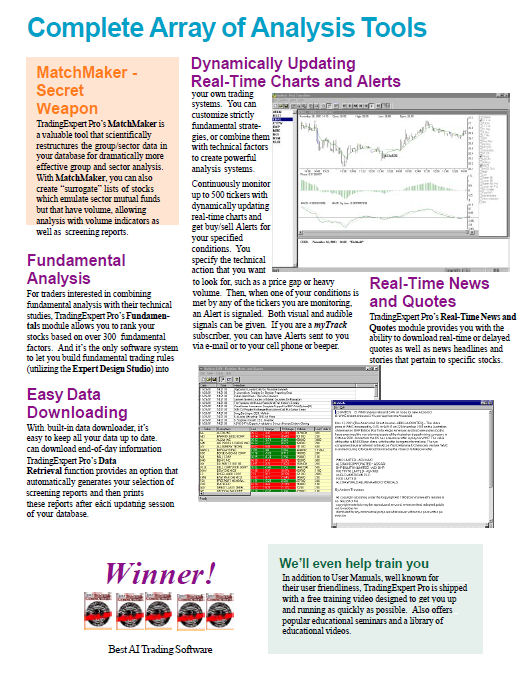
To meet the growing needs of its clients, Wealth Training has developed WinWay TradingExpert a trading support and analysis package which has become Darren’s preferred trading software; it is configured to Darren’s precise trading requirements and specifications and you will not find this software anywhere else. Only WinWay TradingExpert provides all the tools a trader could ever need, under one roof!

v

Here’s how clients use TradingExpert

Recent Blog Posts

Learn from the top thought leaders in the industry.

Double Bottoms and Tops – a scan you can run in your WinWayCharts EDS

Thank you for your continued support of WinWayCharts services. Recently we have been working on an EDS scan to find double tops and bottoms.  We’d like to share with you the progress and how to add this to your WinWayCharts. This is the code used in the scan (you don’t need to know the code but it’s there for your information). There’s always room for improvement, but you can get a hold of this scan. This file is available for download from here This may save to a download folder on your system. We suggest you move it to the path  C:/wintes32/EDS strategies/Chart Pattern Strategies folder. To run this strategy automatically after your nightly download of data – Open Data Retrieval, and select the EDS Post Processing tab. – Select add, and in the Open, Look in C:/wintes32/EDS strategies/Chart Pattern Strategies folder for db3.EDS – Select Open and the strategy will run every night for you. Here’s the results on the Sp1500 run on 1/3/2023   While not perfect, we hope this scan will be of use to you in your trading process....

Short-Term Continuation And Reversal Signals

In her article in the December 2022 issue of Stocks and Commodities, “Short-Term Continuation And Reversal Signals,” Barbara Star describes modifications to the classic directional movement indicator (DMI) and commodity channel index (CCI) that can aid in more easily identifying price reversals and continuations in a trend. Traditionally, the DMI is comprised of two lines: a positive line (+DI) and negative line (−DI). In her article, Star creates a DMI oscillator by subtracting −DI from +DI. Historically, the DMI uses a default length of 14. In the article, this has been shortened to 10. The CCI has also been adjusted in the article to use a length of 13 instead of the usual 14 or 20. The oscillator is setup using an AIQ Color Study The importable WinWayCharts EDS file can be obtained on request via email to info@TradersEdgeSystems.com. The code is also shown here: ! Short-Term Continuation And Reversal Signals ! Author: Barbara Star, TASC Dec 2022 ! Coded by: Richard Denning, 10/21/2022 C is [close]. H is [high]. L is [low]. H1 is valresult(H,1). H2 is valresult(H,2). L1 is valresult(L,1). L2 is valresult(L,2). GreenDMI if [DirMov] > 0. RedDMI if [DirMov] < 0. StartOfDownTrend if C < simpleavg(C,18) and [DirMov] < 0 and H < H1 and H1 > H2. StartOfUpTrend if C >= simpleavg(C,18) and [DirMov] >= 0 and L > L1 and L1 < L2. GreenTrend if C >= simpleavg(C,18) and [DirMov] >= 0. RedTrend if C < simpleavg(C,18) and [DirMov] < 0. Code for the author’s color study is set up in the WinWayCharts EDS code file. Figure 7 shows the color studies set up...

Market Timing – confirmed or not makes a big difference

it’s been a challenging market this year, and making trading decisions has never been easy. Which direction the market is likely to move plays a huge part in stock trading decisions. The Expert Rating system on the market with its combination of 400 rules on the Dow 30 index and the NYSE internals has always provided us an early indication of direction changes. No system is infallible, and when the Expert System on the market was created, we noticed that ratings of 95 or higher to the upside or downside (maximum rating is 100 btw) were significant. We also noticed a marked improvement in the accuracy of the ratings if we used a confirmation technique with a momentum indicator. After much research, we discovered that the Phase Indicator (a version of a MACD histogram) was the most accurate tool to confirm high ratings. *** Here’s how we use Phase to confirm a high Expert Rating. *** When a rating of 95 up or 95 down is triggered on the market, we look for the Phase histogram to change direction. The change in direction must be to the direction of the rating. This change does not have to happen on the day of the rating, but it must occur within 2 to 3 days on either side of the rating day. If the Phase does not change direction, the rating is considered not confirmed. This short video analysis of the last 4 ratings shows this process in action. https://winwaycharts.com/wordpress/wp-content/uploads/2022/10/MArket-Expert-ratings-update.mp4 Want to try out this for...
en_USEnglish
en_USEnglish