The WinWay TradingExpert Pro Market Timing signals are not a perfect system. If they were no doubt the founders would have kept it secret and traded the signals themselves.
The signals that give us early waring of a change in direction of the market are proprietary. The 400 rules that are used by the Artificial Intelligence inference engine to determine change of market direction use many of the widely known technical tools, read review here.
The rating calculation and the indicators contributing to the ratings have not been changed for many years. A decision was made some years ago to avoid constantly moving the goalposts as the constant optimizing or back fitting erodes the validity of the system.
High ratings to the upside or downside of notice have to be 95 or greater (the maximum is 100). the ratings are considered confirmed when the Phase indicator that is outside of the AI system, changes in the direction of the high rating.
So ratings have fired in the last few months how do we confirm them?
We look for the Phase indicator ( a derivative of MACD) to change in the direction of the signal. This needs to occur within a 3 day window before or after the rating.
The last 2 market timing signals illustrate this nicely.
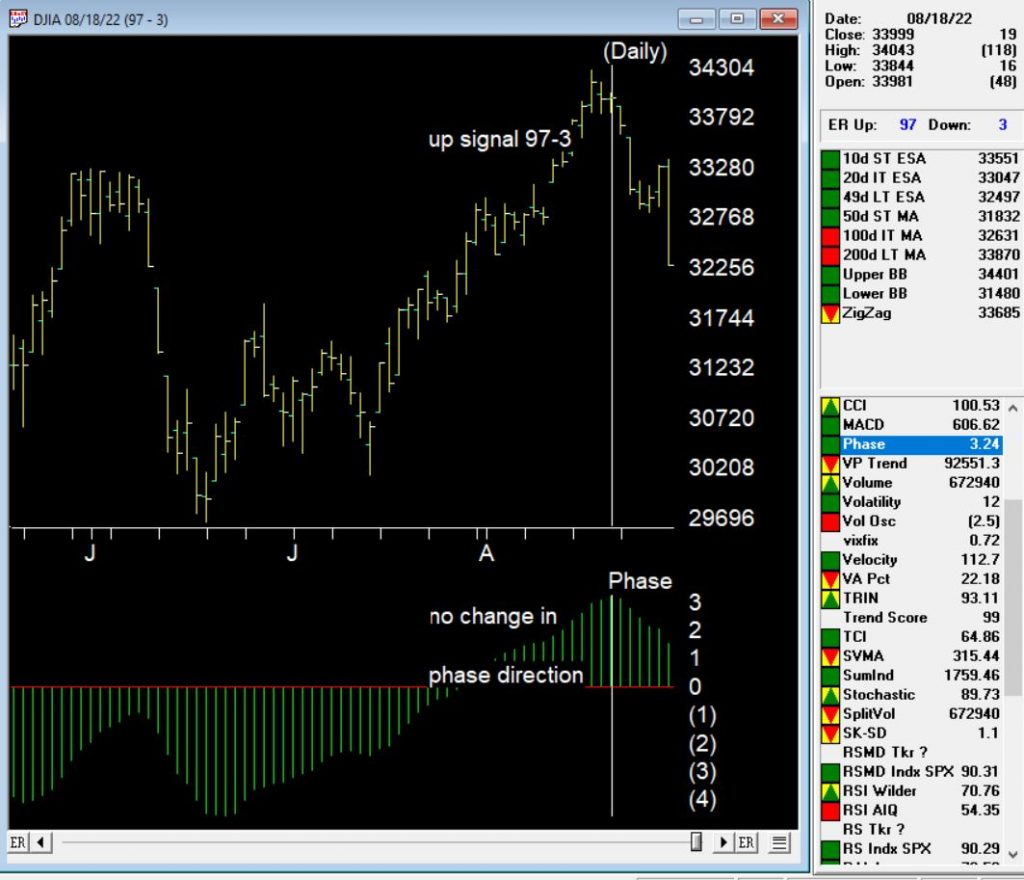
August 18, 2022 97-2 up signal on the market

The up signal occurred during a a 3 day down period on the uptrend, however the Phase indicator did not change direction (it would need to turn up after going down) within the window for confirmation. This signal is therefore unconfirmed by Phase.
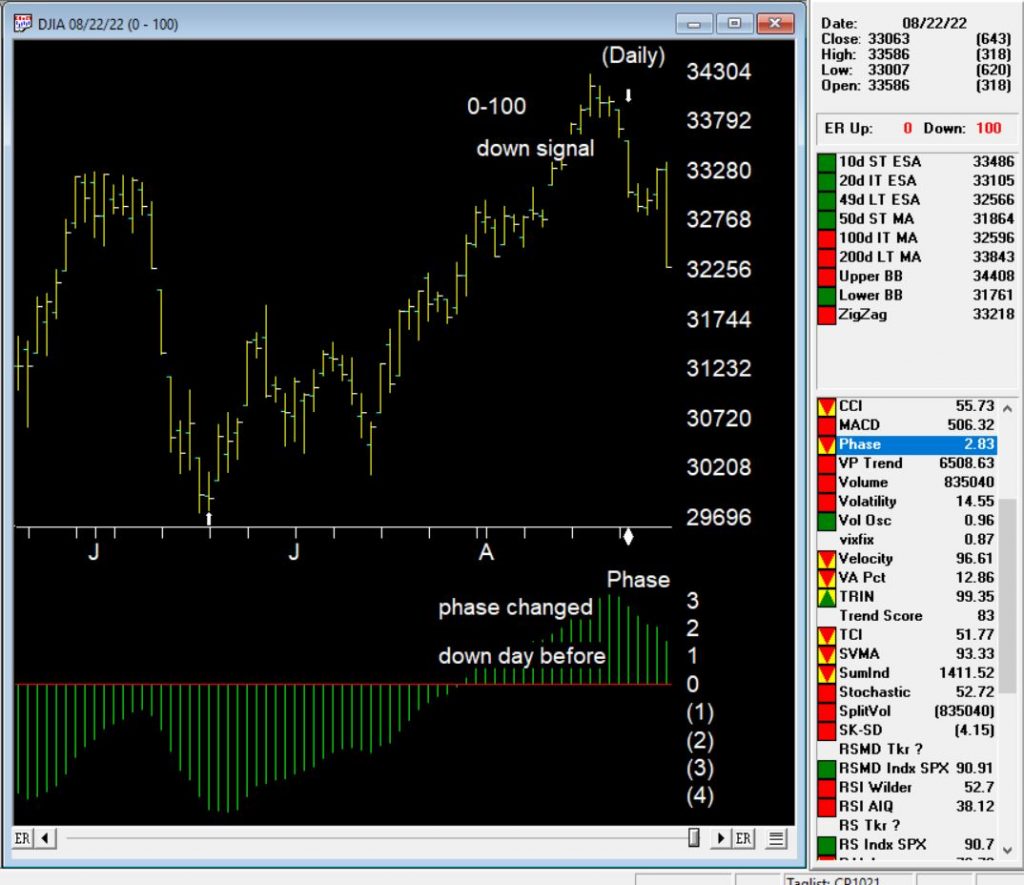
August 22, 2022 down signal on the market

The down signal occurred on 8-22-22. 100 down is the strongest signal the market timing generates. In this case the Phase turned down after a prolonged upward move, on the day before the signal. This is considered a confirmed down signal on the market.
The rules that contributed to 0-100 down on the market
The 100 down signal is the strongest signal the AI system generates. Here are the major technical events that contribute to this rating.
Trend Status has changed to a strong down trend. This indicates that a downward trend has started that may continue in this direction. This is a moderate bearish signal.
The 21 day stochastic has declined below the 80% line and the price phase indicator is decreasing. In this strongly downtrending market this is an indication that the downtrend will continue.
Volume accumulation percentage is decreasing and the 21 day stochastic has moved below the 80% line. In this strongly down market, this is taken as a very strong bearish signal that could be followed by a downward price movement.
The exponentially smoothed advance/decline line has turned negative when the up/down volume oscillator and the advance/decline oscillator are already negative. In this market, this is viewed as a bearish signal that could precede a downward price movement.
The up/down volume oscillator has turned negative when the exponentially smoothed advance/decline line and the advance/decline oscillator are already negative. In this market, this is viewed as a bearish signal that could precede a downward price movement.
The new high/new low indicator has reversed to the downside. This is a reliable bearish signal that is often followed by an downward price movement. In this market a continued strong downtrend can be expected.
