AIQ Market Timing: October 2025 – January 2026 Case Study
How Five Market Timing Signals Captured 4,500 Points While Avoiding Two Major Declines
One of the most common questions we hear from traders is: “Can a systematic approach really identify market turning points in real-time?” The answer is yes—when you have the right tools and a disciplined, rule-based methodology.
Let me show you exactly how AIQ Market Timing navigated a volatile 2.5-month period from October 2025 through January 2026, capturing three significant rallies totaling 4,500 points while protecting capital during two major reversals totaling over 3,000 points of decline.
The Setup: Multiple Bullish Confirmations (October 20, 2025)
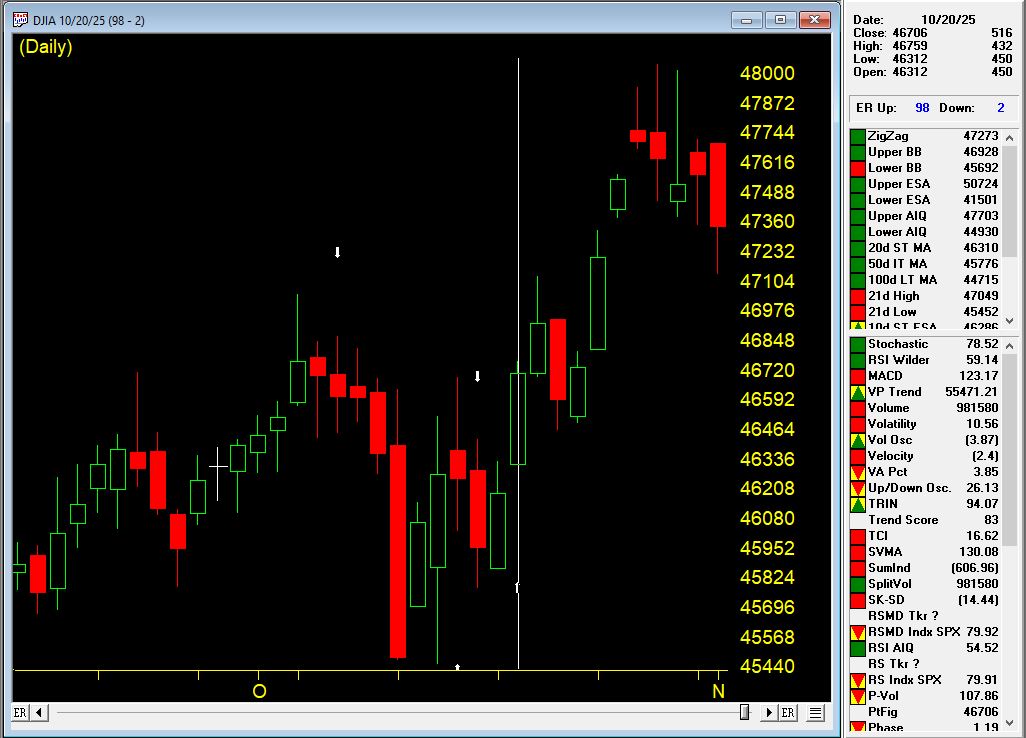
On October 20th, AIQ Market Timing issued a 98 UP signal at 46,707 on the Dow Jones Industrial Average. But this wasn’t just a single indicator flashing green—it was a confluence of five critical rules firing simultaneously:
Rule #1: Trend Status Confirmation
- Trend Status changed to a weak upward trend
- This indicated an upward trend was starting that could continue
- Classification: Moderate bullish signal
Rule #2: Exponentially Smoothed A/D Line
- The smoothed advance/decline line turned positive
- Key factor: The UD volume oscillator and A/D oscillator were ALREADY positive
- This alignment is viewed as bullish, often preceding upward price movement
Rule #3: Up/Down Volume Oscillator
- The UD volume oscillator turned positive
- Confirmation: A/D oscillator and smoothed A/D line were already positive
- This convergence signaled institutional buying was building
Rule #4: Advance/Decline Oscillator
- The A/D oscillator turned positive
- Supporting indicators: UD volume and smoothed A/D line already positive
- Multiple breadth measures confirming the move
Rule #5: Volume Accumulation Alignment
- A/D oscillator turned positive with volume accumulation already positive
- In a weak upward market, this signals prices could continue rising
- Professional money was accumulating positions
The Result: +1,333 Points in 8 Days
The market moved from 46,707 on October 21st to 48,040 on October 29th—a gain of 1,333 points (+2.85%) in just eight trading days.
This is the power of waiting for multiple confirming indicators rather than jumping on single signals. The system identified strong internal market momentum that wasn’t yet obvious to casual observers.
The Top: System Catches the Reversal (October 30, 2025)
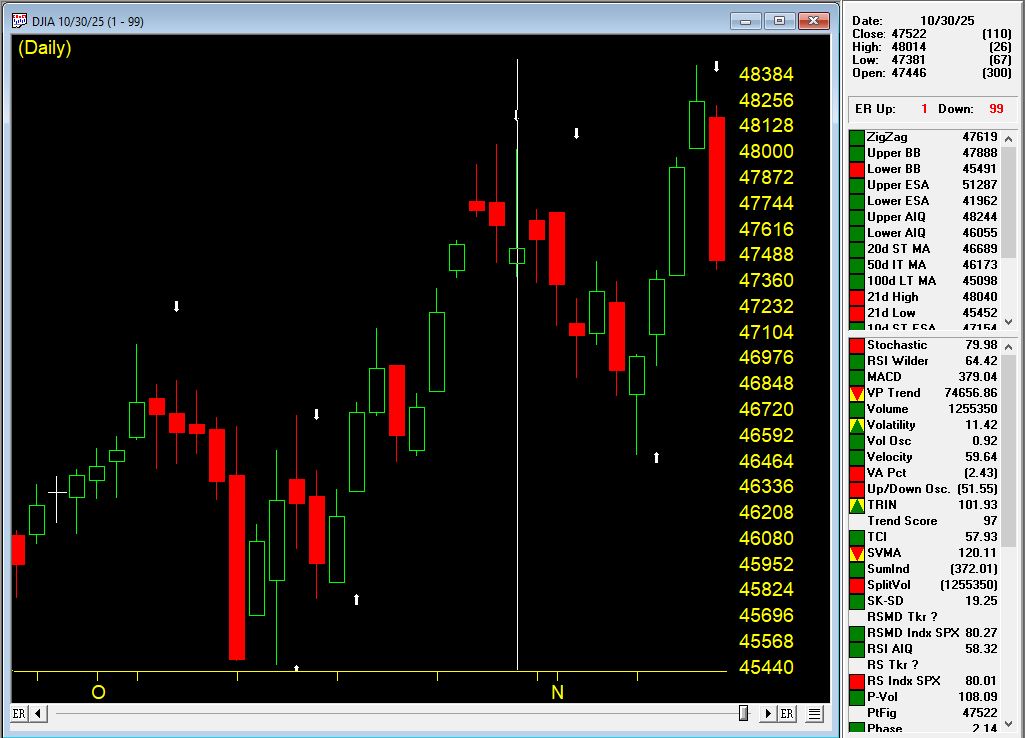
Just one day after the market high, on October 30th at 47,659, AIQ Market Timing 98 issued a DOWN signal. The system caught the top within just 11 points of the absolute high (48,040 vs. 47,659).
Two Critical Bearish Rules Fired:
Rule #1: Breadth Deterioration
- The exponentially smoothed A/D line turned negative
- Warning sign: UD volume oscillator and A/D oscillator were already negative
- This indicated institutional distribution was underway
Rule #2: Volume Accumulation Breakdown
- Volume accumulation turned negative
- The A/D oscillator was already negative
- In a downtrending market, this bearish signal often precedes price declines
Initial Decline: -1,164 Points in 7 Days
From the October 31st level of 47,659, the market dropped to 46,495 by November 7th—a decline of 1,164 points (-2.44%) in seven trading days.
Traders following these signals would have been long for the +2.85% rally and either flat or profitably short for the -2.44% decline.
The Confirmation: Second Down Signal (November 4, 2025)
On November 4th, while the market was still declining, AIQ Market Timing 98 issued a second DOWN signal, reinforcing the bearish outlook. This is where systematic trading truly shines—when multiple signals confirm the trend in real-time.
Three Additional Bearish Rules Fired:
Rule #1: Trend Status Reversal
- Trend Status changed to a weak downward trend
- This confirmed the downward trend was likely to continue
- Classification: Moderate bearish signal
Rule #2: Stochastic and Volume Divergence
- Volume accumulation percentage was decreasing
- The 21-day stochastic moved below the 80% line
- In a downtrending market: Strong bearish signal
- This combination often precedes significant downward price movement
Rule #3: UD Volume Oscillator Breakdown
- The UD volume oscillator turned negative
- Critical context: Smoothed A/D line and A/D oscillator were already negative
- This confirmed selling pressure was intensifying
Signal #3: Back to Bullish (November 10, 2025)
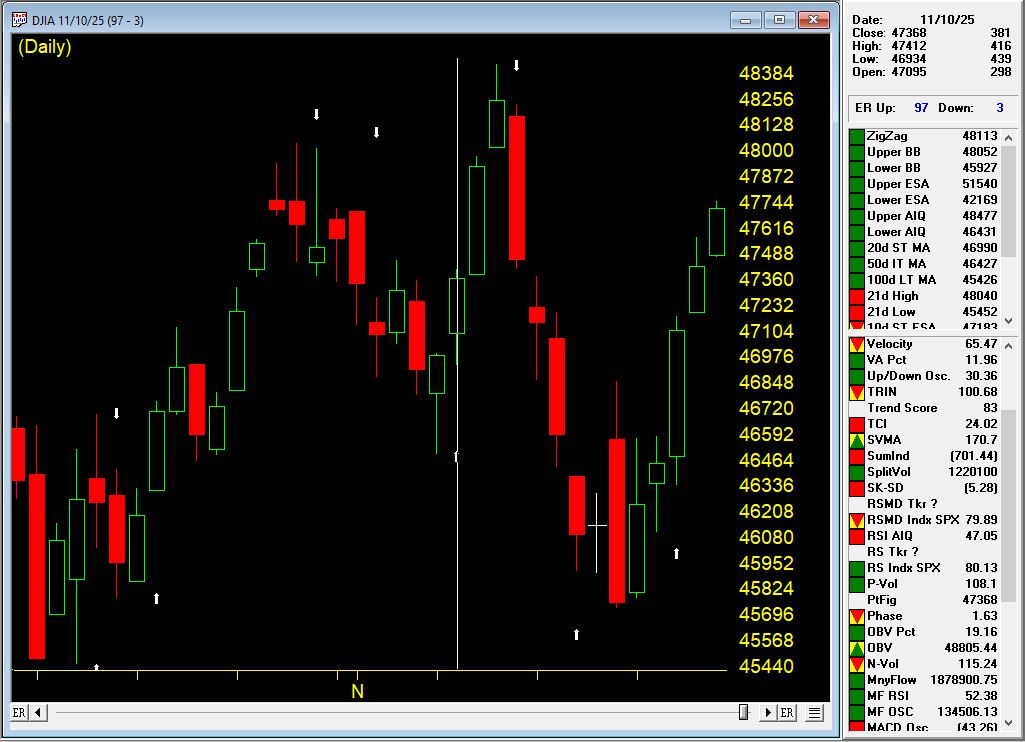
On November 10th at 47,368, AIQ Market Timing issued an UP signal (97), indicating the correction had run its course and a new upward move was beginning.
Four Powerful Bullish Rules Fired:
Rule #1: Exponentially Smoothed A/D Line
- Turned positive with UD volume oscillator and A/D oscillator already positive
- This alignment indicated strong bullish internal momentum building
Rule #2: Advance/Decline Oscillator Confirmation
- Turned positive with UD volume oscillator and smoothed A/D line already positive
- Multiple breadth measures confirming the new uptrend
Rule #3: Volume Accumulation Alignment
- A/D oscillator turned positive with volume accumulation already positive
- In a sideways market, this signals prices could begin upward movement
- Professional buying was returning
Rule #4: New High/New Low Reversal
- The NH/NL indicator reversed to the upside
- Classification: Reliable bullish signal
- Often followed by upward price movement
- In a sideways market, an uptrend could start shortly
The Rally: +1,063 Points in 3 Days
The market surged from 47,384 on November 11th to 48,431 on November 13th—a gain of 1,040 points (+2.22%) in just three trading days.
Signal #4: The Top Again (November 13, 2025)
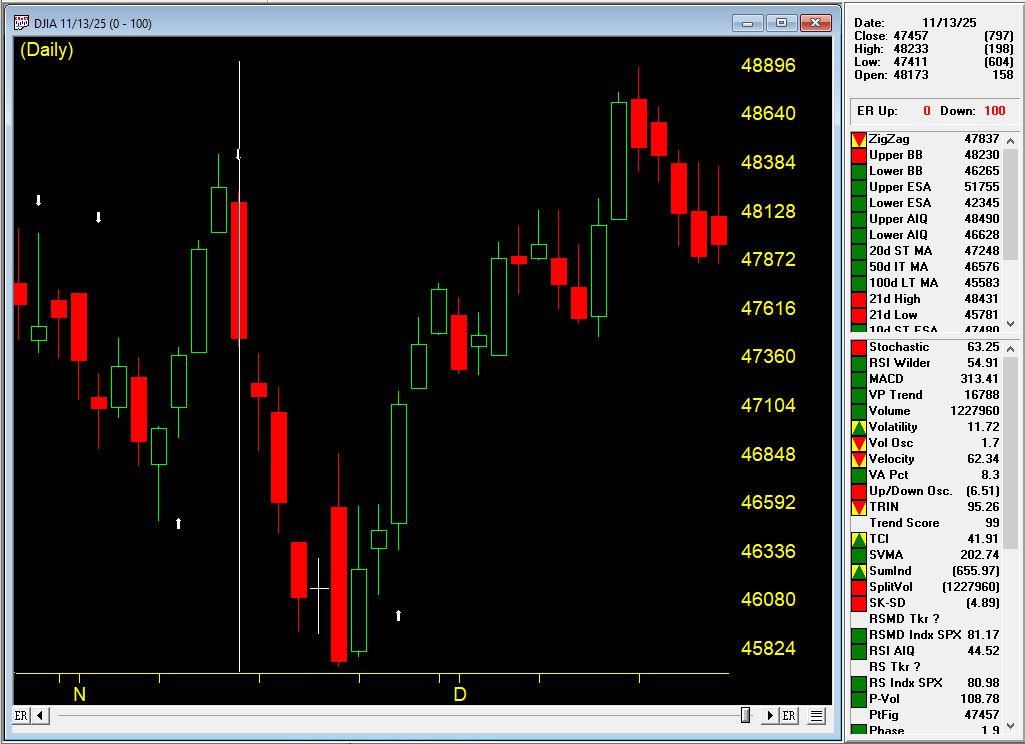
At the market high of 48,233, AIQ Market Timing issued a DOWN signal (100), once again catching the reversal with precision.
Five Bearish Rules Fired:
Rule #1: Stochastic and Price Phase Weakness
- 21-day stochastic declined below the 80% line
- Price phase indicator also decreasing
- In the uptrending market: Weak bearish signal indicating possible near-term decline
Rule #2: Smoothed A/D Line Breakdown
- Turned negative with UD volume and A/D oscillator already negative
- Clear sign of breadth deterioration
Rule #3: UD Volume Oscillator Reversal
- Turned negative with smoothed A/D line and A/D oscillator already negative
- Institutional selling was intensifying
Rule #4: A/D Oscillator Breakdown
- Turned negative with UD volume and smoothed A/D line already negative
- All breadth measures aligned bearishly
Rule #5: New High/New Low Reversal
- The NH/NL indicator reversed to the downside
- Classification: Reliable bearish signal
- Often followed by downward price movement
- In an uptrending market, a trend reversal could occur
The Decline: -1,500 Points in 7 Days
From November 14th’s open of 47222, the market plunged to 45,728 on November 20th—a drop of nearly 1500 points (3.16%) in five trading days.
This was a significant correction that caught many traders off guard. But AIQ Market Timing identified it precisely at the top.
Signal #5: The Current Rally (November 18, 2025 – Present)
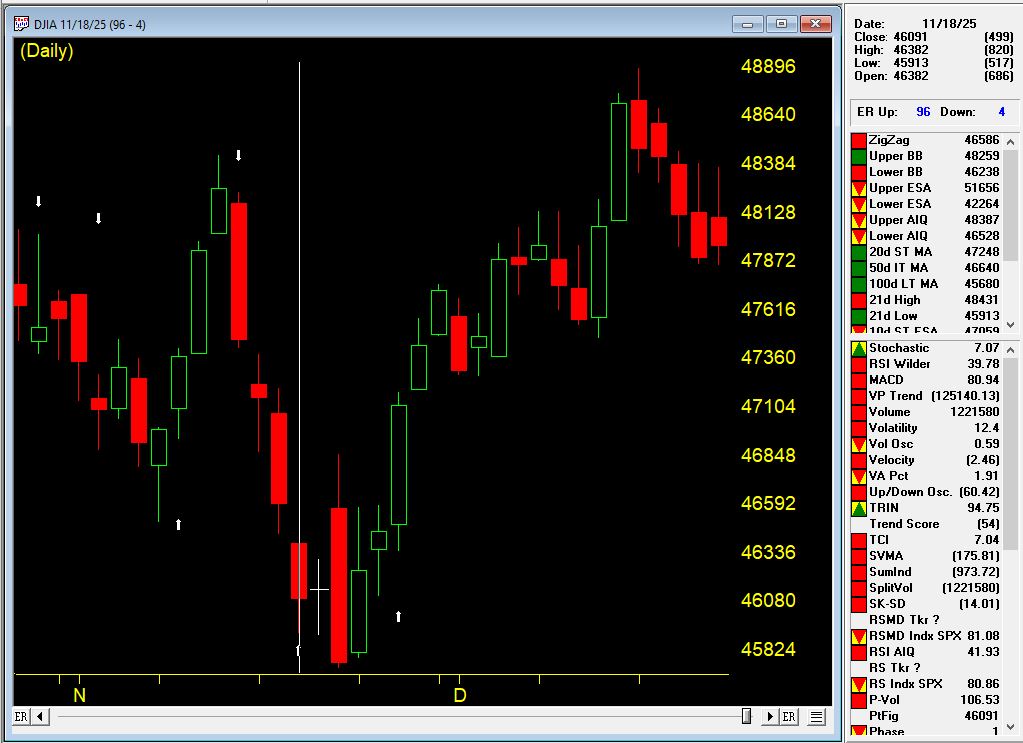
On November 18th at 46,091, AIQ Market Timing issued an UP signal (96), catching the bottom of the correction and positioning traders for what would become a powerful sustained rally.
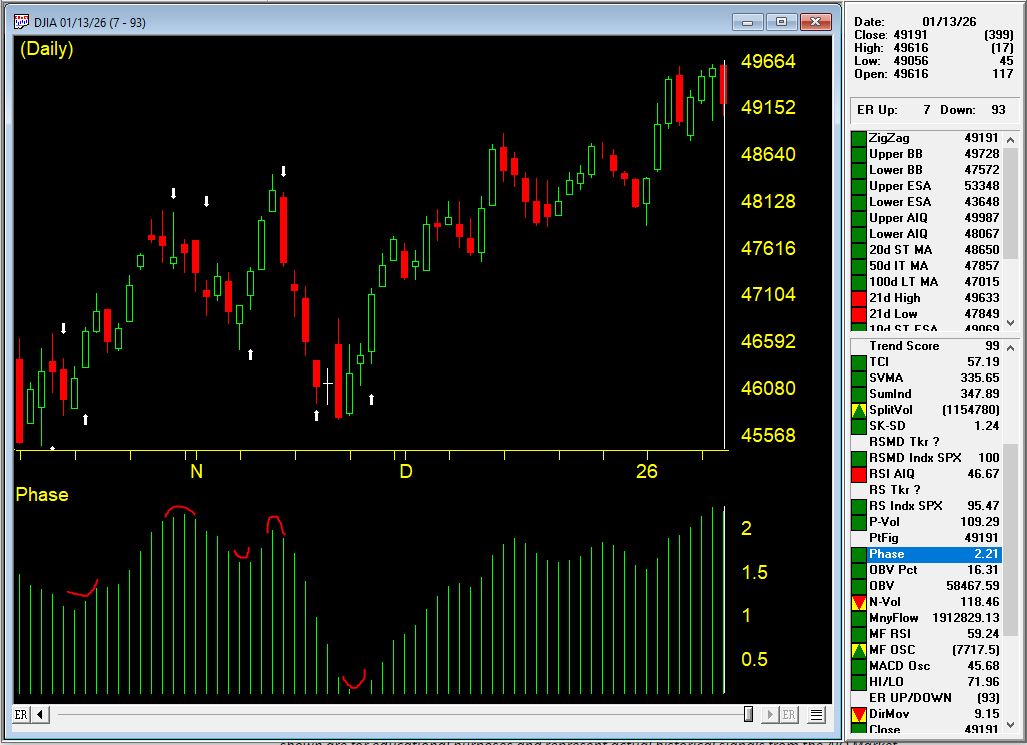
The Rally Continues: over 3000 Points and Counting
From the November 19th entry at 46,138, the market has surged to 49,616 as of January 13, 2026—a gain of over 3,300 points (+7.0%) that is STILL RUNNING.
This ongoing rally has already lasted 45 days and shows the power of staying with a trend when the system confirms the move.
The Complete Picture: What This Teaches Us
Over a 2.5-month period from October 21, 2025 to January 9, 2026, AIQ Market Timing issued five signals:
The Numbers Are Staggering
Total gains captured: over 5,000 points across three rallies Total declines avoided: over 3,000 points across two corrections Current position: Still long in a rally that has gained 7.0%
Compare this to buy-and-hold over the same period:
- Started: 46,707 (Oct 21)
- Current: 49,504 (Jan 9)
- Buy-and-hold gain: +2,797 points (+5.99%)
This sequence demonstrates several critical principles of successful systematic trading:
1. Confirmation Over Single Indicators
Every up signal had multiple rules firing together—not weak, isolated signals but powerful confluences showing aligned market internals. Signal #1 had five rules, Signal #3 had four rules including the reliable NH/NL indicator.
2. Speed Matters
The system caught reversals with remarkable precision: one day after the October high, right at the November 13th high. Manual observation would have missed these turning points.
3. Internal Strength vs. Price Action
The breadth indicators (A/D measures, volume accumulation, UD volume, NH/NL) detected shifts in market character before they became obvious in price alone.
4. Consistency Across Different Market Conditions
This wasn’t a lucky streak. The system worked in:
- Weak upward trends (October)
- Weak downward trends (early November)
- Sideways markets (mid-November)
- Strong sustained uptrends (late November – January)
5. Multiple Cycles Compound Returns
Notice how the system didn’t just catch ONE move—it navigated FIVE distinct market phases. This is where systematic trading truly shines: the ability to stay on the right side of the market through multiple cycles.
6. Reliable Indicators Add Conviction
The New High/New Low indicator appeared in both Signal #3 (bullish reversal) and Signal #4 (bearish reversal), classified as “reliable” both times. When these high-probability signals appear, they deserve attention. Adding in the Phase indicator, confirmation was present for all the signals and is considered a valid confirmation within +/- 3 days of the signal.
7. Both Sides of the Market
This wasn’t just about catching rallies. The system protected capital by identifying when conditions changed, allowing traders to exit longs, stay in cash, or even profit from declines totaling 3,669 points.
Multiply this advantage over weeks, months, and years, and you begin to understand why systematic, rule-based trading provides such a significant edge.
The Bottom Line
AIQ Market Timing isn’t about predictions or gut feelings. It’s about:
- Objective rules that fire based on market internals
- Multiple confirming indicators that reduce false signals
- Real-time alerts that keep you informed as conditions change
- Historical validation proving the methodology works across different market environments
- Consistent performance across multiple market cycles
Are you ready to trade with this level of systematic precision? $1 trial available
Learn more about AIQ Market Timing 98 and other professional-grade technical analysis tools at AIQ Systems.
Past performance does not guarantee future results. All trading involves risk. The examples shown are for educational purposes and represent act