Nov 11, 2018 | expert rating, expert system, indexes, indicators, MACD, market timing, stock market
What is the AI in AIQ?
The AI in TradingExpert Pro is programmed with the knowledge and insight of many stock market professionals, and is capable of making market recommendations based on this knowledge and insight; recommendations are made on a scientific basis free of bias, emotion, or hidden motives.
The AI or expert systems are programmed with rules that combine sound principles of technical analysis with the knowledge and experience of market professionals. Technical analysis, as used by AIQ, is based on the logic that price is the result of supply and demand. An AIQ timing signal, therefore, reflects all available knowledge and opinions such as news of the day, earnings, product reports, and company forecasts.
Technical analysis recognizes price and volume movement as the voice of the market itself and hence the only data necessary to determine what the market is likely to do next.
As an expert system, TradingExpert Pro is comprised of two knowledge bases – one for market timing and a second for stock selection – and an inference engine. Knowledge, in the form of rules, is stored in the knowledge bases. The inference engine is the thinking component of an expert system.
Each of the two knowledge bases within TradingExpert Pro has its own unique rules. The rules operate on facts which are values of the technical indicators. The indicators are computed from daily price, volume, and breadth data.
The rules employed in ATQ TradingExpert Pro are derived from the knowledge of many experts of market action and market timing. The reliability of these rules is maximized by combining them into a higher level of Expert Rules. Market analysts have found that no single rule or indicator works all the time. In AIQ, the Expert Rules and technical indicators work together to generate upside and downside signals.
Different knowledge bases for different market cycles
Continuing research at AIQ has shown that a single knowledge base can be improved if it is split into several knowledge bases, one for each phase of the market cycle. This advancement has been incorporated in the market timing knowledge base. The crest, trough, up slope, and down slope are each addressed by a specific set of rules specialized and weighted for that specific phase of the market cycle.
Each market day, then, the system determines the strength and direction of the phase, or trend. If there is no trend, it is first determined if the cycle is at a crest prior to a downtrend, or in a trough before the next uptrend. A more specialized knowledge base is used for each of these conditions, increasing the overall market timing effectiveness.
The knowledge base fuels the second part of the AIQ expert system, the inference engine. The inference engine is the thinking component of an expert system, and mimics the way humans think.
To understand how the AIQ inference engine works, picture a decision tree. The procedure starts from the tree’s trunk, where the major rules are located. Each rule is represented as a node, or fork, where the tree splits into three branches-representing a yes, a no, or a maybe. If the expert system determines that the premise of a rule is true, then the rule is considered to have fired, giving one of those three answers.
As each rule is evaluated, the process moves on to the next node and subsequent branches and continues to move on through the tree. Each rule node has an assigned value. That value is added to a node total that is accumulated as the inference engine passes through the tree. When all the rules have been evaluated, the resulting node total is normalized and becomes an AIQ Expert Rating.
Finally
The Expert Ratings are based on a scale of 0 to l00. The higher the Expert Rating, the stronger the signal. An Expert Rating of 95 or higher is considered a strong signal, meaning that there is a strong possibility that the price trend is about to change direction.
Confirmation of Expert Ratings
Research has shown that a change in direction of the Phase indicator (changing up for up ER, changing down for down ER) at or close to the high Expert Rating date provides a higher degree of confidence in the rating. Phase is not part of the Expert System.
So let us examine the last 7 weeks market action.
2-98 down signal 9/18/2018, 9/18/18 and 9/20/18 all with these primary riles firing confirmed by phase
Intraday high prices of the market have increased to a 21 day high. Never the less, the advance/decline oscillator is negative. This unusual event is read as a very strong bearish signal that is often followed by an downward price movement.
Closing prices on the market have increased to a 21 day high but market breadth as measured by advances and declines is declining. This non-confirmation in a trading market is a weak bearish signal indicating a possible downward price movement.

DJIA with the 3 successive down signals
Confirmed down signal 4-96 on 10/05/18 these primary rules fires
Trend Status has changed to a strong down trend. This indicates that a downward trend has started that may continue in this direction. This is a moderate bearish signal.
The 21 day stochastic has declined below the 80% line and the price phase indicator is decreasing. In this strongly downtrending market this is an indication that the downtrend will continue.
Confirmed down signal 5-95 on 10/18/2018 these primary rules fires
The market closing average has dropped below the 21 day exponentially smoothed average price. At the same time, accumulation is decreasing. In this down trending market, this is taken as a very bearish signal that could be followed by further decreases in price.
The price phase indicator is positive but volume distribution has started to advance. This is a nonconformation that, regardless of the type of market, is a bearish signal which usually results in an downward movement of the market.

DJIA with 2 more down signals confirmed by phase
Unconfirmed up signal on 10/16/18 – phase did not change direction
Volume accumulation percentage is increasing and the 21 day stochastic has moved above the 20% line. In this downtrending market, this is taken as a strong bullish signal that could be followed by an upward price movement.
The price phase indicator is negative but volume accumulation has started to advance. This is a non-conformation that, regardless of the type of market, is a bullish signal which usually results in an upward movement of the market.
The new high/new low indicator has reversed to the upside. This is a reliable bullish signal that is often followed by an upward movement in prices. In this weak downtrending market an uptrend could start shortly.

DJIA on 10/16/18 97-3 up no phase confirmation
Confirmed up signal 10/31/18 98-2
The 21 day stochastic has advanced and crossed the 20% line and the price phase indicator is also in- creasing. In this weakly downtrending market this is taken as a strong bullish signal suggesting an increase in prices.
Volume accumulation percentage is increasing and the 21 day stochastic has moved above the 20% line. In this downtrending market, this is taken as a strong bullish signal that could be followed by an upward price movement.
The new high/new low indicator has reversed to the upside. This is a reliable bullish signal that is often followed by an upward movement in prices. In this weak downtrending market an uptrend could start shortly.

DJIA on 10/31/18 with confirmed up signal 98-2
While never perfect, the Expert rating provides a formidable advantage to the trader looking for signs of direction changes in the market. As of 11/7/18 close the DJIA was at 26180

Sep 17, 2018 | educational newsletters, ETFs, gold, indicators, jay kaeppel, MACD
Most people are familiar with ADHD, manic-depressive disorder, depression and schizophrenia. But one common affliction within our trading community that gets almost no attention is WESS. That stands for “Wild-Eyed Speculation Syndrome”. And it’s more common than you think (“Hi, my name is Jay”).
The exact symptoms vary, but generally speaking they go something like this:
*A person gets up in the morning with a hankering to make a trade
*Said person then finds “some reason” to make some trade in something
*If the person happens to make money on that trade then the affliction is reinforced by virtue of IGTS (“I’ve Got the Touch Syndrome”, which is one of the occasional side effects of WESS)
*If the person loses money on the trade the side effects can vary but may include: angry outbursts, kicking oneself in the head (typically figuratively), vows to either stop the behavior or at least do it better, and so on.
*The most common side effect of WESS is a declining trading account balance (which not coincidentally is how this disorder is most commonly diagnosed).
For those suffering from WESS – with the caveat/disclosure that I am not a medical professional (although I have found that ibuprofen really clears up a lot of stuff, but I digress) – I am here to help.
If you find yourself suffering from Symptom #1 above:
The most effective step is to go back to bed until the urge passes. If this doesn’t work or is not possible (for instance, if you have one of those pesky “jobs” – you know, that 8-hour a day activity that gets in the way of your trading), repeat these two mantras as many times as necessary:
Mantra 1: “I must employ some reasonably objective, repeatable criteria to find a trade with some actual potential”
Mantra 2: “I will risk no more than 2% of my trading capital” on any WESS induced trade (and just as importantly, you must fend off the voice on the other shoulder shouting “But this is the BIG ONE!!”)
Repeat these mantras as many times as necessary to avoid betting the ranch on some random idea that you “read about on the internet, so it must be true.”
Regarding Mantra 1
There are a million and one ways to find a trade. There is no one best way. But just to give you the idea I will mention one way and highlight a current setup. IMPORTANT: That being said, and as always, I DO NOT make recommendations on this blog. The particular setup I will highlight may work out beautifully, or it may be a complete bust. So DO NOT rush out and make a trade based on this just because you read it – you know – on the internet.
The Divergence
Lots of trades get made based on “divergence”. In this case we are talking about the divergence between price and a given indicator – or even better, series of indicators. There is nothing magic about divergence, and like a lot of things, sometimes it works and sometimes it doesn’t. But the reason it is a viable consideration is that when an indicator flashes a bullish divergence versus price it alerts us to a potential – nothing more, nothing less – shift in momentum.
Let’s look at ticker GDX – an ETF that tracks an index of gold mining stocks. In Figure1 1 through 4 below we see:
*GDX price making a lower low
*A given indicator NOT confirming that new low (i.e., a positive divergence)

Figure 1 – GDX and MACD (Courtesy WinWayCharts TradingExpert)

Figure 2 – GDX and 3-day RSI (Courtesy WinWayCharts TradingExpert)

Figure 3 – GDX and TRIX (Courtesy WinWayCharts TradingExpert)

Figure 4 – GDX and William’s Ultimate Oscillator (Courtesy WinWayCharts TradingExpert)
So, do the divergences that appear in Figures 1 through 4 justify a trade? Well, here is where the aforementioned affliction comes into play.
Average Trader: “Maybe, maybe not. In either case I am not entirely sure that trying to pick a bottom in gold stocks based solely on indicator divergences is a good idea”
WESS Sufferer: “Absofreakinglutely!! Let’s do this!!”
You see the problem.
So, let’s assume that a WESS Sufferer likes what he or she sees in Figures 1 through 4. The good news is that we have met the minimum criteria for Mantra #1 above – we have employed some reasonably objective, repeatable criteria (i.e., a bullish divergence between price and a number of variable indicators) to spot a potential opportunity.
Now we must follow Mantra #2 of risking no more than 2% of my trading capital. Let’s assume our WESS Sufferer has a $25,000 trading account. So he or she can risk a maximum of $500 ($25,000 x 2%).
In Figure 5 we see a potential support area for GDX at around $16.40 a share.

Figure 5 – Ticker GDX with support at $16.40 (Courtesy WinWayCharts TradingExpert)
So, one possibility would be to buy 300 shares of GDX at $17.84 and place a stop loss order below the “line in the sand” at say $16.34 a share. So if the stop is hit, the trade would lose -$450, or -1.8% of our trading capital (17.84 – 16.34 = -1.50 x 300 shares = -$450).
Summary
Does any of the above fit in the category of “A Good Idea”. That’s the thing about trading – and most things in life for that matter – it’s all in the eye of the beholder. Remember, the above is NOT a “recommendation”, only an “example.”
The real key thing to note is that we went from being just a random WESS Sufferer to a WESS Sufferer with a Plan – one that has something other than just an “urge” to find a trade, AND (most importantly) a mechanism for limiting any damage that might be done if things don’t pan out.
And if that doesn’t work, well, there’s always ibuprofen.
Jay Kaeppel
Disclaimer: The data presented herein were obtained from various third-party sources. While I believe the data to be reliable, no representation is made as to, and no responsibility, warranty or liability is accepted for the accuracy or completeness of such information. The information, opinions and ideas expressed herein are for informational and educational purposes only and do not constitute and should not be construed as investment advice, an advertisement or offering of investment advisory services, or an offer to sell or a solicitation to buy any security.
Mar 23, 2017 | educational newsletters, indicators, MACD
There are many ways to use the MACD indicator developed long ago by Gerald Apel. This is one of them. Maybe. Nothing more, nothing less.
First the caveat: what follows is NOT a “trading system” or even something that you should consider on a standalone basis.
MACD
The MACD indicator uses exponential moving averages to identify the underlying trend for a given security and is also used by many traders to identify divergences which may signal an impending change of trend.
Figure 1 displays the daily MACD for ticker SPY.
Figure 1 – Ticker SPY with MACD Indicator (Courtesy
WinWay Charts )
While this is NOT intended to be a mechanical signal, I am going to put specific rules on it just to give it some structure. The rules:
1) If the daily MACD (12,26,9) has declined for at least 7 consecutive trading days AND
2) The 2-day RSI is at 64 or above
Then an “alert” signal is flashed. The key thing to note is that if the MACD ticks higher on the day that the 2-day RSI rises above 64, the signal is negated.
Before proceeding please note that the 12,26,9 parameter selection is simply the “standard” for MACD. Also, there is nothing magic about 7 consecutive days – so one might experiment with different values there. Finally, using the 2-day RSI and a “trigger” value of 64 are also both arbitrary. There may be better values and/or different overbought/oversold indicators to use.
Ticker GS
A “classic” example of the MACD Tell appears in Figure 2 using ticker GS.
The MACD Tell is typically best used as a short-term indicator. In this case a short-term trader might have considered playing the short side of GS – or even better – using option strategies such as buying puts or selling bear call spreads.
Summary
No one should rush out and start trading put options based on this indicator (or any other indicator for that matter) without spending some time doing some homework and testing out the viability for producing profits.
In reality, this is the type of indicator that should typically be combined with “something else” and/or used as a confirmation rather than as a standalone approach.
Jay Kaeppel
Disclaimer: The data presented herein were obtained from various third-party sources. While I believe the data to be reliable, no representation is made as to, and no responsibility, warranty or liability is accepted for the accuracy or completeness of such information. The information, opinions and ideas expressed herein are for informational and educational purposes only and do not constitute and should not be construed as investment advice, an advertisement or offering of investment advisory services, or an offer to sell or a solicitation to buy any security.
Apr 7, 2016 | chart patterns, MACD, options
In this article I detailed one relatively “simple” approach to using the MACD indicator to identify potentially bullish opportunities. In this piece we will look at one to actually put those signals to use.
The Limited Risk Call Option
One possibility upon generating a bullish signal as described in the last article is to buy shares of the stock/ETF/index/etc in question. Not a thing wrong with that. But there is a less expensive alternative.
Figure 1 reproduces Figure 1 from the last piece showing ticker XLF. Let’s look at the signal generated on 2/12/16.
One alternative that I like is to use the “Percent to Double” routine at
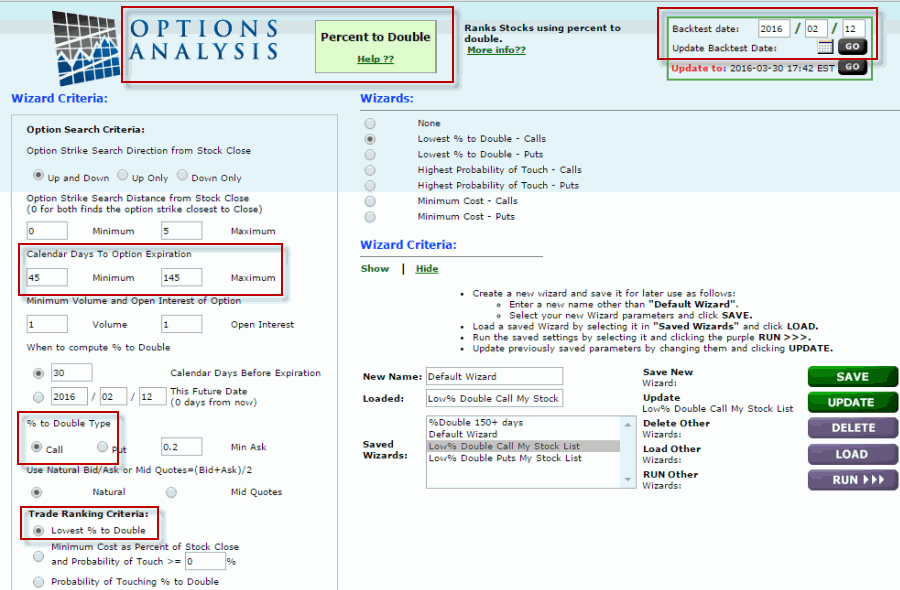
www.OptionsAnalysis.com to find an inexpensive call option that has lot of upside potential. The input screen with a few key input selections highlighted appears in Figure 1a (if it looks intimidating please note that a reusable set of criteria can be captured in a “Saved Wizard”, which appear towards the lower right of of Figure 1a. Once a set of criteria is saved it can be reused by simply clicking on the Wizard name and clicking “Load”.)
NOTE: My own personal preference is to consider options that have at least 45 days left until expiration (as time decay can become a very negative factor as option expiration draws closer).
Figure 1a – Percent to Double
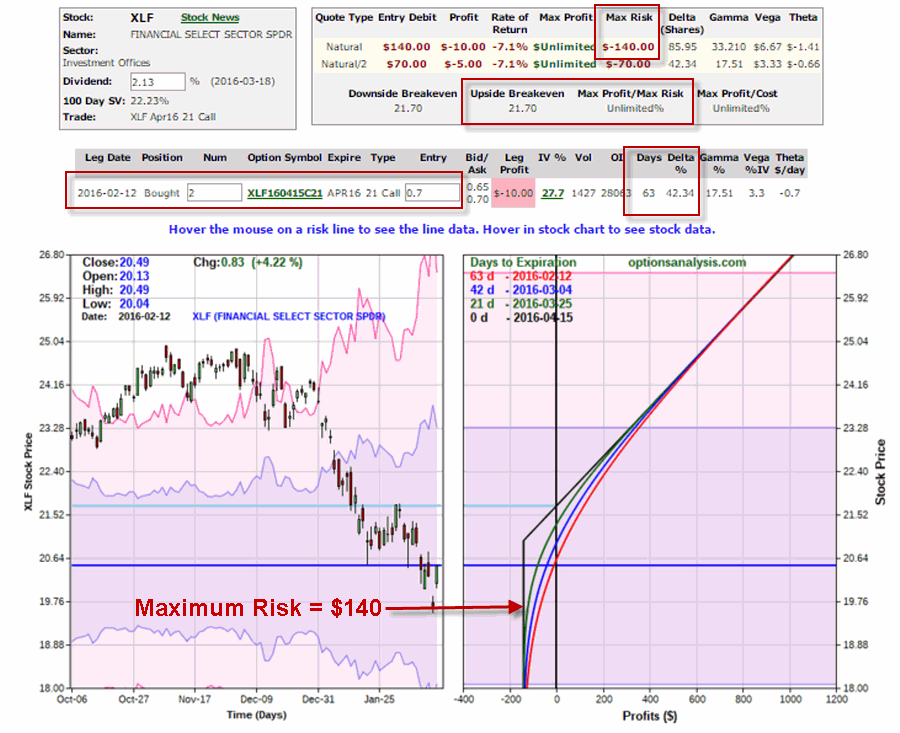
Figure 1b displays the output screen.
NOTE: For my own purposes I like to see a Delta of at least 40 for the option I might consider buying (nothing “scientific” here. It is just that the lower the Delta the further out-of-the-money the option strike price is. I prefer to buy a strike price that is not too far from the current price of the stock; hence I look for a Delta of 40 or higher). With XLF trading at $20.49, in Figure 1b I have highlighted the 2nd choice on the list – the April 21 call – which has a delta of 43.
So a trader now has two alternatives:
*Buy 2 Apr 21 strike price XLF calls for $70 apiece ($140 total cost; 86 total deltas)
*Buy 86 shares of XLF at $20.49 apiece ($1,760 total cost, 86 total deltas)
Figure 1c displays the particulars for buying a 2-lot of the April 21 call for a total cost of $140.
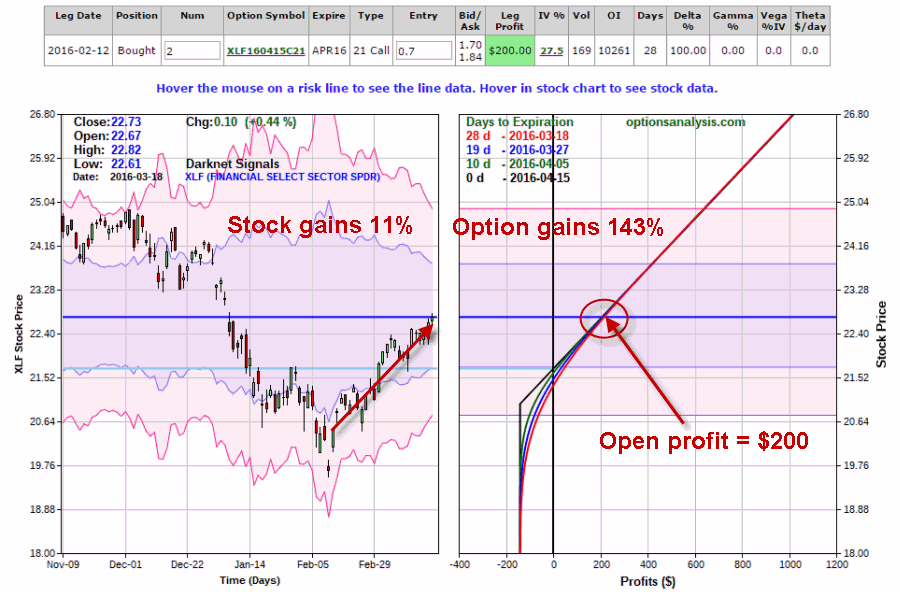
By 3/18 the shares had gained 11% and the Apr 21 call had gained 143%. See Figure 1d.
Summary
Obviously not every trade works out as well as this one. Still, the key things to remember are:
*The option trade cost $140 instead of $1760
*The worst case scenario was a loss of $140.
Something to think about.
Chief Market Analyst at JayOnTheMarkets.com and TradingExpert Pro client
Mar 30, 2016 | indicators, MACD
One danger of getting “way to into” the financial markets is that you can find yourself progressing into some needlessly complicated stuff (“Hi, my name is Jay”). I mean it is only natural to wonder “hey, what if I divided this indicator value by that indicator value” and such. But once you start finding yourself taking an exponential moving average of a regression line with a variable lag time, well, you can find yourself “a tad far afield.” (Trust me on this one). Which leads us directly to:
Jay’sTradingMaxim #44: Every once in awhile it pays to remember that the end goal is simply to make money. The more easily the better.
So today let’s go back to a simple “basic approach.”
The Bullish MACD Divergence
We will define an “asset” as any stock, ETF, commodity, index, etc. that can be traded on an exchange (and for my purposes, there should be a liquid market for options on that asset).
Step 1. An asset price falls to a new 20-day low and the MACD value is less than 0. Note the MACD value on this date.
Step 2. Not less than one week but not more than 2 months later:
*Price closes below its closing level in Step 1
*The MACD indicator is above its level at the time of Step 1
Step 3. The next time the daily MACD indicator “ticks higher” a buy alert is triggered
Can it really be that simple? The Good News is “Yes, it can.” The Bad News is that “It isn’t always.” To put it another way, like a lot of trading methods it can generate a surprising abundance of useful trading signals. However, there is no guarantee that any given signal will turn out to be timely. In other words:
This method gives you a good guideline for when to get in, but:
*It may be early at times (i.e., price will move lower still before advancing)
*It will at times be flat out wrong
*You still have to decide when to exit the bullish position.
*Call options are useful with this approach as it allows you to risk a limited amount of capital.
Examples
Figures 1 through 4 highlight some recent examples using this method. Note that the charts show only entry points. Exit points are “a separate topic”.
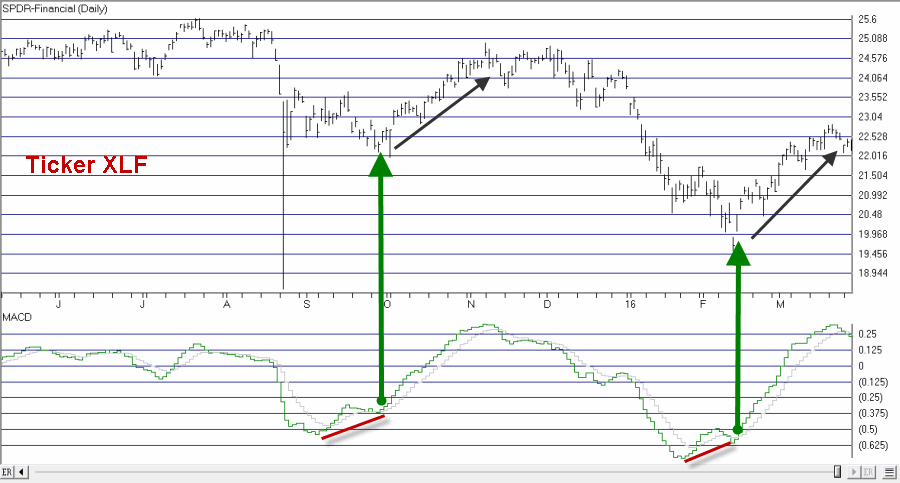
Figure 1 – Ticker XLF (Courtesy TradingExpert Pro)

Figure 2 – Ticker WMT (Courtesy TradingExpert)
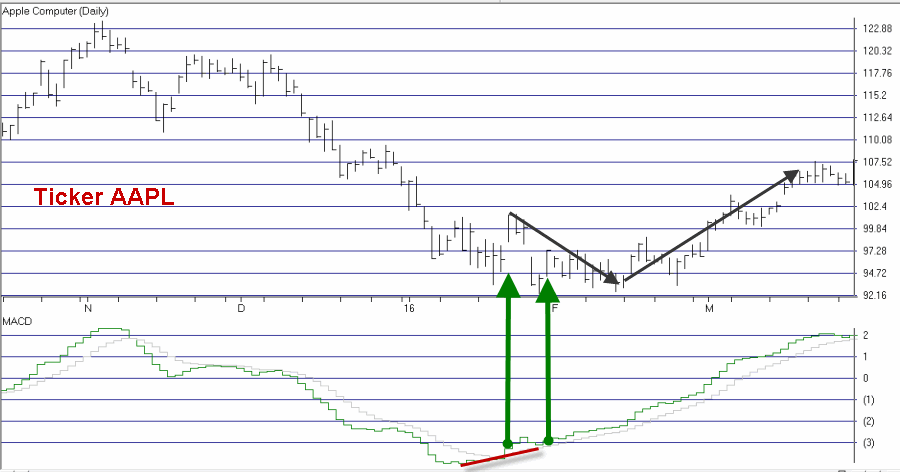
Figure 3 – Ticker AAPL (Courtesy TradingExpert)
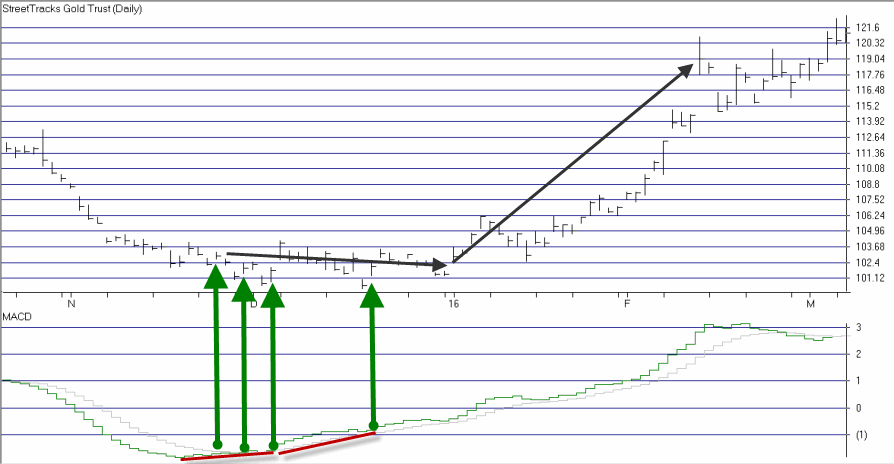
Figure 4 – Ticker GDX (Courtesy TradingExpert)
As you can see, some signals were quite timely while others were quite early. For the record, I started getting bullish on gold and gold stocks early in 2016 based in part on the multiple alerts that appear in Figure 4.
Chief Market Analyst at JayOnTheMarkets.com and TradingExpert Pro client
Aug 27, 2014 | indicators, MACD
The MACD indicator is a useful addition to any stock trading strategy. It is a good measure of momentum, trend direction and can also be a good guide to the relative strength of the market, indicating whet…her the market is overbought or oversold.
However, like all technical indicators there are a number of advantages and disadvantages that any trader should know before incorporating it into their strategy.

WinWay TradingExpert Pro chart of MACD with default 12, 26, 9 settings on SPY
Disadvantages
The main disadvantage of the MACD indicator is that it is subjective to the user. Like many technical indicators , the MACD has settings that can be changed to give almost limitless numbers of variations which means results will always differ from person to person. A trader must decide for example what moving averages to choose. The suggested settings are the 12 day moving average, 26 day and 9, however, these can easily be changed. Secondly, a trader must know what timeframe the MACD works best on and there are no easy answers, since the MACD will tend to work differently across different markets. Generally, however, the MACD works best when it is confirmed across several different timeframes – especially further out timeframes such as the weekly chart.
Lagging indicator
Unless using the momentum divergence strategy which seeks to pick tops and bottoms before they occur, the MACD has an inherent disadvantage that occurs with all technical indicators that concern price history such as moving averages. Since moving averages are lagging indicators, in that they measure the change in a stock price over a period of time (in the past), they tend to be late at giving signals. Often, when a fast moving average crosses over a slower one, the market will have already turned upwards some days ago. When the MACD crossover finally gives a buy signal, it will have already missed some of the gains, and in the worst case scenario it will get whipsawed when the market turns back the other way. The best way to get around this problem is to use longer term charts such as hourly or daily charts (since these tend to have fewer whipsaws). It is also a good idea to use other indicators or timeframes to confirm the signals.
Early signals
While the crossover strategy has the limitation of being a lagging indicator, the momentum divergence strategy has the opposite problem. Namely, it can signal a reversal too early causing the trader to have a number of small losing traders before hitting the big one. The problem arises since a converging or diverging trend does not always lead to a reversal. Indeed, often a market will converge for just a bar or two catching its breath before it picks up momentum again and continues its trend.
The solution to such limitations, once more, is to combine it with other indicators and use different confirmation techniques. The ultimate test is to set the MACD up in code and test the indicator yourself on historical data. That way you are able to find out when and in which situations and conditions the indicator works best.
The MACD is one of over 100 indicators available in WinWay TradingExpert Pro, Darren Winter’s preferred trading software. Existing WinWay TradingExpert Pro clients can find the indicator in their Chart Control Panel (MACD).
New to WinWay TradingExpert Pro? Try a FREE trial of Darren Winter’s preferred trading software at https://winwaycharts.com/wordpress/tradingexpert-pro-free-trial/


