The Value of the ‘Perspective’ Indicator
Jay Kaeppel
Chief Market Analyst at JayOnTheMarkets.com and TradingExpert Pro client
http://jayonthemarkets.com/
Jay Kaeppel
Chief Market Analyst at JayOnTheMarkets.com and TradingExpert Pro client
http://jayonthemarkets.com/
There are a virtually unlimited number of ways to play the financial markets. This is especially true in the area of options trading, where a bullish trader can pick from at least at a dozen different strategies (buy call, buy a bull call spread, sell a bull put spread, collar, out-of-the-money calendar spread, etc., etc.).
At some point it can all become a bit overwhelming to the quote, unquote, “average investor.” So sometimes the place to start is, well, anywhere, so long as that anywhere has a beginning and an end and a logical progression to it. What does that mean? It means I am going to walk through “one way to play.” I make no claim that it is the “best” way, or even a “great” way. But that’s OK because the purpose here is not for you to rush out and start trading with it, but rather to stimulate your own thinking on the subject. In other words, hopefully in reading this a “light” will go on for you in regards to your own trading. So here goes.
Jay’s “Light” Option Trading Strategy
This strategy involves a set of steps designed to generate a bullish option trade based on a logical set of criteria. For this strategy we will look for a couple of things:
1. A “catalyst” to tell us when to buy call options.
2. Stocks that enjoy good option trading volume and tight bid-ask spread.
3. Stocks that are performing well overall.
4. Stocks that have experienced a recent pullback and may now be due for a bounce.
#1. The “Catalyst”
We will look for ticker SPY to be above its 200-day moving and for the 3-day RSI to drop to 20 or below and then reverse to the upside. Figure 1 displays a number of such signals.
#2. Stocks with good option volume and tight bid/ask spreads.
In Figure 2 we see the “Stock List Filter” report from www.OptionsAnalysis.com. This list contains 493 stocks that trade at least 1,000 options a day and those options have an average bid/ask spread of less than 2% (only the top part of the list is visible in Figure 2).
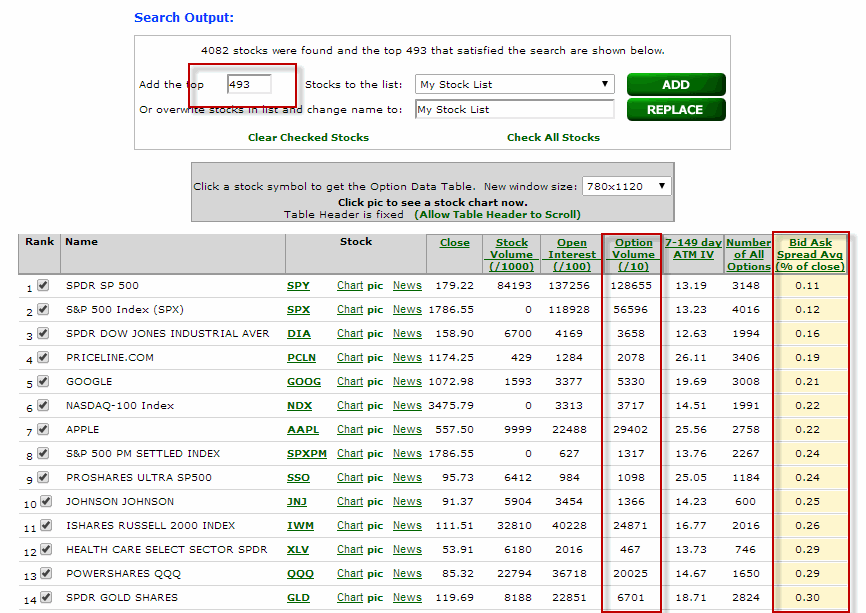 Figure 2 – Stocks with good option volume and tight bid/ask spreads (Courtesy: www.OptionsAnalysis.com)
#3. Stocks that are performing well overall
Next we take the stocks shown in Figure 2 and run them through the “Channel Finder” routine in www.OptionsAnalysis.com. We will look for the top 100 stocks based on the strength of their “Up Channel”. We overwrite “My Stock List” with just those 100 stocks. The output list appears in Figure 3.
In Figure 4 we see ticker SFUN with a very strong recent Up Channel
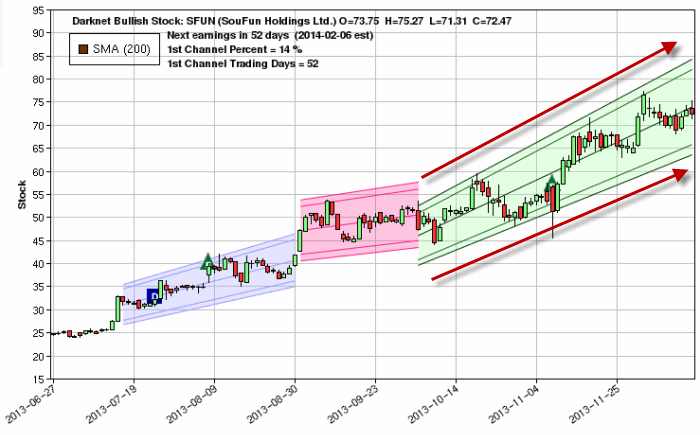 Figure 4 – Ticker SFUN with Up Channel (Courtesy: www.OptionsAnalysis.com)
#4. Stocks that have experienced a “pullback”
Lastly, we will look through the 100 stocks still on our list for those that have experienced a 3-day RSI of 35 or less within the past 5 trading days. As you can see in Figure 5, only 19 stocks now remain for consideration.
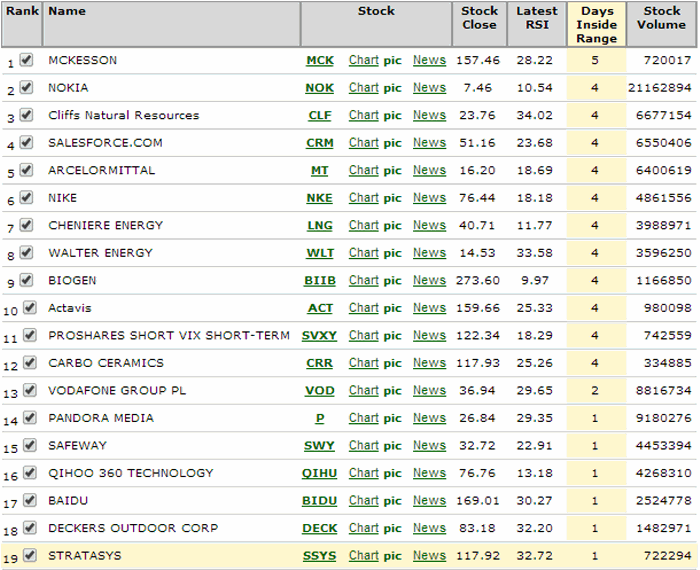 Figure 5 – Stocks that have had a 3-day RSI reading of 35 or less in past 5 days (Courtesy: www.OptionsAnalysis.com)
The Next Step: Finding a Trade
From here a trader can use whatever bullish option strategy they prefer to find a potentially profitable trade among these 19 stocks. For illustrative purposes we will:
-Consider buying calls with 45 to 145 days left until expiration and Open Interest of at least 100 contracts.
-Initially sort the trades by a measure known as “Percent to Double”, as in “what type of percentage move does the underlying stock have to make in order for the option to double in price?”
-Once we get that list e will sort by “Highest Gamma” in an effort to get the most “bang for the buck.”
We see the output list in Figure 6.
The top trade listed in to buy the MRVL Feb 2014 14 Call @ $0.73 (or $73 per option)
In Figure 7, we see that MRVL rallied nicely within a few weeks from 13.61 to 15.81.
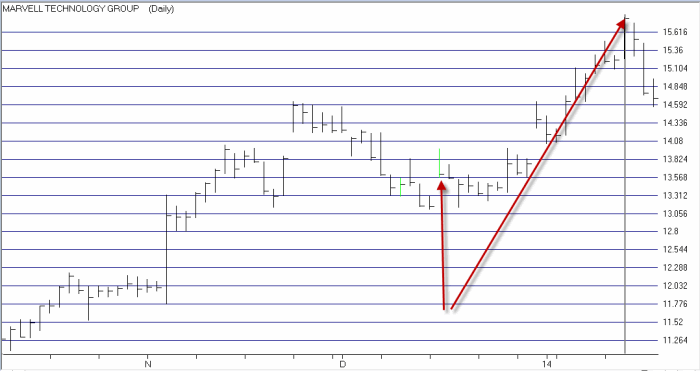 Figure 7 – MRVL rallies (Courtesy: www.OptionsAnalysis.com)
In Figure 8 we see that the Feb 14 call option gained 169.9%.
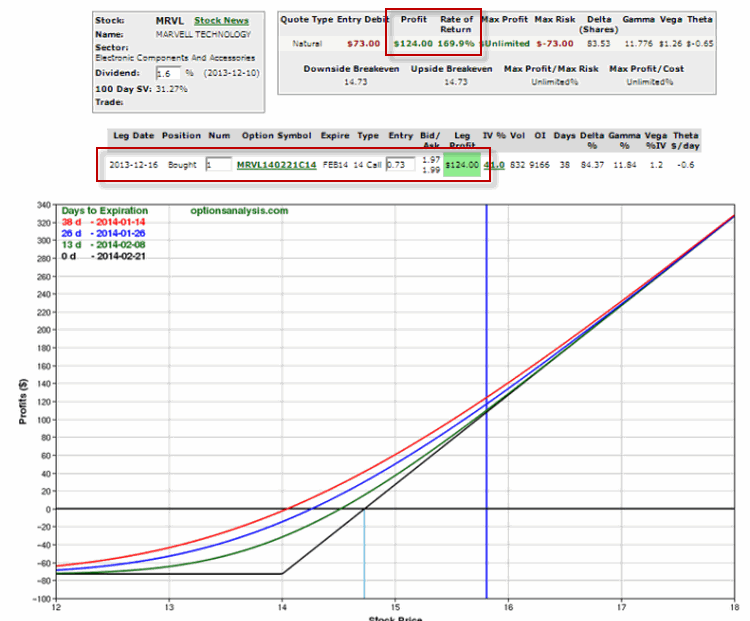 Figure 8 – MRVL 14 call rallies sharply (Courtesy: www.OptionsAnalysis.com)
Of course there is also the whole topic of what to do with this trade: close it, sell some, adjust it, etc. Sorry folks, that’s beyond the scope of this article.
Summary
So does every trade work out this well? That reminds me of a joke. A salesman rings he doorbell of a home and a 12–year old boy answers the door. The boy has a beautiful woman on each side, a drink in one hand and a big cigar in his mouth. Momentarily stunned the salesman finally manages to ask hesitantly, “Um, is your mother home?”
The boy removes the cigar from his mouth, looks straight at the salesman and asks, “What do you think?”
Same answer here. Still, a logical set of steps is a good place to start.
Jay Kaeppel
AIQ Opening bell contributor and TradingExpert Pro client, jay Kaeppel has a FREE webinar in association with the Market Technicians Association. details are below
On Wednesday, November 20th, 2013, the MTA’s Educational Web Series continues with another free educational webcast event at 12 PM Eastern / 9 AM Pacific. This week, we will feature…
With all of the trading vehicles and great opportunities now available, there has never been a better time to be a trader. The key to success is to identify and take advantage of exceptional opportunities. In this fast-paced session, market veteran and author Jay Kaeppel reveals a handful of unique trading methods that you have likely never considered. Each method details a simple, objective and highly effective plan of action. Take a journey off the beaten path and discover simple trading strategies designed to succeed in the long run.
They say that complacency is the enemy of the stock market. If so, the action of ticker VXX – the exchange-traded fund designed to track the VIX Index – may be of interest.
The indicator known as “Narrow Range 7”, or NR7 for short was first introduced by Toby Crabel some time back in the 1980’s or 1990’s. The theory is that when the difference between today’s high price and low price for a given security is the smallest it’s been over the past 7 trading days, that security is said to be “contracting” or “compressing.” The theory goes that – just as ying follows yang – once the compression is over there should be an “expansion”, – i.e., a meaningful price movement.
Now this is not always necessarily the case – i.e., a security can remain mired in a range for a good long while. In addition, a simple NR7 gives no indication on its own as to whether the ensuing price expansion will be to the upside or to the downside. Still, please note the chart in Figure 1. This extreme compression DOES NOT guarantee or even imply that the stock market is about to decline. But it sure does seem to signal a whole lot of complacency among investors.
In all candor I am not entirely sure what this means. My gut tells me that following the whole “shutdown/debt limit” crisis, and with QE2IB (Quantitative Easing to Infinity and Beyond) set to feed liquidity to the market until the end of time, it is pretty much assumed that the stock market has nowhere to go but higher.
Complicating this for me personally is that most of my indicators are bullish, so I am not inclined to pound the table and shout “the end is near!” (although it is kind of fun to see the looks on people’s faces when I do it just for fun.)
Still, it is not a stretch to think that we could be setting up for a nasty surprise in the near-term (i.e., sometime in the next several weeks) which would certainly surprise the heck out of most investors. People who are inclined to hedge might consider buying VXX December 13 strike price call options (as I write, it is $99 for a 1-lot, with the futures suggesting that stock indexes will open higher, i.e., that VXX will open lower).

Figure 2 – VXX December 13 call (Courtesy: ww.OptionsAnalysis.com)
Summary
Everything – trend-following, seasonal, liquidity – seems to point to a bullish trend in the stock market. And I am not one to stand in the way. But historically when everything “looks good” for the stock market, one of two things happens: Either the stock market:
a) trends higher based on the bullish confluence of indicators, or,
b) the market surprises the daylights out of the majority with a nasty surprise.
$99 to insure against b seems like a reasonable price to pay.