WinWayCharts pre-built Relative Strength report offers a valuable tool for those seeking to capitalize on sector rotation. By shifting the focus to ETFS and cloning the report as closely as possible in the AIQ Expert Design Studio, we gain the ability to apply additional screening criteria. This adds a layer of flexibility, that can achieve significant market outperformance. . Through WinWayCharts Expert Design Studio (EDS) program, users gain the freedom to create their personalized screening techniques.
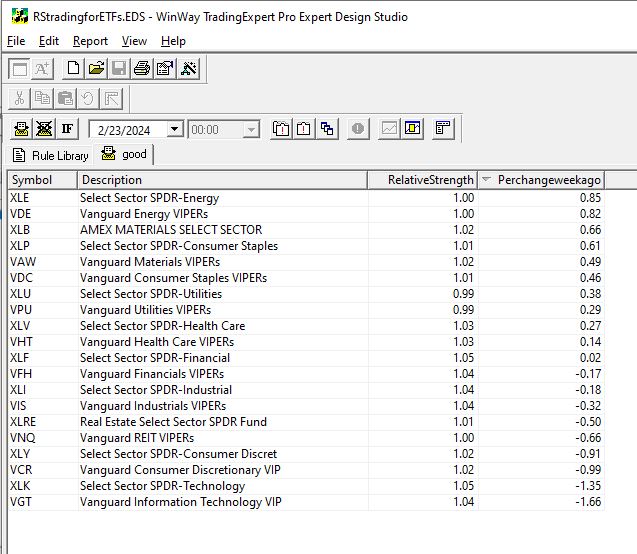
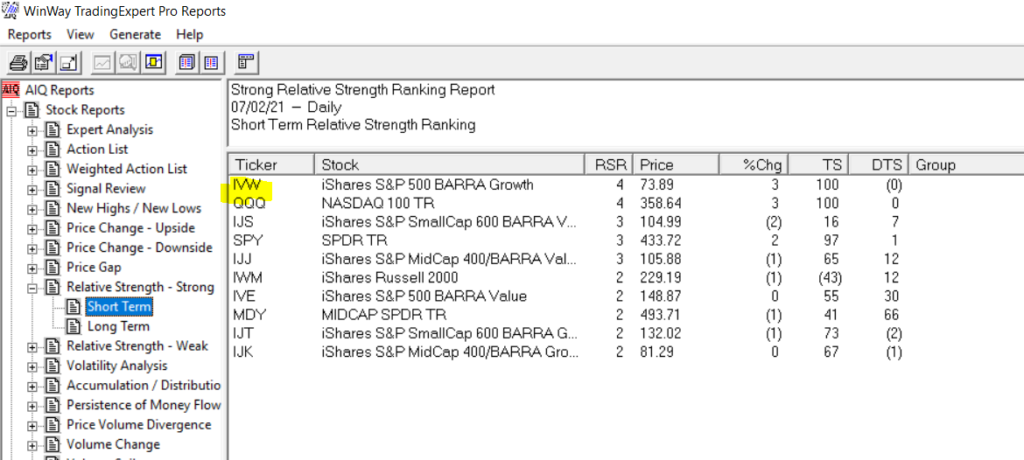
The approach we aim for is to utilize an EDS model that seeks out high relative strength. To refresh your memory, the short-term Relative Strength report considers the last 120 trading days, divides this period into quarters, and then calculates the average percent change for each quarter with a heavier weight on the most recent quarter. Here’s the EDS code:
RelativeStrength is 0.4Period1+ 0.2Period2 + 0.2Period3 +0.2Period4.
Description is Description().
RSvalue5daysback is valresult(RelativeStrength,5).
Perchangeweekago is ((RelativeStrength – RSvalue5daysback)/RSvalue5daysback)*100.
! change is Perchangeweekago.
good if 1.
Using this code, an EDS report can be generated to rank ETF sectors from strongest to weakest. While investing in high relative strength sectors can be effective, some individuals might feel uneasy about buying when prices are already high. Often, they regret not entering the market earlier upon seeing a high RS sector.
For those preferring to enter a trend earlier, we can integrate a new screening into our EDS report. We’ve discovered that monitoring the weekly change in RS ranking is valuable for determining whether a sector is gaining or losing momentum.
Relative Strength serves as the primary screening metric, where the objective is to hold positions that appear at the top of the report. Instead of purchasing assets immediately when they top the report, some traders may opt to utilize the Change column to identify sectors with the strongest upward momentum. By selecting sectors with the highest Change numbers, you are essentially investing in sectors exhibiting robust momentum in relative strength.
Traders can easily sort sectors by the Change column by clicking on its title. The benefit of entering sectors with a high Change score is the potential for earlier trend entry. However, the drawback is the possibility of false signals—instances where a trend fails to materialize, causing the sector to stagnate in the relative strength ranking.
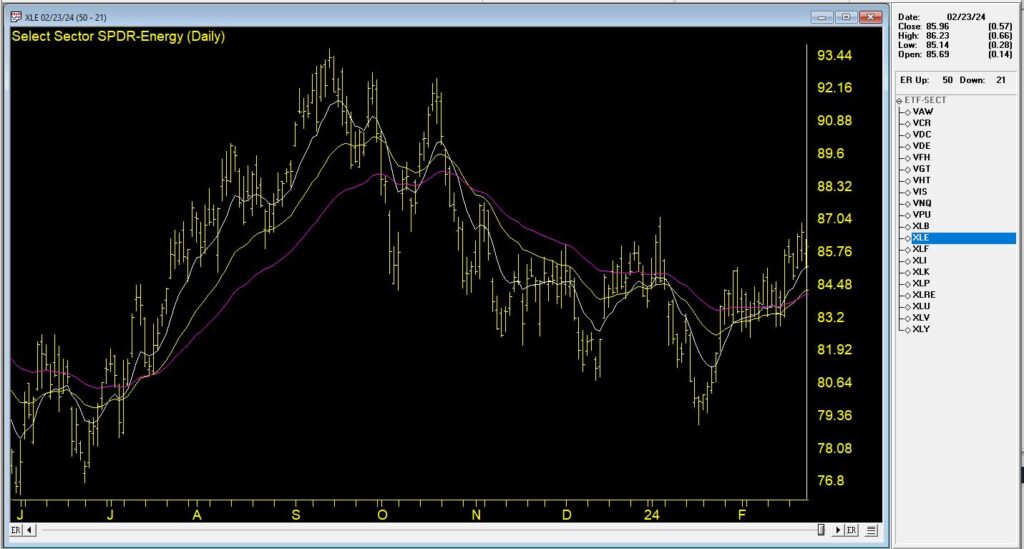
Investing in high relative strength sectors or sectors with improving relative strength figures presents a solid strategy for entering industry sectors. These approaches can be combined to create a more dynamic strategy. With the combination strategy, the goal is to identify sectors with both high Relative Strength readings and positive Change readings, indicating strength and ongoing improvement.
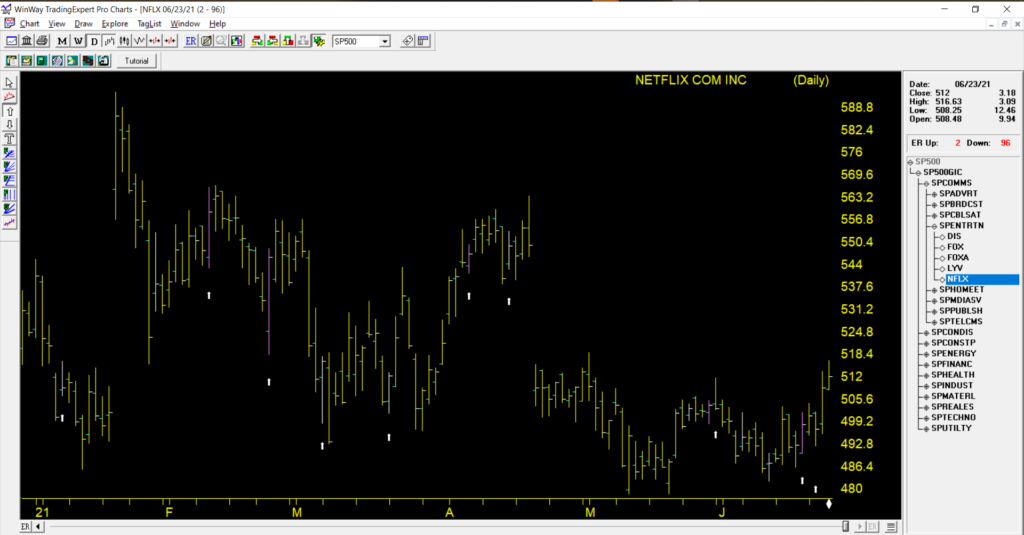
In this Chart, we see the top % change ETF from 2/23/24. The recent trend is up and it’s accelerated in the last week.
By employing the combination strategy, the focus typically narrows down to selections at or near the top of the Relative Strength column with positive Change readings. This dual approach ensures a focus on strong sectors and becoming even stronger, optimizing the potential for successful investments.
The EDS file mentioned in this article is available to download click here
Download and save this file to your /wintes32/ EDS Strategies folder.
The Sector ETF list is available to download click here
Download and save this file to your /wintes32/ folder.
The importable EDS file based on John Ehlers’ article in the March 2023 issue of Stocks & Commodities, “Every Little Bit Helps,” can be obtained on request via rdencpa@gmail.com. John notes ‘It’s simple but makes a noticeable improvement: You can reduce noise in the data by using an average of the open and close instead of using only the closing price.’ The code is also available below.
!Every Little Bit Helps
!Author: John F. Ehlers, TASC Mar 2023
!Coded by: Richard Denning, 1/12/2023
!Data Sampling Test
!(c) John Ehlers 2022
!INPUTS:
W1 is 14. !Wilder RSI length
W2 is 14. !Ehlers RSI length
!RSI Wilder code:
U is [close]-val([close],1).
D is val([close],1)-[close].
L1 is 2 * W1 – 1.
AvgU is ExpAvg(iff(U>0,U,0),L1).
AvgD is ExpAvg(iff(D>=0,D,0),L1).
RSIwilder is 100-(100/(1+(AvgU/AvgD))).
!Ehlers RSI code:
OCavg is ([open] + [close])/2.
Uoc is OCavg-valresult(OCavg,1).
Doc is valresult(OCavg,1)-OCavg.
L2 is 2 * W2 – 1.
AvgU2 is ExpAvg(iff(Uoc>0,Uoc,0),L2).
AvgD2 is ExpAvg(iff(Doc>=0,Doc,0),L2).
RSIoc is 100-(100/(1+(AvgU2/AvgD2))).
!CTest is RSIwilder.
!OCTest is RSIoc.
BuyRSIwilder if RSIwilder < 20 and valrule(RSIwilder >= 20,1).
ExitRSIwilder if RSIwilder > 80 or {Position days}>=20.
BuyRSIoc if RSIoc < 20 and valrule(RSIoc >= 20,1).
ExitRSIoc if RSIoc > 80 or {Position days}>=20.
Code for the author’s indicators are set up in the EDS code file. Figure 7 shows the EDS module backtest results using the RSI original indicator. Figure 8 shows the EDS module backtest results using the modified version of the RSI indicator over a 10-year period using NASDAQ 100 stocks. The comparison suggests that some of the metrics improve using the modified version and a few are worse.
The system rules are:
Buy when the RSI crosses down below 20
Sell when the RSI crosses above 80 or after 20 trading days
FIGURE 7: AIQ. This shows example backtest results for classic RSI trading system rules, based on closing data, over a 10-year period using NASDAQ 100 stocks.FIGURE 8: AIQ. This shows example backtest results for the RSI trading system rules, this time based on data that averages the open and close instead of using just the closing price data, over a 10-year period using NASDAQ 100 stocks.
The importable EDS file based on Scott Cong’s article in the May 2023 issue of Stocks & Commodities magazine, “An Adaptive Moving Average For Swing Trading,” can be obtained on request via rdencpa@gmail.com.
In this article, Scott proposes a new adaptive moving average (AMA). It adjusts its parameters automatically according to the volatility of market, tracking price closely in trending movement, and staying flat in congestion areas. The new AMA is well-suited for swing trading.
The code is also available below.
Code for the author’s indicator as shown below is set up in the downloadable EDS code file.
!ADAPTIVE MOVING AVERAGE FOR SWING TRADING
!Author: Scott Cong, TASC May 2023
!Coded by: Richard Denning, 03/14/2023
!INPUTS:
Len is 20.
!CODING ABREVIATIONS:
H is [high].
L is [low].
C is [close].
C1 is val([close],1).
TR is Max(H-L,max(abs(C1-L),abs(C1-H))).
Effort is sum(TR,Len).
Result is highresult(H,Len) – lowresult(L,Len).
alpha is Result / Effort.
beta is 1 – alpha.
DaysInto is ReportDate() – RuleDate().
Stop if DaysInto > Len*2.
stopAMA is iff(stop,C, AMA).
AMA is alpha * [close] + beta * valresult( stopAMA, 1).
ESA is expavg(C,Len).
The figure below shows a chart of Broadcom (AVGO) along with the AMA[20] indicator (the red jagged line) and an exponential moving average indicator [20] (the green smooth line).
In her article in the December 2022 issue of Stocks and Commodities, “Short-Term Continuation And Reversal Signals,” Barbara Star describes modifications to the classic directional movement indicator (DMI) and commodity channel index (CCI) that can aid in more easily identifying price reversals and continuations in a trend. Traditionally, the DMI is comprised of two lines: a positive line (+DI) and negative line (−DI).
In her article, Star creates a DMI oscillator by subtracting −DI from +DI. Historically, the DMI uses a default length of 14. In the article, this has been shortened to 10. The CCI has also been adjusted in the article to use a length of 13 instead of the usual 14 or 20. The oscillator is setup using an AIQ Color Study
The importable WinWayCharts EDS file can be obtained on request via email to info@TradersEdgeSystems.com. The code is also shown here:
! Short-Term Continuation And Reversal Signals
! Author: Barbara Star, TASC Dec 2022 ! Coded by: Richard Denning, 10/21/2022
C is [close].
H is [high].
L is [low].
H1 is valresult(H,1).
H2 is valresult(H,2).
L1 is valresult(L,1).
L2 is valresult(L,2).
GreenDMI if [DirMov] > 0.
RedDMI if [DirMov] < 0.
StartOfDownTrend if C < simpleavg(C,18) and [DirMov] < 0 and H < H1 and H1 > H2.
StartOfUpTrend if C >= simpleavg(C,18) and [DirMov] >= 0 and L > L1 and L1 < L2.
GreenTrend if C >= simpleavg(C,18) and [DirMov] >= 0.
RedTrend if C < simpleavg(C,18) and [DirMov] < 0.
Code for the author’s color study is set up in the WinWayCharts EDS code file. Figure 7 shows the color studies set up in the charts module. Figure 8 shows the color studies on a chart of Apple, Inc. (AAPL). The black bars are potential entry points in the downtrend.
FIGURE 7: WinWayCharts. The color bar setup in the charts module is demonstrated.
FIGURE 8: WinWayCharts This shows an example of the color studies applied to a chart of Apple, Inc. (AAPL) with a DMI histogram and an 18-bar simple moving average.
September 7, 2022 – 3pm to 7pm London time, four hour in-depth webinar
covering these in-depth topics, crucial to your successful trading.
Early bird pricing now in effect, see below to book your discounted price and save over 20%
****** Includes PDF handouts and access to the recordings of the event ******
Session 1 – Power tools and features in your WinWayCharts and how to use them
Color Studies, Overlays, Custom Indicators, Seasonality, and Matchmaker. These are important and powerful tools in your WinWayCharts. In this session, we’ll show how to set a Color Study and why, what Overlays are useful for, and more. Learn how these tools will save you time and how they contribute to your trading decisions. Darren’s 3 favourite Bullish/Bearish strategies will be used as the basis for the color study.
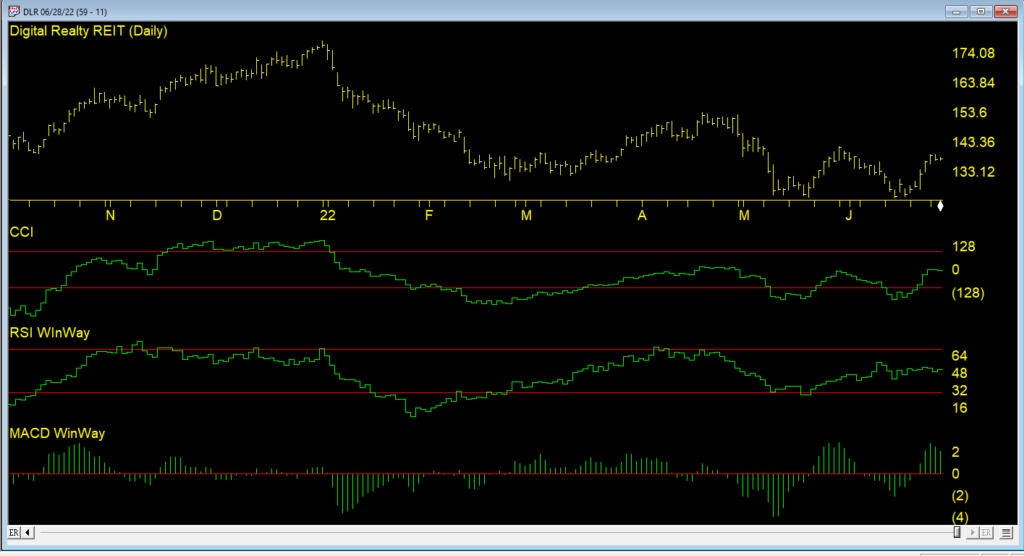
Session 2 – Darren’s Indicators and how to apply them
Some indicators are more reliable than others. In this session, we’ll look at some of the nuances of MACD WinWay, RSI WinWay and the CCI indicators and how they add confidence to our trading decisions. We’ll explore these 3 indicators in-depth with examples of them in action in the stock market.
Session 3 – Exchange traded funds rotation strategy so you never have to go short
Using the reports in WinWayCharts we’ll look at a tried and tested ETF rotation strategy that is simple and yet effective at getting you in the right market segment at the right time. This strategy is simple to execute and has consistently beat the market over multiple years. While this strategy doesn’t replace your regular trading, it’s a good place to consider for a segment of trading.
Session 4 – Live Trading using Darren’s Favorite Candlestick Strategy and ETF Strategy
Starting from Market Timing, then moving to the Darren’s 3 Favourite Candlestick Strategy and the ETF Rotation Report, we’ll look for candidate stocks. Using the WinWayCharts indicators we’ll look to confirm the best of the best stock and ETF candidates to place trades with stops using a live trading account.
Your Presenters: Ray Foreman UK director WinWayCharts and, Steve Hill, CEO AIQ Systems, and founder WinWayCharts
Master Trading with WinWayCharts Webinar
September 7, 2022
Early bird pricing now in effect save over 20%
ONLY $299 229
includes all handouts in PDF and access to recordings
The importable EDS file based on Markos Katsanos’ article in April 2022 issue of Stocks and Commodities magazine, “Stock Market Seasonality,” can be obtained on request via email to info@TradersEdgeSystems.com. The code is also available below.
Synopsis:
Should you sell in May, or later in the summer, or never? Is October the best reentry month? Which are the best and worst months for the stock market? And are there statistically significant seasonal patterns in the equity markets? Can we improve on a seasonal system using other technical conditions?
Code for the author’s system is set up in the AIQ code file. Figure 9 shows a summary EDS backtest of the system using the SPY ETF from 1/1/2000 to 2/17/2022.
FIGURE 9. This shows the summary EDS backtest of the system using the SPY ETF from 1/1/2000 to 2/17/2022.
!Stock Market Seasonality
!Author: Markos Katsanos, TASC April 2022
!Coded by: Richard Denning, 2/10/2022
C is [close].
C1 is valresult(C,1).
H is [high].
L is [low].
V is [volume].
Avg is (H+L+C)/3.
VIXc is TickerUDF(“VIX”,C).
VIXc1 is valresult(VIXc,1).
VIXllv is lowresult(VIXc,25).
VIXllv1 is valresult(VIXllv,1).
VIXhhv is highresult(VIXc,25).
VIXhhv1 is valresult(VIXhhv,1).
VIXDN is (VIXc1 / VIXhhv1)100. VIXUP is (VIXc1 / VIXllv1)100.
TR is max(max(C1-L,H-C1),H-L).
ATR is expavg(TR,152-1). ATR1 is valresult(ATR,1). ATRllv is highresult(ATR,25). ATRllv1 is valresult(ATRllv,1). ATRhhv is highresult(ATR,25). ATRhhv1 is valresult(ATRhhv,1). ATRDN is (ATR1 / ATRhhv1)100.
ATRUP is (ATR1 / ATRllv1)*100.
!VFI
Period is 130.
Coef is 0.2.
VCoef is 2.5.
inter is ln( Avg ) – ln( valresult( Avg, 1) ).
Vinter is Sqrt(variance(inter, 30 )).
Cutoff is Coef * Vinter * C.
Vave is valresult( simpleavg( V, Period ), 1 ).
Vmax is Vave * Vcoef.
VC is Min( V, Vmax ).
MF is Avg – valresult( Avg, 1 ).
VCP is iff(MF > Cutoff, VC, iff(MF < -Cutoff, -VC, 0 )).
VFI1 is Sum( VCP, Period ) / Vave.
VFI is expavg( VFI1, 3 ).
SELLMONTH is 8.
VIXUPMAX is 60.
CRIT is -20. !VFI SELL
K is 1.5. !ATR/VIX RATIO
VOLCONDITION is (VIXUPCRIT.
BUY if (Month()>=10 OR Month()2*VIXUPMAX. !VOLATILITY EXIT
SELLMF if CRIT > VFI AND valrule(CRIT < VFI,1) AND simpleavg(VFI,10)<valresult(simpleavg(VFI,10),1).
Sell if SELLSEASONAL OR valrule(SELLVOLATILITY,1) OR valrule(SELLMF,1).