How Five Market Timing Signals Captured 4,500 Points While Avoiding Two Major Declines
One of the most common questions we hear from traders is: “Can a systematic approach really identify market turning points in real-time?” The answer is yes—when you have the right tools and a disciplined, rule-based methodology.
Let me show you exactly how AIQ Market Timing navigated a volatile 2.5-month period from October 2025 through January 2026, capturing three significant rallies totaling 4,500 points while protecting capital during two major reversals totaling over 3,000 points of decline.
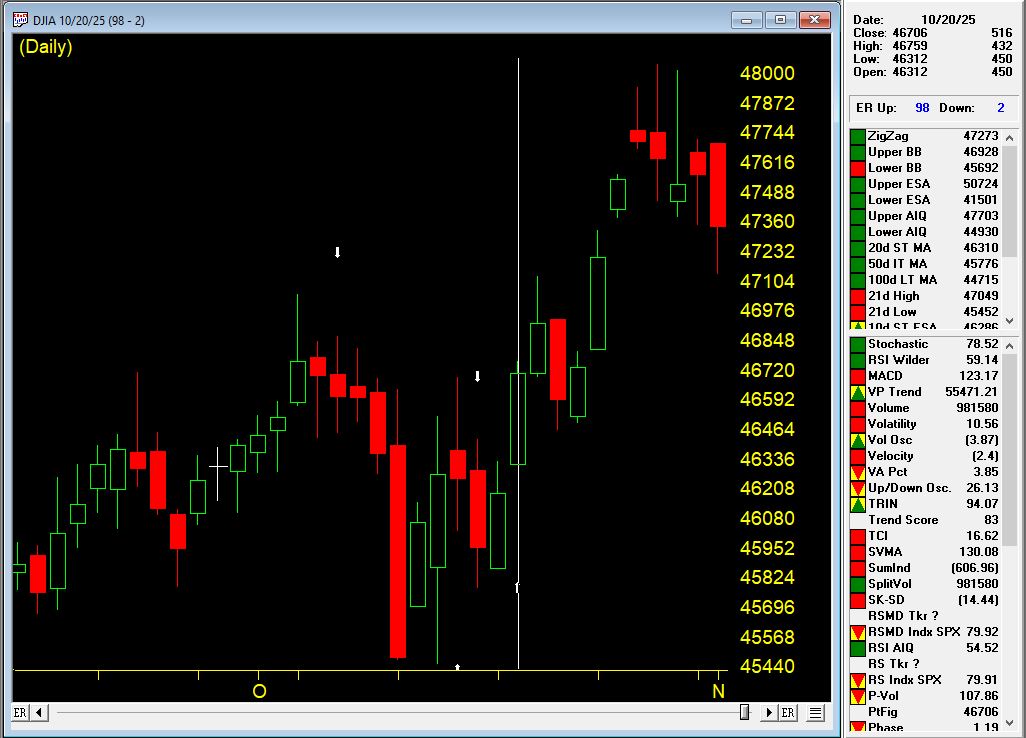
The Setup: Multiple Bullish Confirmations (October 20, 2025)
On October 20th, AIQ Market Timing issued a 98 UP signal at 46,707 on the Dow Jones Industrial Average. But this wasn’t just a single indicator flashing green—it was a confluence of five critical rules firing simultaneously:
Rule #1: Trend Status Confirmation
Trend Status changed to a weak upward trend
This indicated an upward trend was starting that could continue
Classification: Moderate bullish signal
Rule #2: Exponentially Smoothed A/D Line
The smoothed advance/decline line turned positive
Key factor: The UD volume oscillator and A/D oscillator were ALREADY positive
This alignment is viewed as bullish, often preceding upward price movement
Rule #3: Up/Down Volume Oscillator
The UD volume oscillator turned positive
Confirmation: A/D oscillator and smoothed A/D line were already positive
This convergence signaled institutional buying was building
Rule #4: Advance/Decline Oscillator
The A/D oscillator turned positive
Supporting indicators: UD volume and smoothed A/D line already positive
Multiple breadth measures confirming the move
Rule #5: Volume Accumulation Alignment
A/D oscillator turned positive with volume accumulation already positive
In a weak upward market, this signals prices could continue rising
Professional money was accumulating positions
The Result: +1,333 Points in 8 Days
The market moved from 46,707 on October 21st to 48,040 on October 29th—a gain of 1,333 points (+2.85%) in just eight trading days.
This is the power of waiting for multiple confirming indicators rather than jumping on single signals. The system identified strong internal market momentum that wasn’t yet obvious to casual observers.
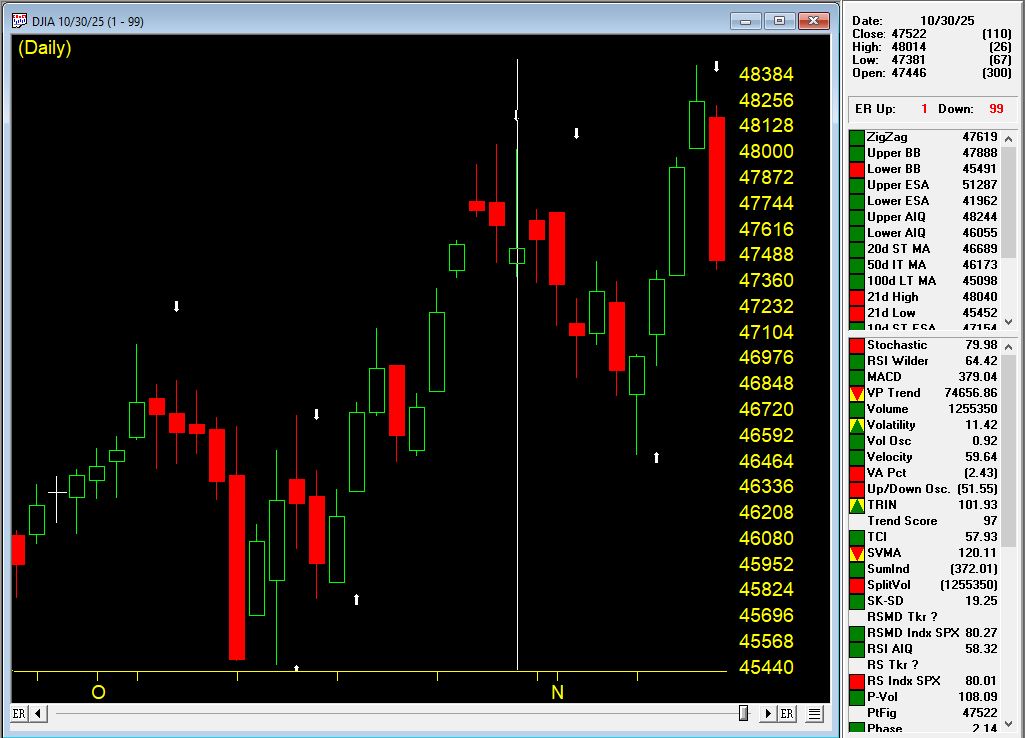
The Top: System Catches the Reversal (October 30, 2025)
Just one day after the market high, on October 30th at 47,659, AIQ Market Timing 98 issued a DOWN signal. The system caught the top within just 11 points of the absolute high (48,040 vs. 47,659).
Two Critical Bearish Rules Fired:
Rule #1: Breadth Deterioration
The exponentially smoothed A/D line turned negative
Warning sign: UD volume oscillator and A/D oscillator were already negative
This indicated institutional distribution was underway
Rule #2: Volume Accumulation Breakdown
Volume accumulation turned negative
The A/D oscillator was already negative
In a downtrending market, this bearish signal often precedes price declines
Initial Decline: -1,164 Points in 7 Days
From the October 31st level of 47,659, the market dropped to 46,495 by November 7th—a decline of 1,164 points (-2.44%) in seven trading days.
Traders following these signals would have been long for the +2.85% rally and either flat or profitably short for the -2.44% decline.
The Confirmation: Second Down Signal (November 4, 2025)
On November 4th, while the market was still declining, AIQ Market Timing 98 issued a second DOWN signal, reinforcing the bearish outlook. This is where systematic trading truly shines—when multiple signals confirm the trend in real-time.
Three Additional Bearish Rules Fired:
Rule #1: Trend Status Reversal
Trend Status changed to a weak downward trend
This confirmed the downward trend was likely to continue
Classification: Moderate bearish signal
Rule #2: Stochastic and Volume Divergence
Volume accumulation percentage was decreasing
The 21-day stochastic moved below the 80% line
In a downtrending market: Strong bearish signal
This combination often precedes significant downward price movement
Rule #3: UD Volume Oscillator Breakdown
The UD volume oscillator turned negative
Critical context: Smoothed A/D line and A/D oscillator were already negative
This confirmed selling pressure was intensifying
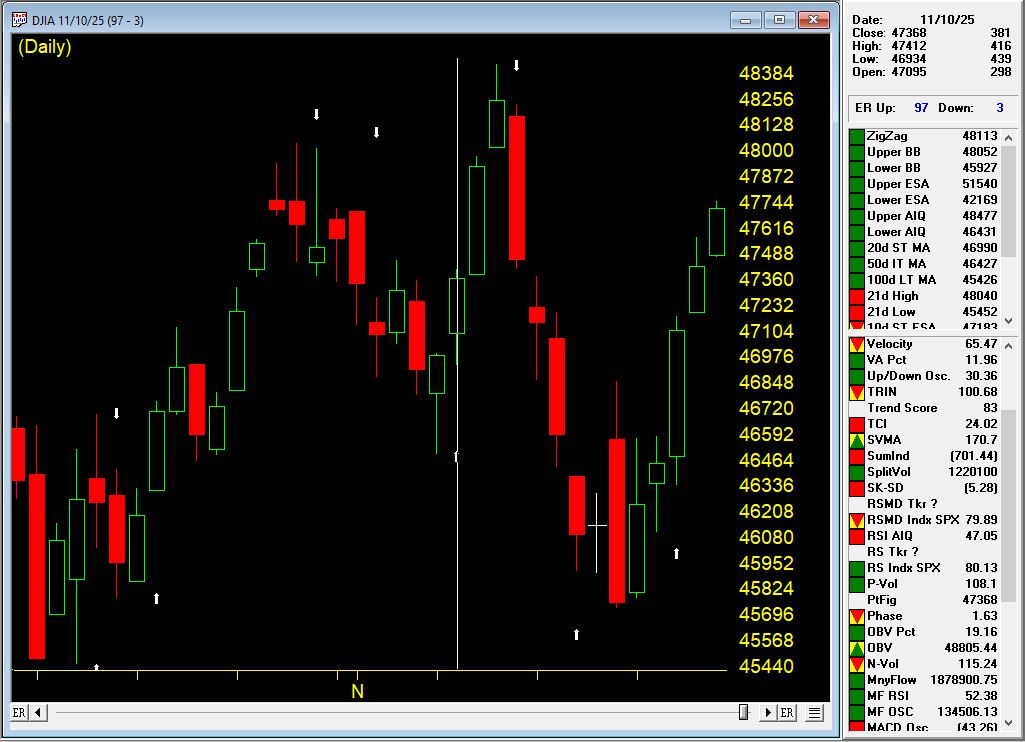
Signal #3: Back to Bullish (November 10, 2025)
On November 10th at 47,368, AIQ Market Timing issued an UP signal (97), indicating the correction had run its course and a new upward move was beginning.
Four Powerful Bullish Rules Fired:
Rule #1: Exponentially Smoothed A/D Line
Turned positive with UD volume oscillator and A/D oscillator already positive
This alignment indicated strong bullish internal momentum building
Rule #2: Advance/Decline Oscillator Confirmation
Turned positive with UD volume oscillator and smoothed A/D line already positive
Multiple breadth measures confirming the new uptrend
Rule #3: Volume Accumulation Alignment
A/D oscillator turned positive with volume accumulation already positive
In a sideways market, this signals prices could begin upward movement
Professional buying was returning
Rule #4: New High/New Low Reversal
The NH/NL indicator reversed to the upside
Classification: Reliable bullish signal
Often followed by upward price movement
In a sideways market, an uptrend could start shortly
The Rally: +1,063 Points in 3 Days
The market surged from 47,384 on November 11th to 48,431 on November 13th—a gain of 1,040 points (+2.22%) in just three trading days.
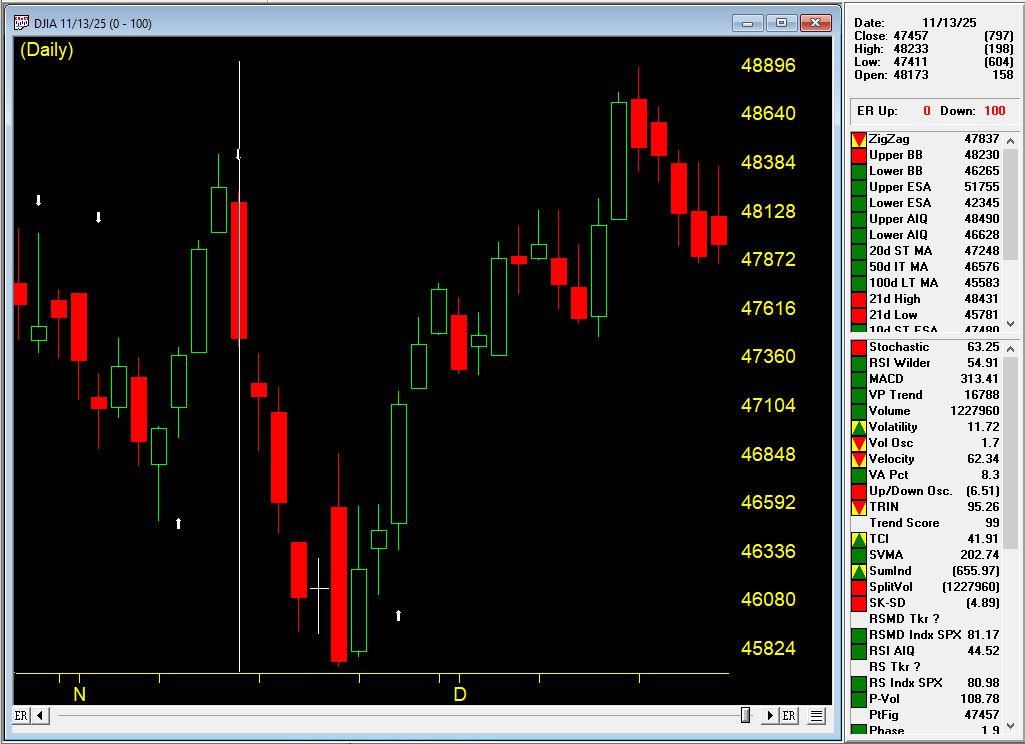
Signal #4: The Top Again (November 13, 2025)
At the market high of 48,233, AIQ Market Timing issued a DOWN signal (100), once again catching the reversal with precision.
Five Bearish Rules Fired:
Rule #1: Stochastic and Price Phase Weakness
21-day stochastic declined below the 80% line
Price phase indicator also decreasing
In the uptrending market: Weak bearish signal indicating possible near-term decline
Rule #2: Smoothed A/D Line Breakdown
Turned negative with UD volume and A/D oscillator already negative
Clear sign of breadth deterioration
Rule #3: UD Volume Oscillator Reversal
Turned negative with smoothed A/D line and A/D oscillator already negative
Institutional selling was intensifying
Rule #4: A/D Oscillator Breakdown
Turned negative with UD volume and smoothed A/D line already negative
All breadth measures aligned bearishly
Rule #5: New High/New Low Reversal
The NH/NL indicator reversed to the downside
Classification: Reliable bearish signal
Often followed by downward price movement
In an uptrending market, a trend reversal could occur
The Decline: -1,500 Points in 7 Days
From November 14th’s open of 47222, the market plunged to 45,728 on November 20th—a drop of nearly 1500 points (3.16%) in five trading days.
This was a significant correction that caught many traders off guard. But AIQ Market Timing identified it precisely at the top.
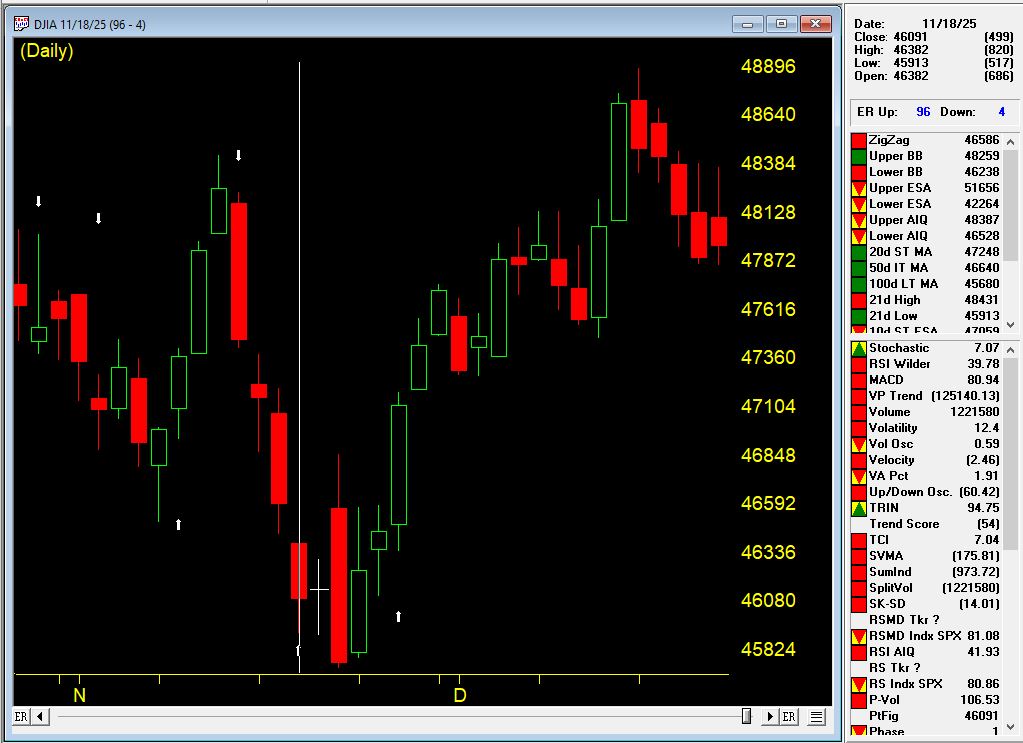
Signal #5: The Current Rally (November 18, 2025 – Present)
On November 18th at 46,091, AIQ Market Timing issued an UP signal (96), catching the bottom of the correction and positioning traders for what would become a powerful sustained rally.
The Rally Continues: over 3000 Points and Counting
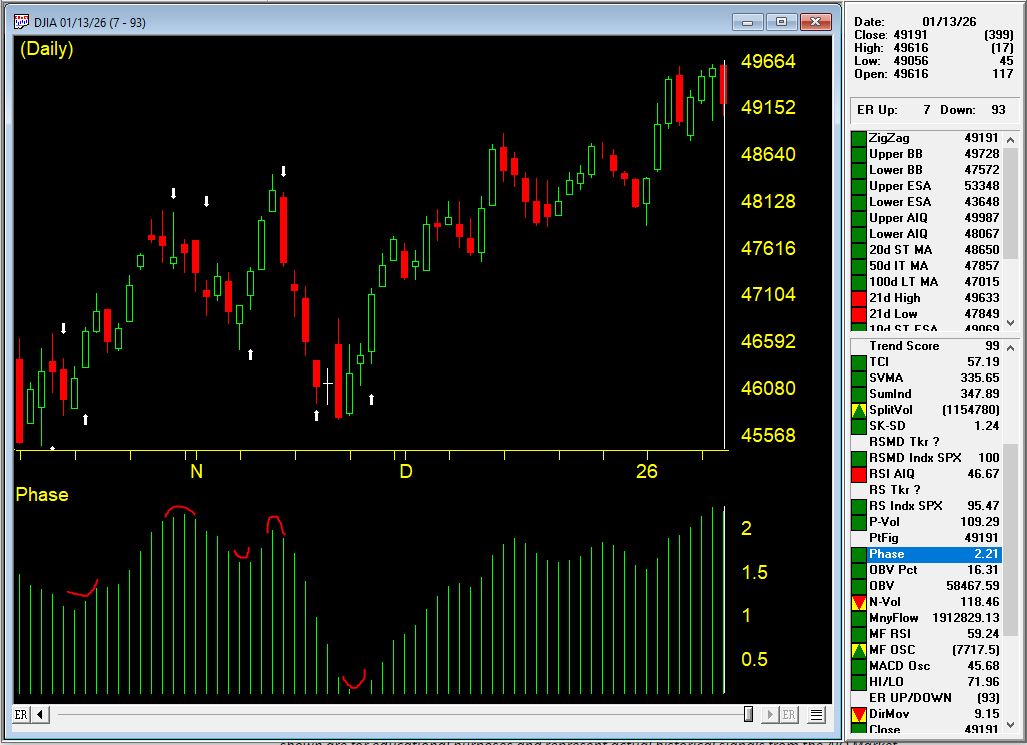
From the November 19th entry at 46,138, the market has surged to 49,616 as of January 13, 2026—a gain of over 3,300 points (+7.0%) that is STILL RUNNING.
This ongoing rally has already lasted 45 days and shows the power of staying with a trend when the system confirms the move.
The Complete Picture: What This Teaches Us
Over a 2.5-month period from October 21, 2025 to January 9, 2026, AIQ Market Timing issued five signals:
The Numbers Are Staggering
Total gains captured: over 5,000 points across three rallies Total declines avoided: over 3,000 points across two corrections Current position: Still long in a rally that has gained 7.0%
Compare this to buy-and-hold over the same period:
Started: 46,707 (Oct 21)
Current: 49,504 (Jan 9)
Buy-and-hold gain: +2,797 points (+5.99%)
This sequence demonstrates several critical principles of successful systematic trading:
1. Confirmation Over Single Indicators
Every up signal had multiple rules firing together—not weak, isolated signals but powerful confluences showing aligned market internals. Signal #1 had five rules, Signal #3 had four rules including the reliable NH/NL indicator.
2. Speed Matters
The system caught reversals with remarkable precision: one day after the October high, right at the November 13th high. Manual observation would have missed these turning points.
3. Internal Strength vs. Price Action
The breadth indicators (A/D measures, volume accumulation, UD volume, NH/NL) detected shifts in market character before they became obvious in price alone.
4. Consistency Across Different Market Conditions
This wasn’t a lucky streak. The system worked in:
Weak upward trends (October)
Weak downward trends (early November)
Sideways markets (mid-November)
Strong sustained uptrends (late November – January)
5. Multiple Cycles Compound Returns
Notice how the system didn’t just catch ONE move—it navigated FIVE distinct market phases. This is where systematic trading truly shines: the ability to stay on the right side of the market through multiple cycles.
6. Reliable Indicators Add Conviction
The New High/New Low indicator appeared in both Signal #3 (bullish reversal) and Signal #4 (bearish reversal), classified as “reliable” both times. When these high-probability signals appear, they deserve attention. Adding in the Phase indicator, confirmation was present for all the signals and is considered a valid confirmation within +/- 3 days of the signal.
7. Both Sides of the Market
This wasn’t just about catching rallies. The system protected capital by identifying when conditions changed, allowing traders to exit longs, stay in cash, or even profit from declines totaling 3,669 points.
Multiply this advantage over weeks, months, and years, and you begin to understand why systematic, rule-based trading provides such a significant edge.
The Bottom Line
AIQ Market Timing isn’t about predictions or gut feelings. It’s about:
Objective rules that fire based on market internals
Multiple confirming indicators that reduce false signals
Real-time alerts that keep you informed as conditions change
Historical validation proving the methodology works across different market environments
Consistent performance across multiple market cycles
Are you ready to trade with this level of systematic precision? $1 trial available
Learn more about AIQ Market Timing 98 and other professional-grade technical analysis tools at AIQ Systems.
Past performance does not guarantee future results. All trading involves risk. The examples shown are for educational purposes and represent act
it’s been a challenging market this year, and making trading decisions has never been easy. Which direction the market is likely to move plays a huge part in stock trading decisions.
The Expert Rating system on the market with its combination of 400 rules on the Dow 30 index and the NYSE internals has always provided us an early indication of direction changes.
No system is infallible, and when the Expert System on the market was created, we noticed that ratings of 95 or higher to the upside or downside (maximum rating is 100 btw) were significant. We also noticed a marked improvement in the accuracy of the ratings if we used a confirmation technique with a momentum indicator.
After much research, we discovered that the Phase Indicator (a version of a MACD histogram) was the most accurate tool to confirm high ratings.
*** Here’s how we use Phase to confirm a high Expert Rating. ***
When a rating of 95 up or 95 down is triggered on the market, we look for the Phase histogram to change direction. The change in direction must be to the direction of the rating. This change does not have to happen on the day of the rating, but it must occur within 2 to 3 days on either side of the rating day.
If the Phase does not change direction, the rating is considered not confirmed.
This short video analysis of the last 4 ratings shows this process in action.
September 7, 2022 – 3pm to 7pm London time, four hour in-depth webinar
covering these in-depth topics, crucial to your successful trading.
Early bird pricing now in effect, see below to book your discounted price and save over 20%
****** Includes PDF handouts and access to the recordings of the event ******
Session 1 – Power tools and features in your WinWayCharts and how to use them
Color Studies, Overlays, Custom Indicators, Seasonality, and Matchmaker. These are important and powerful tools in your WinWayCharts. In this session, we’ll show how to set a Color Study and why, what Overlays are useful for, and more. Learn how these tools will save you time and how they contribute to your trading decisions. Darren’s 3 favourite Bullish/Bearish strategies will be used as the basis for the color study.
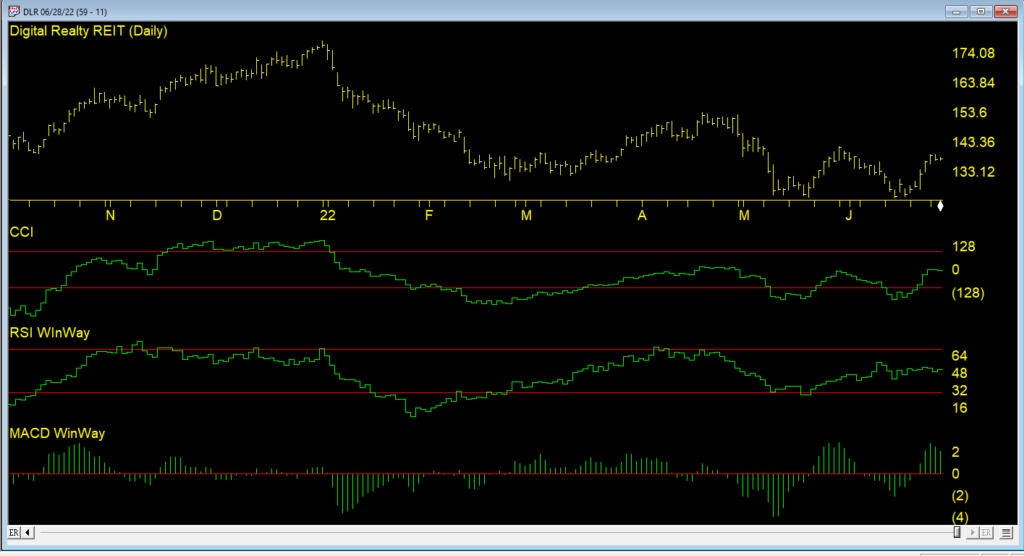
Session 2 – Darren’s Indicators and how to apply them
Some indicators are more reliable than others. In this session, we’ll look at some of the nuances of MACD WinWay, RSI WinWay and the CCI indicators and how they add confidence to our trading decisions. We’ll explore these 3 indicators in-depth with examples of them in action in the stock market.
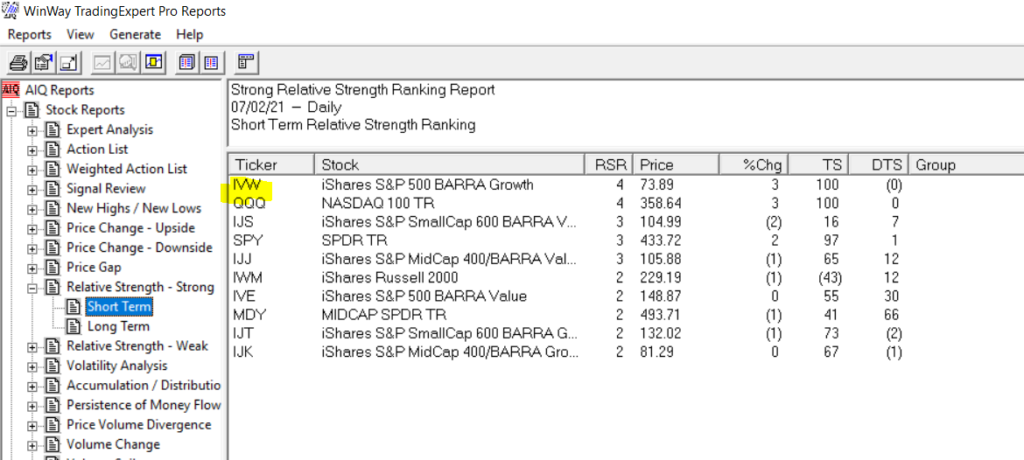
Session 3 – Exchange traded funds rotation strategy so you never have to go short
Using the reports in WinWayCharts we’ll look at a tried and tested ETF rotation strategy that is simple and yet effective at getting you in the right market segment at the right time. This strategy is simple to execute and has consistently beat the market over multiple years. While this strategy doesn’t replace your regular trading, it’s a good place to consider for a segment of trading.
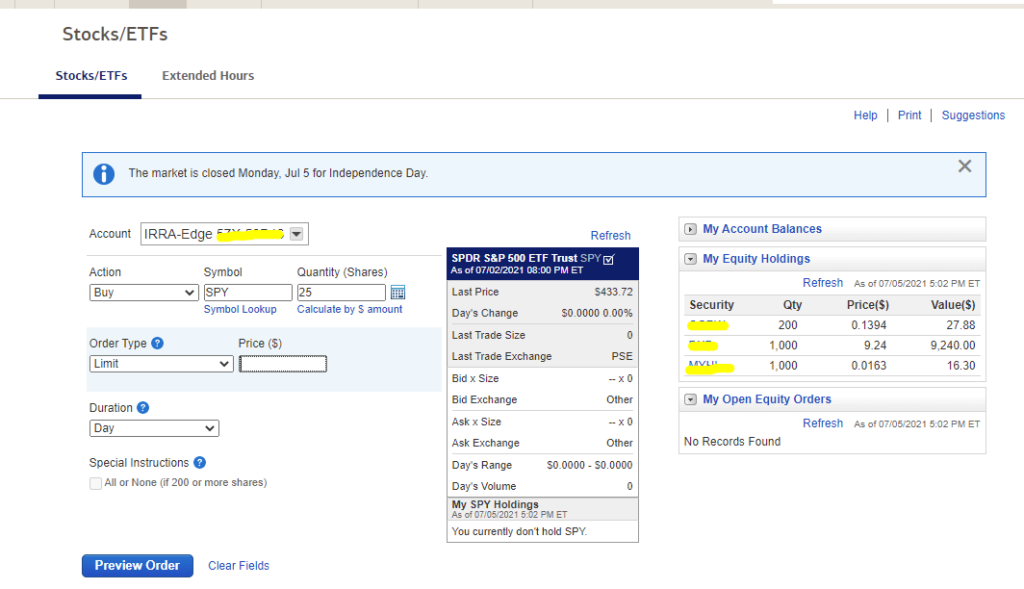
Session 4 – Live Trading using Darren’s Favorite Candlestick Strategy and ETF Strategy
Starting from Market Timing, then moving to the Darren’s 3 Favourite Candlestick Strategy and the ETF Rotation Report, we’ll look for candidate stocks. Using the WinWayCharts indicators we’ll look to confirm the best of the best stock and ETF candidates to place trades with stops using a live trading account.
Your Presenters: Ray Foreman UK director WinWayCharts and, Steve Hill, CEO AIQ Systems, and founder WinWayCharts
Master Trading with WinWayCharts Webinar
September 7, 2022
Early bird pricing now in effect save over 20%
ONLY $299 229
includes all handouts in PDF and access to recordings
Your WinWayCharts includes the AIQ Market Timing AI rating system. In this short video we’ll discuss the last 4 AI ratings on the Dow Jones Industrial average and examine the rules that fired to generate these signals.
AIQ TradingExpert Pro is programmed with the knowledge and insight of respected technical analysts, experts who have developed technical analysis indicators and systems for the last 50 years. The up/down timing signals issued by TradingExpert Pro are based on this knowledge. Since TradingExpert Pro’s timing signals are generated on a scientific basis, free of bias or emotion, you get a disciplined, objective approach to stock market timing.
The timing signals produced by the AIQ expert system are in the form of Expert Ratings. Behind each Expert Rating is a set of rules that combine the sound principles of technical analysis with the experience of market professionals. Since no single technical indicator works all the time, using indicators in combination increases their reliability. For example, a rule is developed that combines the readings of two or more indicators. This
rule is then more reliable than the reading of a single indicator. Within TradingExpert Pro are two knowledge bases, one specifically designed to issue market timing signals and the other designed to issue stock timing signals. Each TradingExpert Pro knowledge base contains approximately 400 rules, but only a few “fire” on any given day.
In the language of expert systems, those rules that are found to be valid on a particular day are described as having “fired”. Rules can fire in opposite directions. When this happens, the bullish and bearish rules fight it out. It’s only when bullish rules dominate that the Expert Rating signal is bullish, or when bearish rules dominate that the Expert Rating signal is bearish.
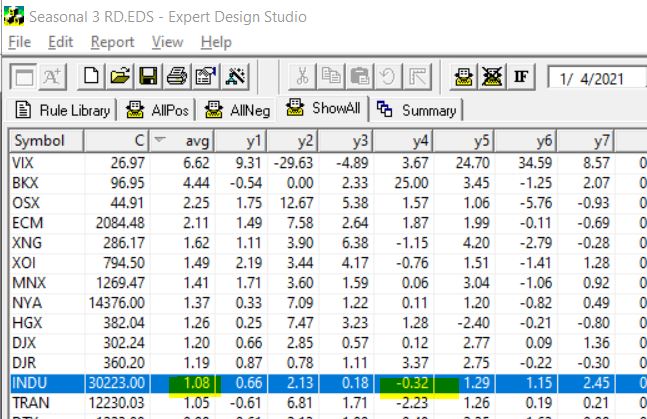
December 20, 2021 we published this seasonality article on the Santa Claus rally https://winwaycharts.com/wordpress/tis-the-season-to-be-cautious/ In a nutshell we looked at the last 5 trading days of the year and the first 2 trading days of the next year. We looked back over the last 7 years to see if the rally holds up.
The Dow clearly did show an average rally of over 1% during those 7 trading days.
So how did things go this Santa Claus rally?
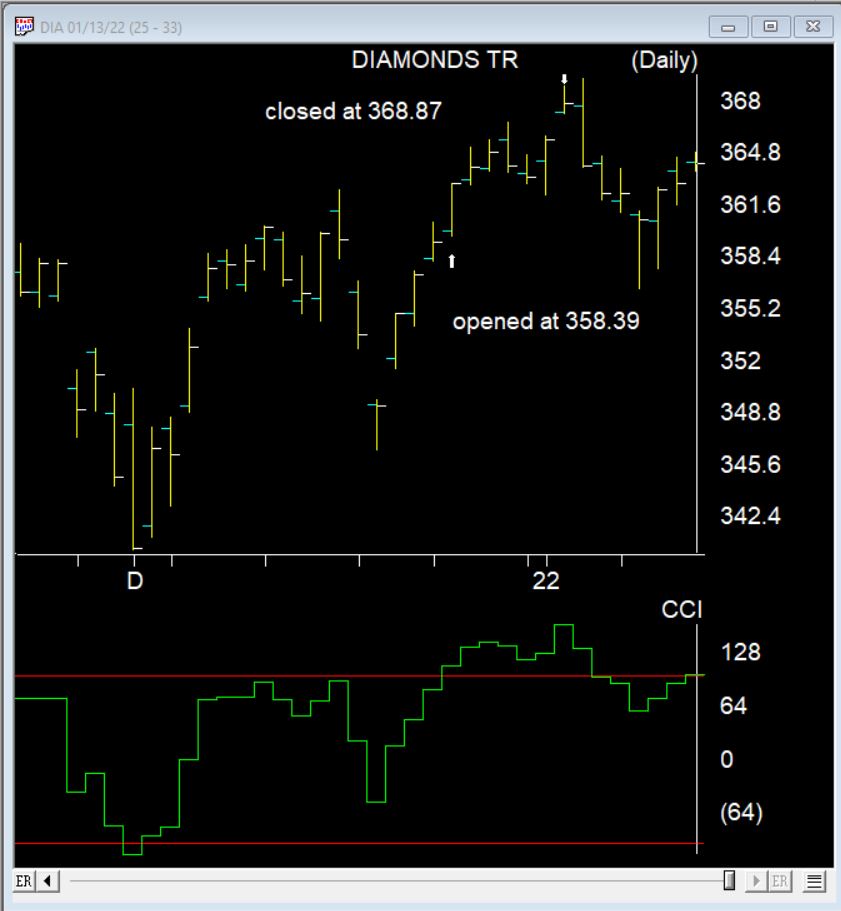
Here’s the DIA the ETF that follows the Dow during the 7 day Santa Claus rally. It made a nice gain of 2.9%. 2 days later things turned down.
In many ways the markets imitate life. For example, the trend is your friend. You may enjoy your friendship with the trend for an indefinite length of time. But the moment you ignore it – or just simply take it for granted that this friendship is permanent, with no additional effort required on your part – that’s when the trouble starts.
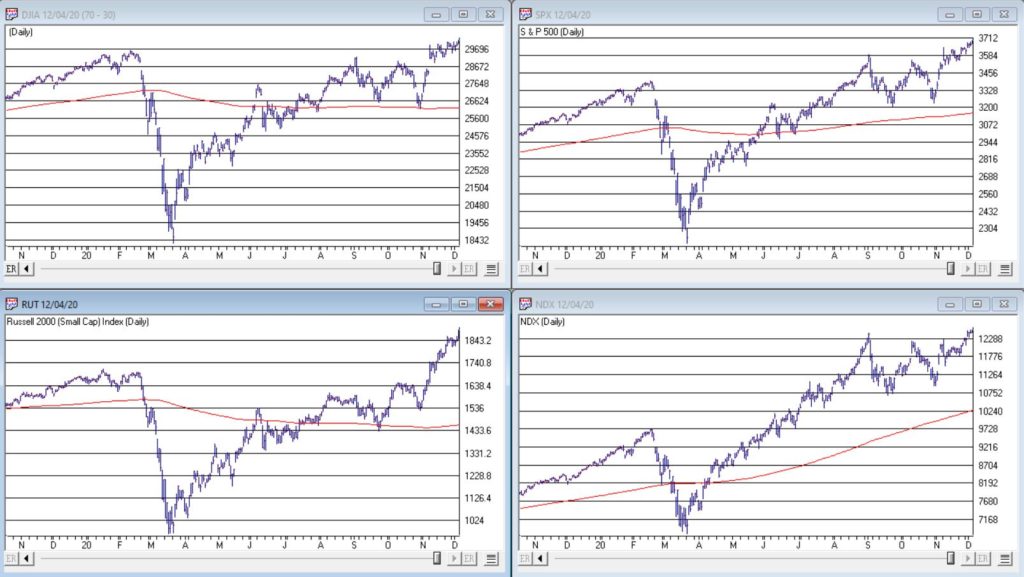
For the stock market right now, the bullish trend is our friend. Figure 1 displays the 4 major indexes all above their respective – and rising – long-term moving averages. This is essentially the definition of a “bull market.”
In addition, a number of indicators that I follow have given bullish signals in the last 1 to 8 months. These often remain bullish for up to a year. So, for the record, with my trusted trend-following, oversold/thrust and seasonal indicators mostly all bullish I really have no choice but to be in the bullish camp.
Not that I am complaining mind you. But like everyone else, I try to keep my eyes open for potential signs of trouble. And of course, there are always some. One of the keys to long-term success in the stock market is determining when is the proper time to actually pay attention to the “scary stuff.” Because scary stuff can be way early or in other cases can turn out to be not that scary at all when you look a little closer.
So, let’s take a closer look at some of the scary stuff.
Valuations
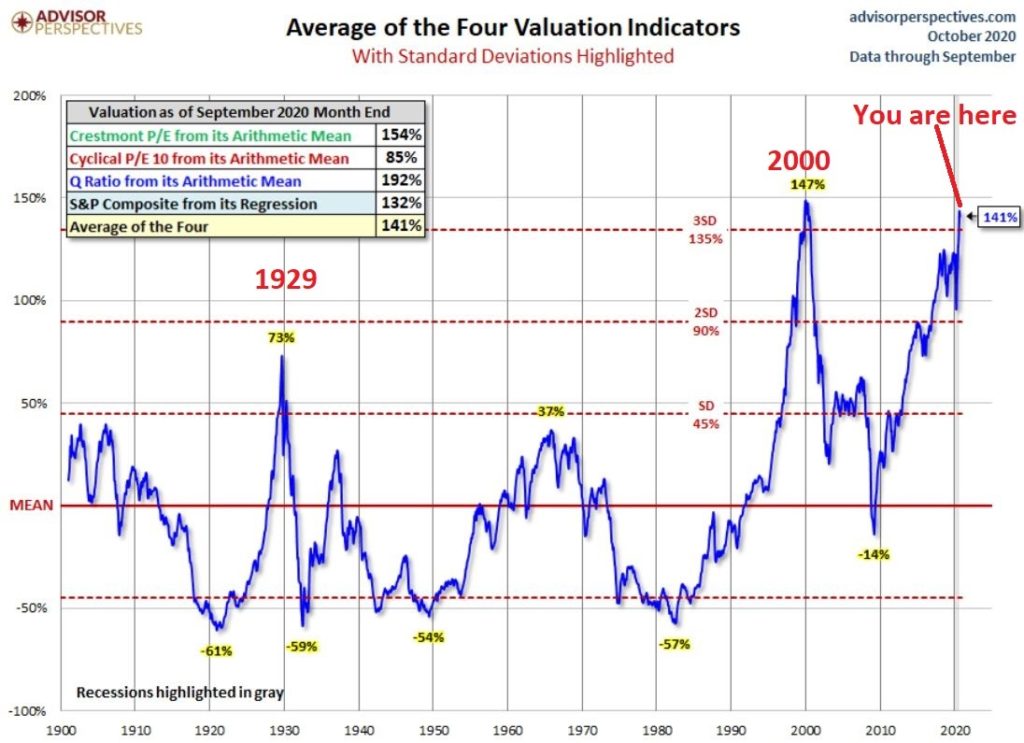
Figure 2 displays an aggregate model of four separate measures of valuation. The intent is to gain some perspective as to whether stocks are overvalued, undervalued or somewhere in between.
Clearly the stock market is “overvalued” if looked at from a historical perspective. The only two higher readings preceded the tops in 1929 (the Dow subsequently lost -89% of its value during the Great Depression) and 2000 (the Nasdaq 100 subsequently lost -83% of its value).
Does this one matter? Absolutely. But here is what you need to know:
*Valuation IS NOT a timing indicator. Since breaking out to a new high in 1995 the stock market has spent most of the past 25 years in “overvalued” territory. During this time the Dow Industrials have increased 700%. So, the proper response at the first sign of overvaluation should NOT be “SELL.”
*However, ultimately valuation DOES matter.
Which leads directly to:
Jay’s Trading Maxim #44: If you are walking down the street and you trip and fall that’s one thing. If you are climbing a mountain and you trip and fall that is something else. And if you are gazing at the stars and don’t even realize that you are climbing a mountain and trip and fall – the only applicable phrase is “Look Out Below”.
So, the proper response is this: instead of walking along and staring at the stars, keep a close eye on the terrain directly in front of you. And watch out for cliffs.
Top 5 companies as a % of S&P 500 Index
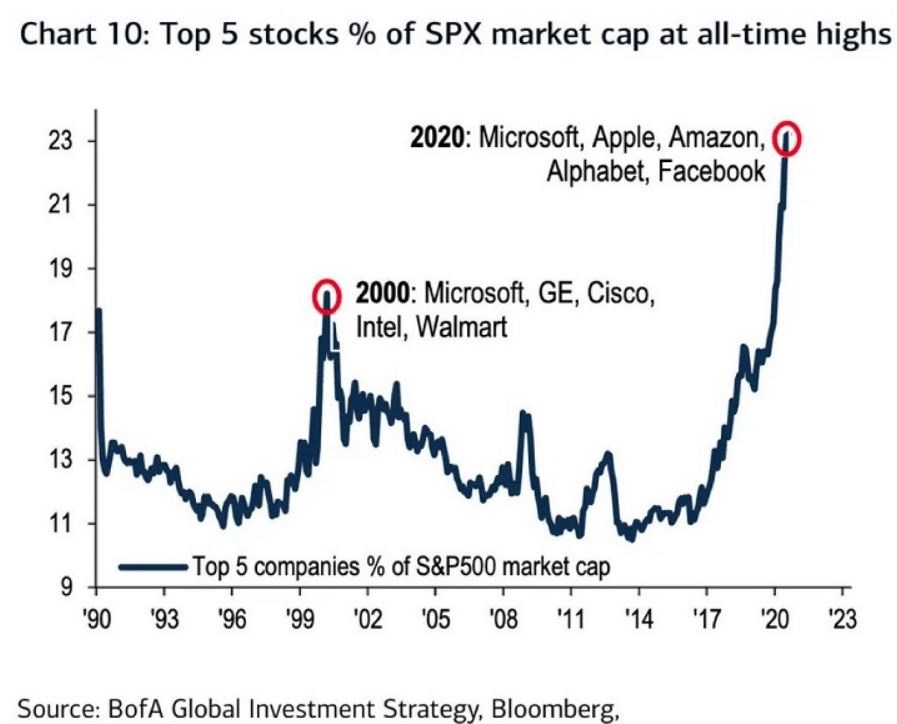
At times through history certain stocks or groups of stocks catch “lightning in a bottle.” And when they do the advances are spectacular, enriching anyone who gets on board – unless they happen to get on board too late. Figure 3 displays the percentage of the S&P 500 Index market capitalization made up by JUST the 5 largest cap companies in the index at any given point in time.
Figure 3 – Top 5 stocks as a % of S&P 500 Index market cap (Courtesy: www.Bloomberg.com)
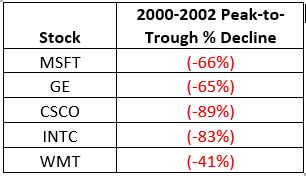
The anecdotal suggestion is pretty obvious. Following the market peak in 2000, the five stocks listed each took a pretty significant whack as shown in Figure 4.
Figure 4 – Top Stocks after the 2000 Peak
Then when we look at how far the line in Figure 3 has soared in 2020 the obvious inference is that the 5 stocks listed for 2020 are due to take a similar hit. And here is where it gets interesting. Are MSFT, AAPL, AMZN, GOOGL and FB due to lose a significant portion of their value in the years directly ahead?
Two thoughts:
*There is no way to know for sure until it happens
*That being said, my own personal option is “yes, of course they are”
But here is where the rubber meets the road: Am I presently playing the bearish side of these stocks? Nope. The trend is still bullish. Conversely, am I keeping a close eye and am I willing to play the bearish side of these stocks? Yup. But not until they – and the overall market – actually starts showing some actual cracks.
One Perspective on AAPL
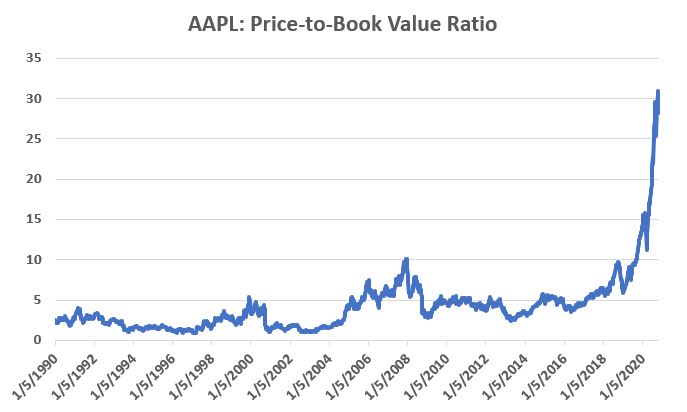
Apple has been a dominant company for many years, since its inception really. Will it continue to be? I certainly would not bet against the ability of the company to innovate and grow its earnings and sales in the years ahead. Still timing – as they say – is everything. For what it is worth, Figure 5 displays the price-to-book value ratio for AAPL since January 1990.
Figure 5 – AAPL price-to-book value ratio (Data courtesy of Sentimentrader.com)
Anything jump out at you?
Now one can argue pretty compellingly that price-to-book value is not the way to value a leading technology company. And I probably agree – to a point. But I can’t help but look at Figure 5 and wonder if that point has possibly been exceeded.
Summary
Nothing in this piece is meant to make you “bearish” or feel compelled to sell stocks. For the record, I am still in the bullish camp. But while this information DOES NOT constitute a “call to action”, IT DOES constitute a “call to pay close attention.”
Bottom line: enjoy the bull market but DO NOT fall in love with it.
Jay Kaeppel
Disclaimer: The information, opinions and ideas expressed herein are for informational and educational purposes only and are based on research conducted and presented solely by the author. The information presented represents the views of the author only and does not constitute a complete description of any investment service. In addition, nothing presented herein should be construed as investment advice, as an advertisement or offering of investment advisory services, or as an offer to sell or a solicitation to buy any security. The data presented herein were obtained from various third-party sources. While the data is believed to be reliable, no representation is made as to, and no responsibility, warranty or liability is accepted for the accuracy or completeness of such information. International investments are subject to additional risks such as currency fluctuations, political instability and the potential for illiquid markets. Past performance is no guarantee of future results. There is risk of loss in all trading. Back tested performance does not represent actual performance and should not be interpreted as an indication of such performance. Also, back tested performance results have certain inherent limitations and differs from actual performance because it is achieved with the benefit of hindsight.