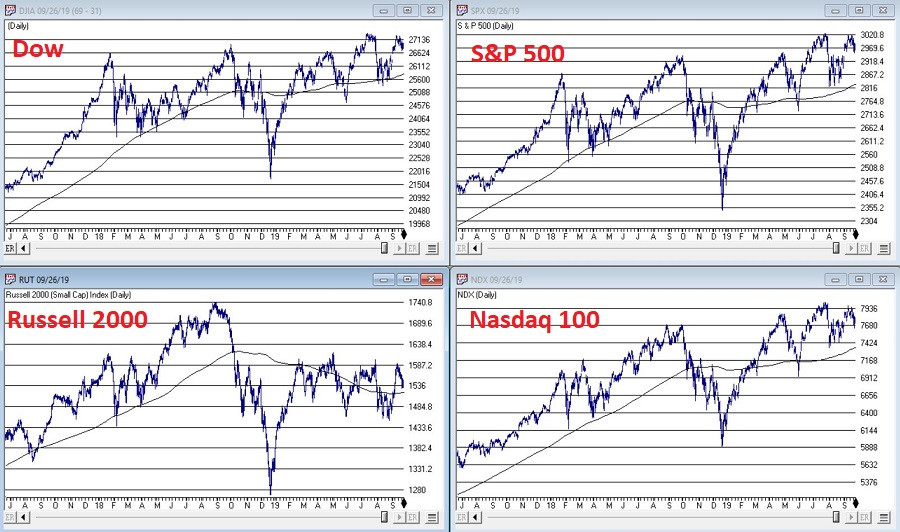
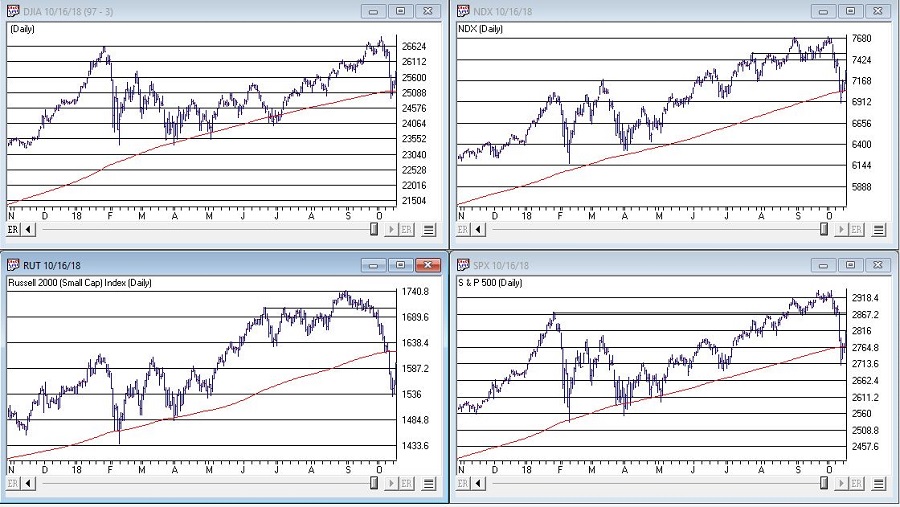
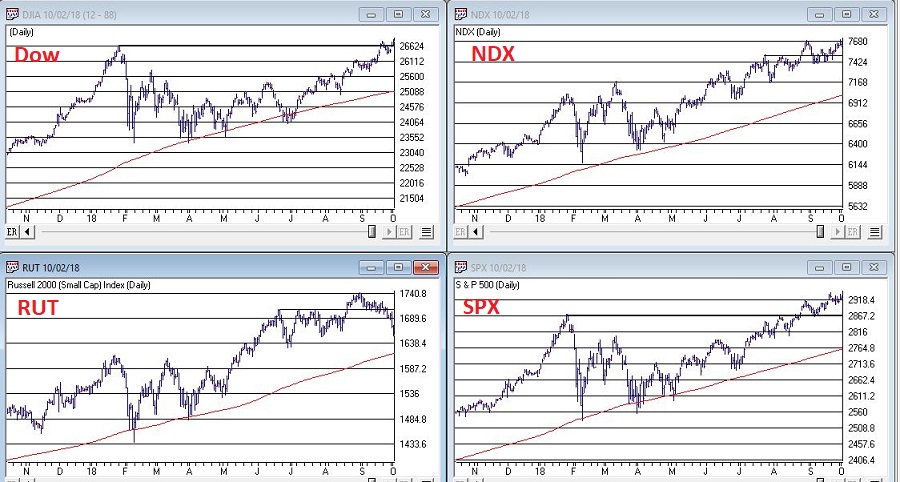
As usual, you can pretty much see whatever you want to see in today’s stock market. Consider the major indexes in Figure 1, displayed along with their respective 200-day moving averages.
If you “want to” be bullish, you can focus on the fact that all 4 of these major indexes are presently above their respective 200-day moving averages. This essentially defines an “uptrend”; hence you can make a bullish argument.
If you want to be “bearish”, you can focus on the “choppy” nature of the market’s performance and the fact that very little headway has been made since the highs in early 2018. This “looks like” a classic “topping pattern” (i.e., a lot of “churning”), hence you can make a bearish argument.
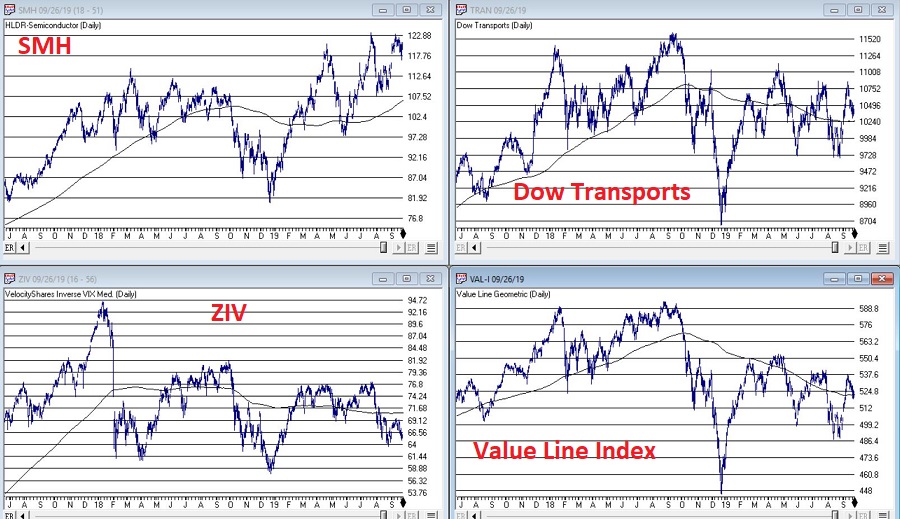
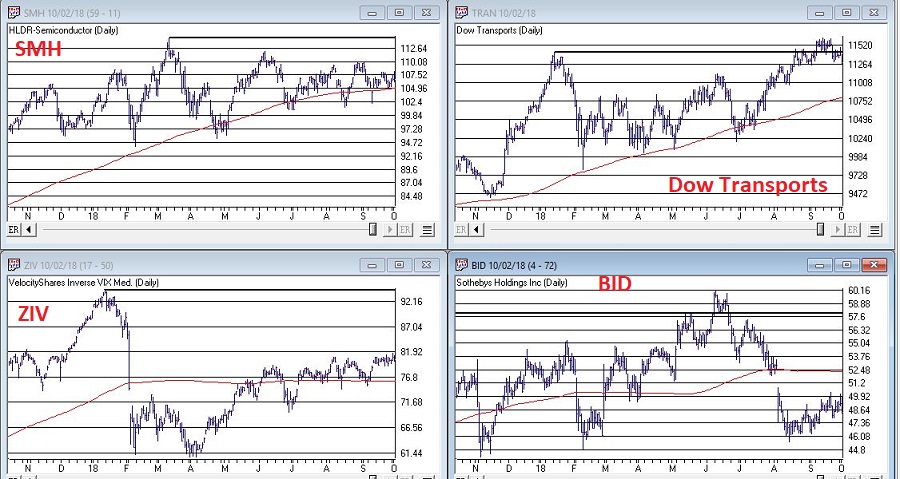
To add more intrigue, consider the 4 “market bellwethers” displayed in Figure 2.
(NOTE: Previously I had Sotheby’s Holdings – ticker BID – as one my bellwethers. As they are being bought out, I have replaced it with the Value Line Arithmetic Index, which has a history of topping and bottoming prior to the major indexes)
The action here is much more mixed and muddled.
*SMH – for any “early warning” sign keep a close eye on the semiconductors. If they breakout to a new high they could lead the overall market higher. If they breakdown from a double top the market will likely be spooked.
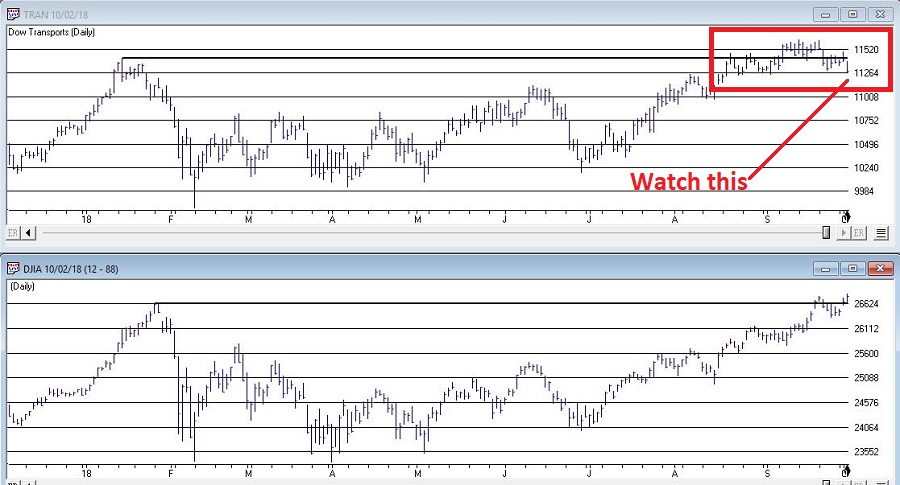
*TRAN – The Dow Transports topped out over a year ago and have been flopping around aimlessly in a narrowing range. Not exactly a bullish sign, but deemed OK as long as price holds above the 200-day moving average.
*ZIV – Inverse VIX is presently below it’s 200-day moving average, so this one qualifies as “bearish” at the moment.
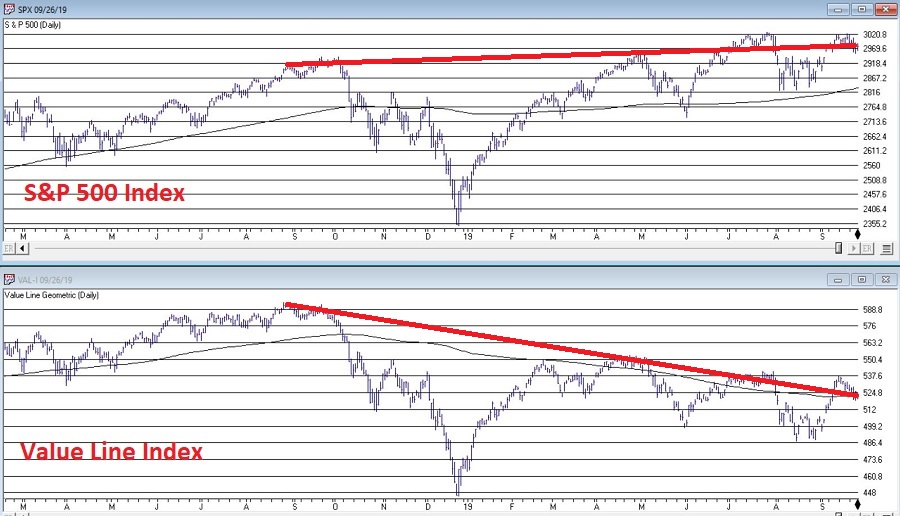
*VAL-I – The Value Line Index is comprised of 1,675 stocks and gives each stock equal weight, so is a good measure of the “overall” market. It presently sits right at its 200-day moving average, however – as you can see in Figure 3 – it is presently telling a different story than the S&P 500 Index.
Figure 3 – S&P 500 trending slightly higher, Value Line unweighted index trending lower (Courtesy WinWayCharts.com)
The Bottom Line
OK, now here is where a skilled market analyst would launch into an argument regarding which side will actually “win”, accompanied by roughly 5 to 50 “compelling charts” that “clearly show” why the analysts’ said opinion was sure to work out correctly. Alas, there is no one here like that.
If the question is, “will the stock market break out to the upside and run to sharply higher new highs or will it break down without breaking out to new highs?”, I sadly must default to my standard answer of, “It beats me.”
Here is what I can tell you though. Instead of relying on “somebody’s opinion or prediction” a much better bet is to formulate and follow an investment plan that spells out:
*What you will (and will not) invest in?
*How much capital you will allocate to each position?
*How much risk you are willing to take with each position?
*What will cause you to exit with a profit?
*What will cause you to exit with a loss?
*Will you have some overarching “trigger” to cause you to reduce overall exposure?
*And so on and so forth
If you have specific answers for the questions above (you DO have specific answers, don’t you?) then the correct thing to do is to go ahead and follow your plan and ignore the myriad prognostications that attempt to sway you one way or the other.
Jay Kaeppel
Disclaimer: The data presented herein were obtained from various third-party sources. While I believe the data to be reliable, no representation is made as to, and no responsibility, warranty or liability is accepted for the accuracy or completeness of such information. The information, opinions and ideas expressed herein are for informational and educational purposes only and do not constitute and should not be construed as investment advice, an advertisement or offering of investment advisory services, or an offer to sell or a solicitation to buy any security.
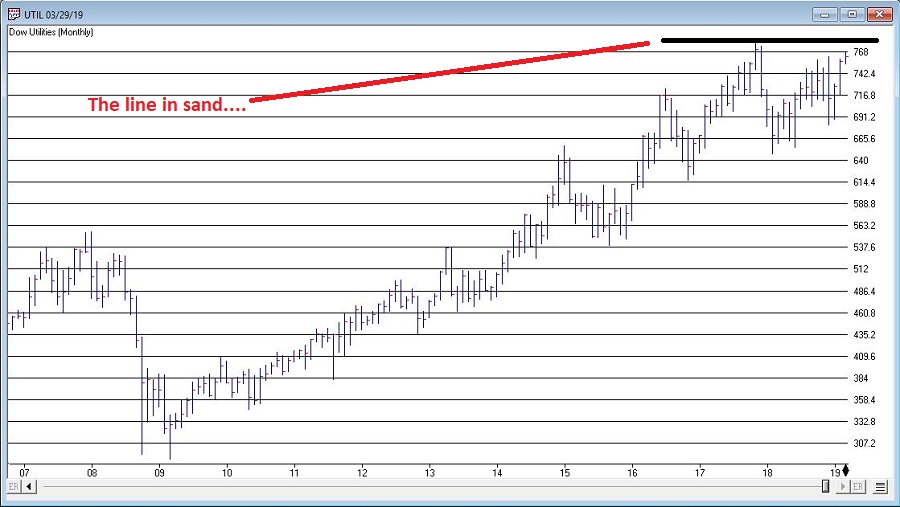
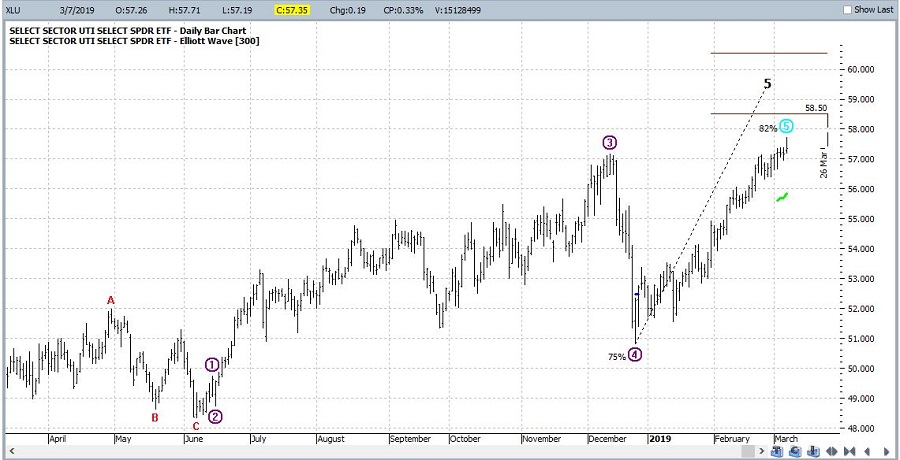
A lot of eyes are firmly fixed on Utilities at the moment. And for good reason. As you can see in Figure 1, the Dow Jones Utilities Average is presently facing a key resistance level. If it breaks out above the likelihood of a good seasonal rally (more in a moment) increases significantly.
Figure 1 – Utilities and resistance (Courtesy WinWayCharts TradingExpert)
One concern may be the fact that a 5-wave Elliott Wave advance appears to possibly have about run its course (according to the algorithmically drawn wave count from ProfitSource by HUBB which I use). See Figure 2.
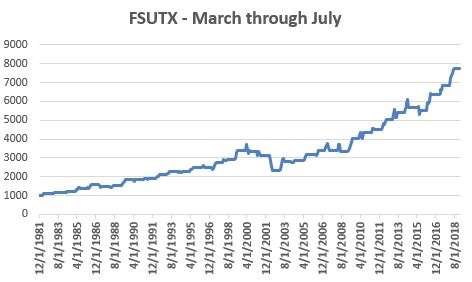
For what it is worth, the March through July timeframe is “typically” favorable for utilities. Figure 3 displays the growth of $1,000 invested in the Fidelity Select Sector Utilities fund (ticker FSUTX) ONLY during the months of March through July each year starting in 1982.
Figure 3 – Growth of $1,000 invested in ticker FSUTX Mar-Jul every year (1982-2018)
For the record:
*# times UP = 29 (78%)
*# times DOWN = 8 (22%)
*Average UP = +9.3%
*Average DOWN = (-5.8%)
*Largest UP = +21.1% (1989)
*Largest DOWN = (-25.8%) (2002)
*Solid performance but obviously by no means nowhere close to “a sure thing”.
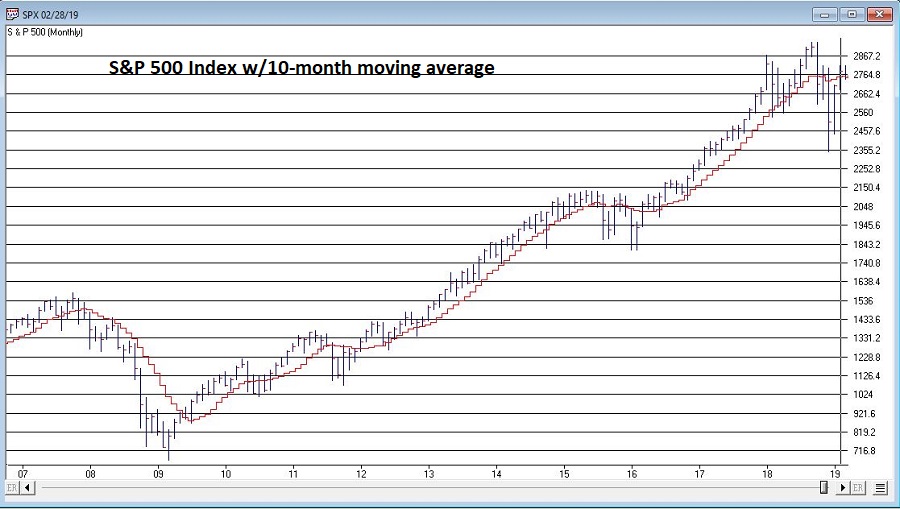
*It should be noted that several of the “Down” years occurred when the S&P 500 was already in a pretty clearly established downtrend (2001, 2002 and 2008), i.e., below its 10-month moving average. See Figure 4.
Figure 4 – S&P 500 Index w/10-month moving average (Courtesy WinWayCharts TradingExpert)
Summary
Utilities are flirting with new all-time highs and March through July is a “seasonally bullish” period for utilities. Does that mean “happy days are here again, and we should all be piling into utilities? Yeah, isn’t that always the thing about the markets? There is rarely a 100% clear indication for anything.
As always, my “prediction” about what will happen next in utilities is irrelevant and I am NOT pounding the table urging you to pile in. But I can tell you what I am watching closely at the moment:
*The S&P 500 Index is flirting right around its 10-month moving average (roughly 2,752 on the S&P 500 Index). If it starts to break down from there then perhaps 2019 may not pan out so well for utilities.
*The Dow Jones Utility Average is facing a serious test of resistance and may run out of steam (according to Elliott Wave).
*But a breakout to the upside could well clear the decks for utilities to be a market leader for the next several months
Focus people, focus.
Jay Kaeppel
Disclaimer: The data presented herein were obtained from various third-party sources. While I believe the data to be reliable, no representation is made as to, and no responsibility, warranty or liability is accepted for the accuracy or completeness of such information. The information, opinions and ideas expressed herein are for informational and educational purposes only and do not constitute and should not be construed as investment advice, an advertisement or offering of investment advisory services, or an offer to sell or a solicitation to buy any security.
The AI in TradingExpert Pro is programmed with the knowledge and insight of many stock market professionals, and is capable of making market recommendations based on this knowledge and insight; recommendations are made on a scientific basis free of bias, emotion, or hidden motives.
The AI or expert systems are programmed with rules that combine sound principles of technical analysis with the knowledge and experience of market professionals. Technical analysis, as used by AIQ, is based on the logic that price is the result of supply and demand. An AIQ timing signal, therefore, reflects all available knowledge and opinions such as news of the day, earnings, product reports, and company forecasts.
Technical analysis recognizes price and volume movement as the voice of the market itself and hence the only data necessary to determine what the market is likely to do next.
The AIQ Expert System
As an expert system, TradingExpert Pro is comprised of two knowledge bases – one for market timing and a second for stock selection – and an inference engine. Knowledge, in the form of rules, is stored in the knowledge bases. The inference engine is the thinking component of an expert system.
Each of the two knowledge bases within TradingExpert Pro has its own unique rules. The rules operate on facts which are values of the technical indicators. The indicators are computed from daily price, volume, and breadth data.
The rules employed in ATQ TradingExpert Pro are derived from the knowledge of many experts of market action and market timing. The reliability of these rules is maximized by combining them into a higher level of Expert Rules. Market analysts have found that no single rule or indicator works all the time. In AIQ, the Expert Rules and technical indicators work together to generate upside and downside signals.
Different knowledge bases for different market cycles
Continuing research at AIQ has shown that a single knowledge base can be improved if it is split into several knowledge bases, one for each phase of the market cycle. This advancement has been incorporated in the market timing knowledge base. The crest, trough, up slope, and down slope are each addressed by a specific set of rules specialized and weighted for that specific phase of the market cycle.
Each market day, then, the system determines the strength and direction of the phase, or trend. If there is no trend, it is first determined if the cycle is at a crest prior to a downtrend, or in a trough before the next uptrend. A more specialized knowledge base is used for each of these conditions, increasing the overall market timing effectiveness.
The inference engine
The knowledge base fuels the second part of the AIQ expert system, the inference engine. The inference engine is the thinking component of an expert system, and mimics the way humans think.
To understand how the AIQ inference engine works, picture a decision tree. The procedure starts from the tree’s trunk, where the major rules are located. Each rule is represented as a node, or fork, where the tree splits into three branches-representing a yes, a no, or a maybe. If the expert system determines that the premise of a rule is true, then the rule is considered to have fired, giving one of those three answers.
As each rule is evaluated, the process moves on to the next node and subsequent branches and continues to move on through the tree. Each rule node has an assigned value. That value is added to a node total that is accumulated as the inference engine passes through the tree. When all the rules have been evaluated, the resulting node total is normalized and becomes an AIQ Expert Rating.
Finally
The Expert Ratings are based on a scale of 0 to l00. The higher the Expert Rating, the stronger the signal. An Expert Rating of 95 or higher is considered a strong signal, meaning that there is a strong possibility that the price trend is about to change direction.
Confirmation of Expert Ratings
Research has shown that a change in direction of the Phase indicator (changing up for up ER, changing down for down ER) at or close to the high Expert Rating date provides a higher degree of confidence in the rating. Phase is not part of the Expert System.
So let us examine the last 7 weeks market action.
2-98 down signal 9/18/2018, 9/18/18 and 9/20/18 all with these primary riles firing confirmed by phase
Intraday high prices of the market have increased to a 21 day high. Never the less, the advance/decline oscillator is negative. This unusual event is read as a very strong bearish signal that is often followed by an downward price movement.
Closing prices on the market have increased to a 21 day high but market breadth as measured by advances and declines is declining. This non-confirmation in a trading market is a weak bearish signal indicating a possible downward price movement.
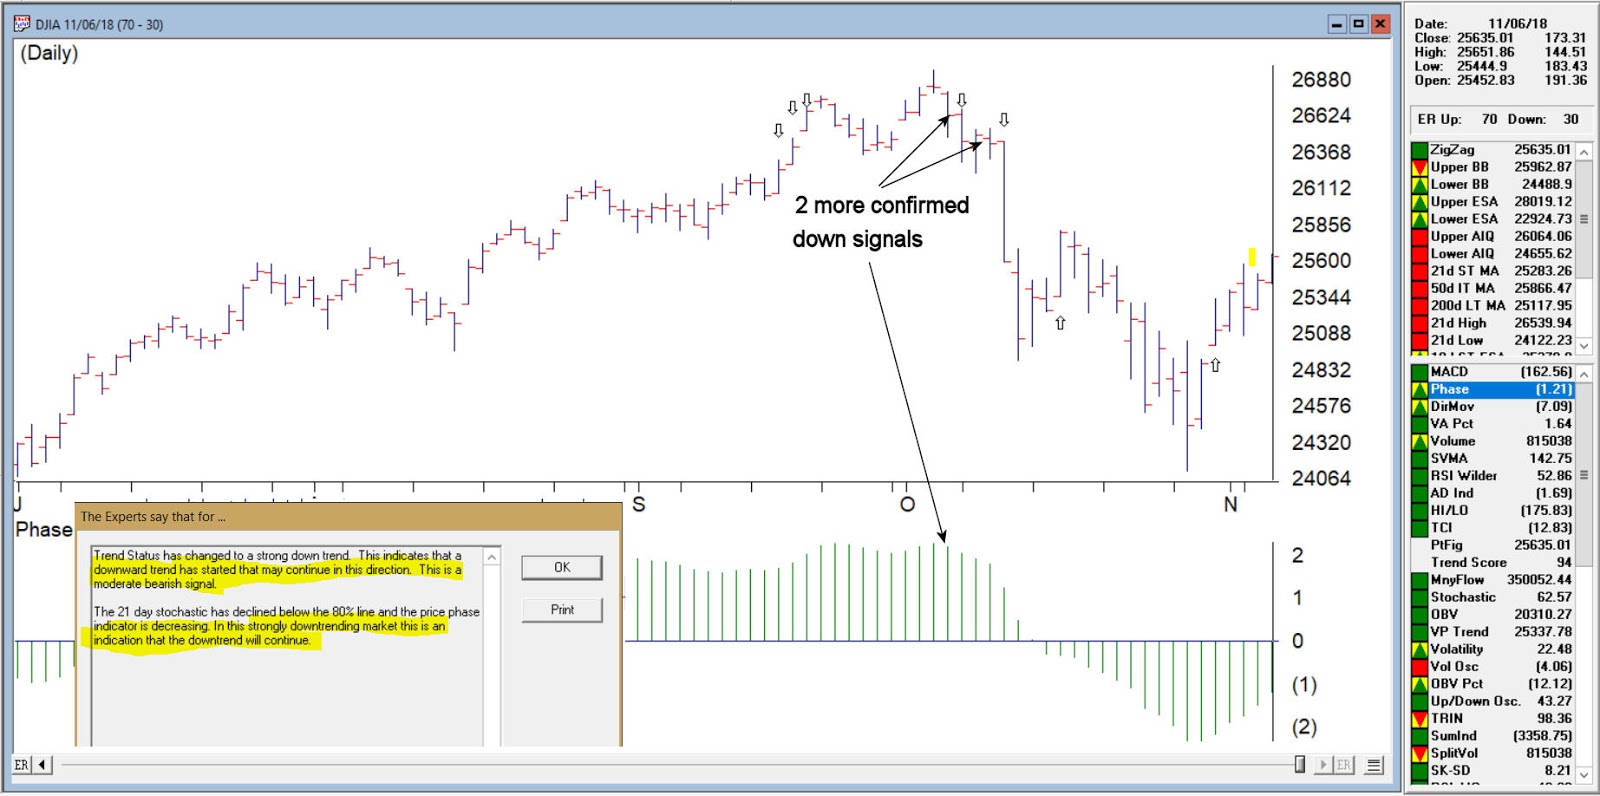
DJIA with the 3 successive down signals
Confirmed down signal 4-96 on 10/05/18 these primary rules fires
Trend Status has changed to a strong down trend. This indicates that a downward trend has started that may continue in this direction. This is a moderate bearish signal.
The 21 day stochastic has declined below the 80% line and the price phase indicator is decreasing. In this strongly downtrending market this is an indication that the downtrend will continue.
Confirmed down signal 5-95 on 10/18/2018 these primary rules fires
The market closing average has dropped below the 21 day exponentially smoothed average price. At the same time, accumulation is decreasing. In this down trending market, this is taken as a very bearish signal that could be followed by further decreases in price.
The price phase indicator is positive but volume distribution has started to advance. This is a nonconformation that, regardless of the type of market, is a bearish signal which usually results in an downward movement of the market.
DJIA with 2 more down signals confirmed by phase
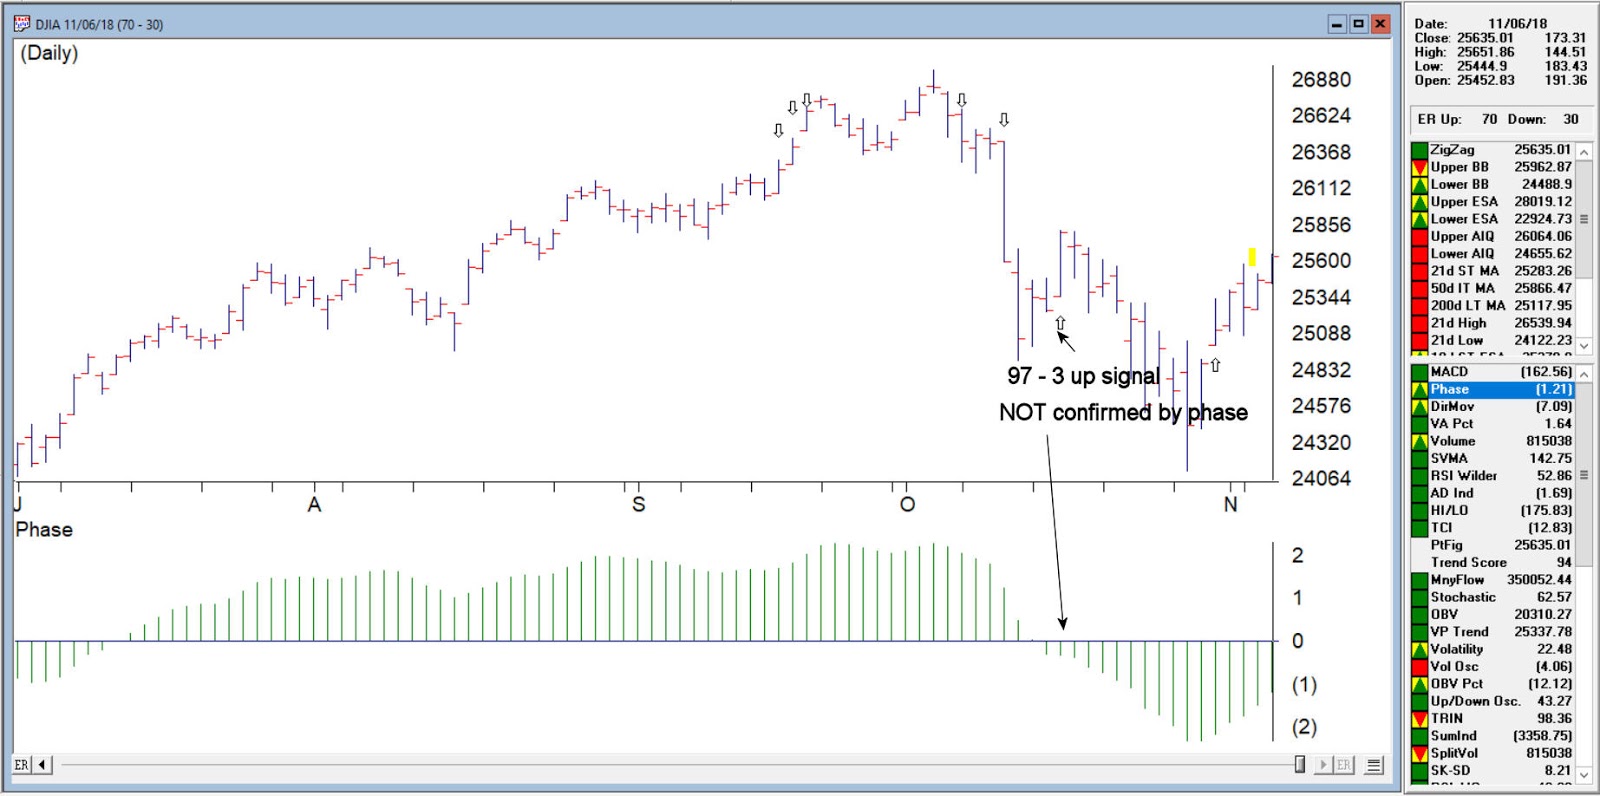
Unconfirmed up signal on 10/16/18 – phase did not change direction
Volume accumulation percentage is increasing and the 21 day stochastic has moved above the 20% line. In this downtrending market, this is taken as a strong bullish signal that could be followed by an upward price movement.
The price phase indicator is negative but volume accumulation has started to advance. This is a non-conformation that, regardless of the type of market, is a bullish signal which usually results in an upward movement of the market.
The new high/new low indicator has reversed to the upside. This is a reliable bullish signal that is often followed by an upward movement in prices. In this weak downtrending market an uptrend could start shortly.
DJIA on 10/16/18 97-3 up no phase confirmation
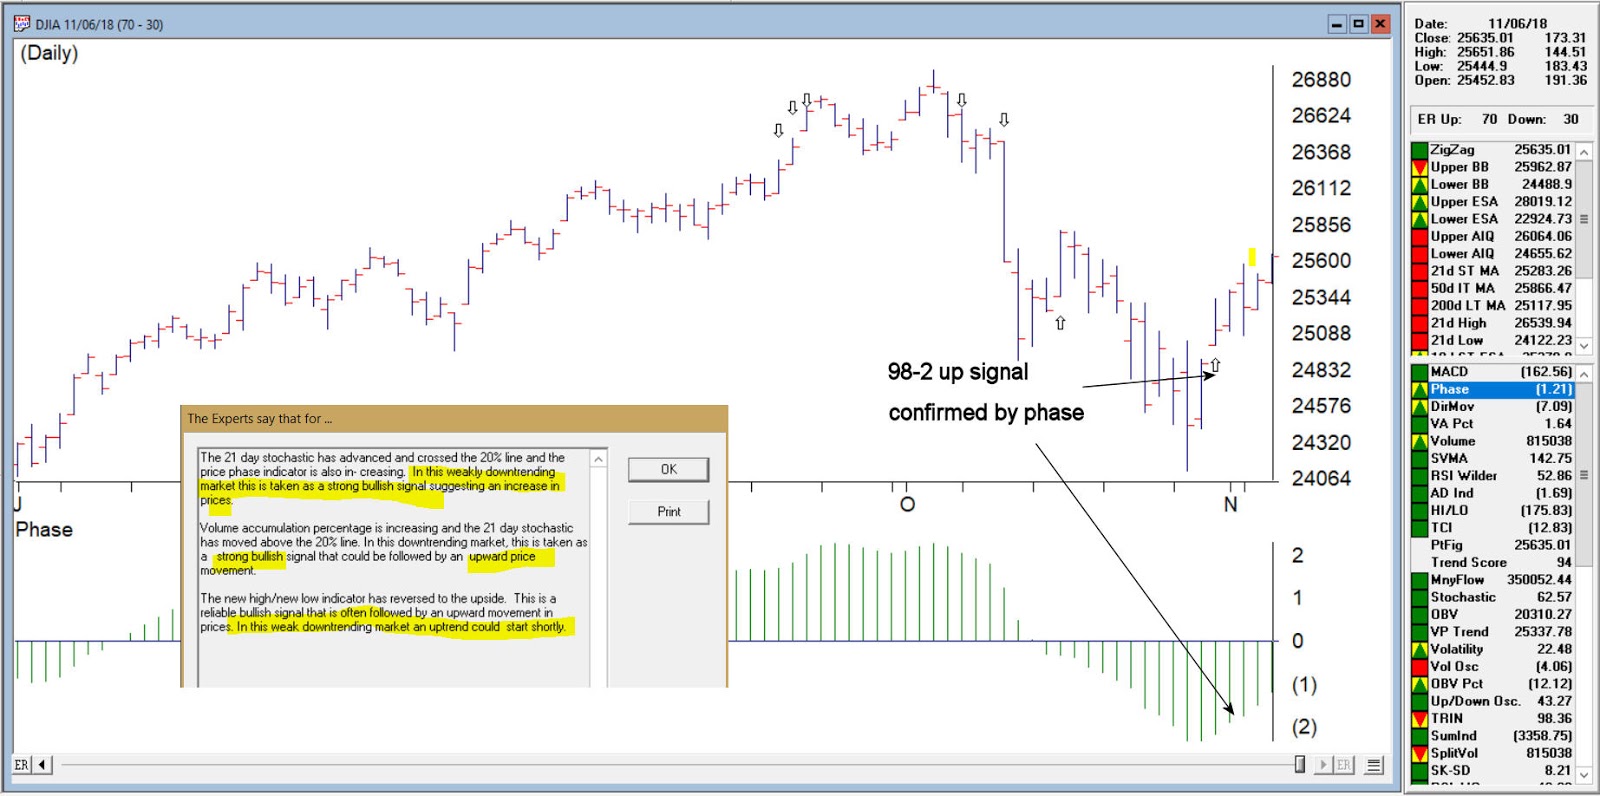
Confirmed up signal 10/31/18 98-2
The 21 day stochastic has advanced and crossed the 20% line and the price phase indicator is also in- creasing. In this weakly downtrending market this is taken as a strong bullish signal suggesting an increase in prices.
Volume accumulation percentage is increasing and the 21 day stochastic has moved above the 20% line. In this downtrending market, this is taken as a strong bullish signal that could be followed by an upward price movement.
The new high/new low indicator has reversed to the upside. This is a reliable bullish signal that is often followed by an upward movement in prices. In this weak downtrending market an uptrend could start shortly.
DJIA on 10/31/18 with confirmed up signal 98-2
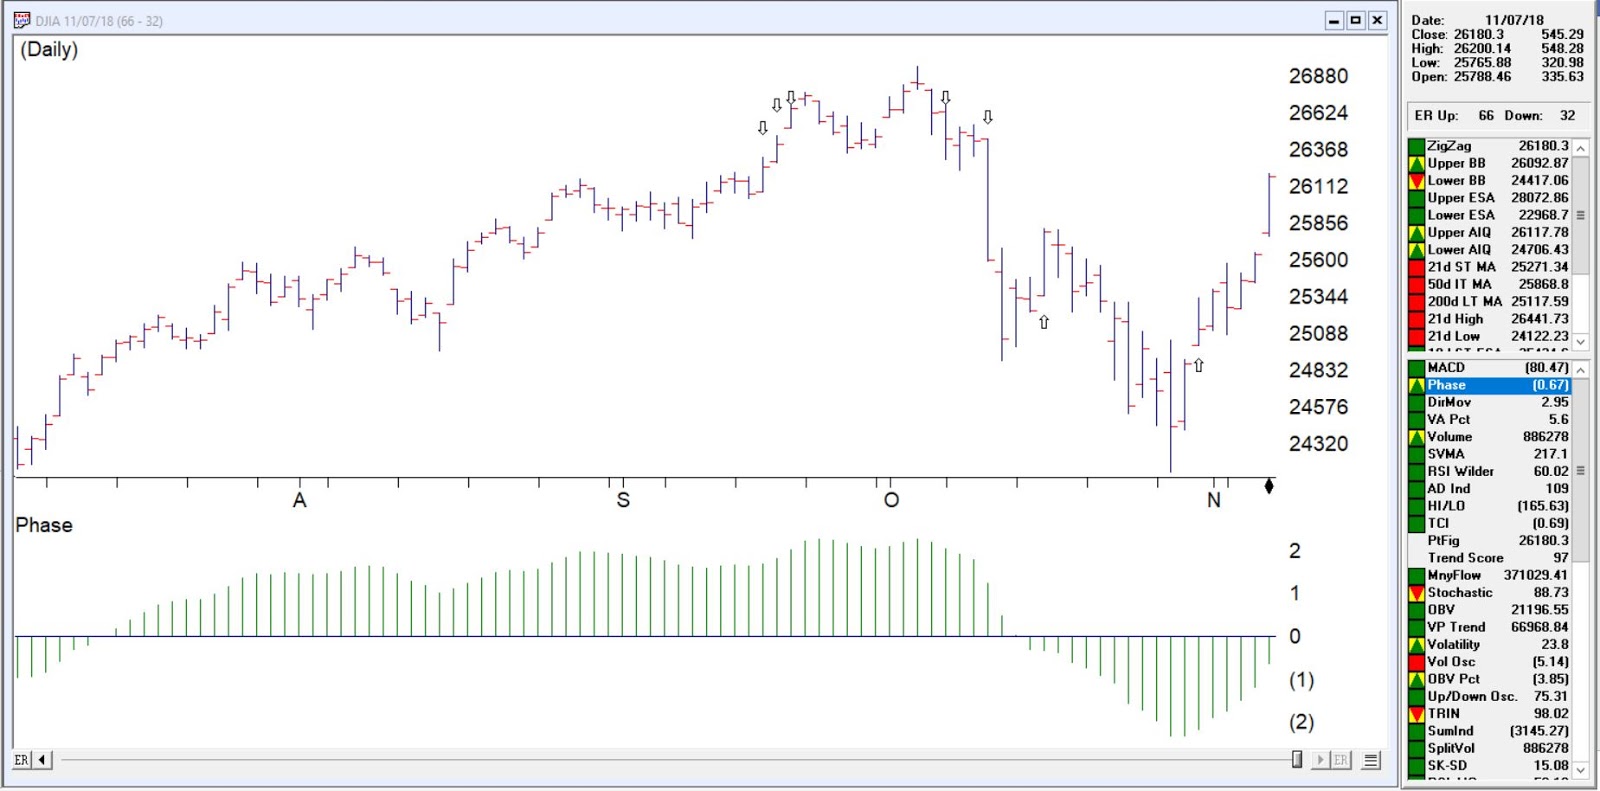
While never perfect, the Expert rating provides a formidable advantage to the trader looking for signs of direction changes in the market. As of 11/7/18 close the DJIA was at 26180
So, the big question on every investor’s mind is “What Comes Next?” Since this is not an advisory service (and given the fact that I am not too good at predicting the future anyway) I have avoided commenting on “the state of the markets” lately. That being said, I do have a few “thoughts”:
*The major averages (as of this exact moment) are still mostly above their longer-term moving averages (200-day, 10-month, 40-week, and so on and so forth). So, on a trend-following basis the trend is still “up”.
*We are in the most favorable 15 months of the 48-month election cycle (though off to a pretty awful start obviously) which beings Oct.1 of the mid-term year and ends Dec. 31st of the pre-election year.
*Investors should be prepared for some volatility as bottoms following sharp drops usually take at least a little while to form and typically are choppy affairs. One day the market is up big and everyone breathes a sigh of relief and then the next day the market tanks. And so on and so forth.
An Indicator to Watch
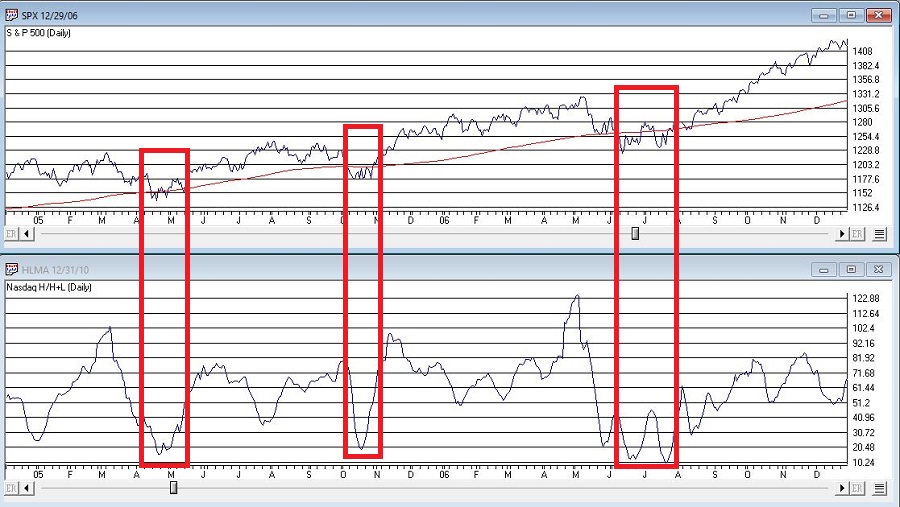
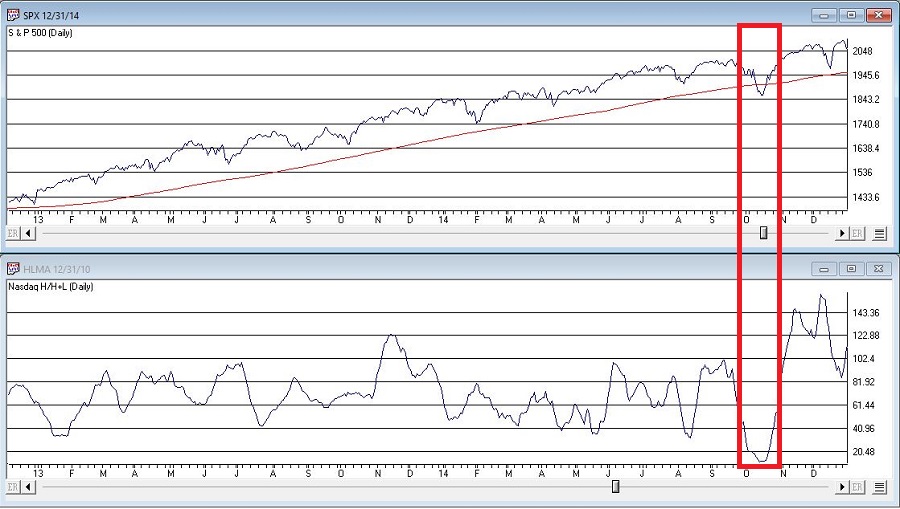
At the outset let me state that there are no “magical” indicators. Still, there are some that typically are pretty useful. One that I follow I refer to as Nasdaq HiLoMA. It works as follows:
A = Nasdaq daily new highs
B = Nasdaq daily new lows
C = (A / (A+B)) * 100
D = 10-day moving average of C
C can range from 0% to 100%. D is simply a 10-day average of C.
Nasdaq HiLoMA = D
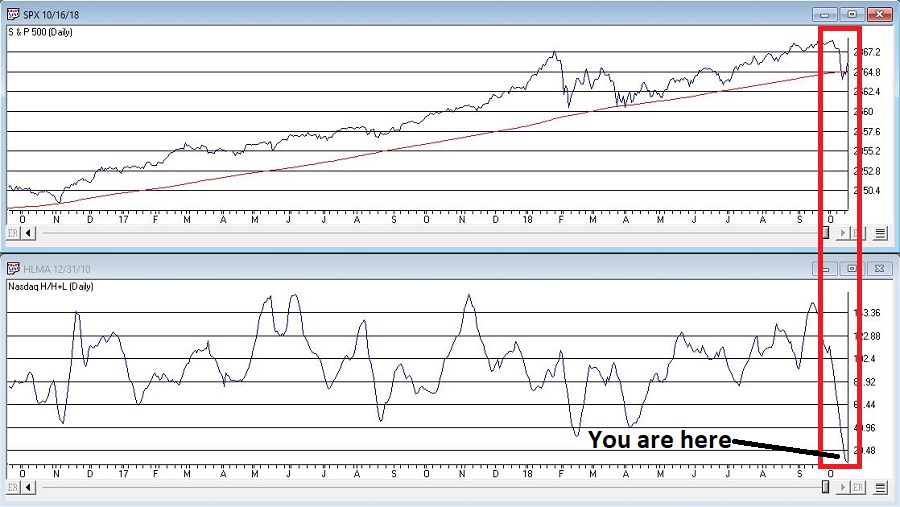
Interpretation: When Nasdaq HiLoMA drops below 20 the market is “oversold”.
Note that the sentence above says “the market is oversold” and NOT “BUY NOW AGGRESSIVELY WITH EVERY PENNY YOU HAVE.” This is an important distinction because – like most indicators – while this one may often give useful signals, it will occasionally give a completely false signal (i.e., the market will continue to decline significantly).
A couple of “finer points”:
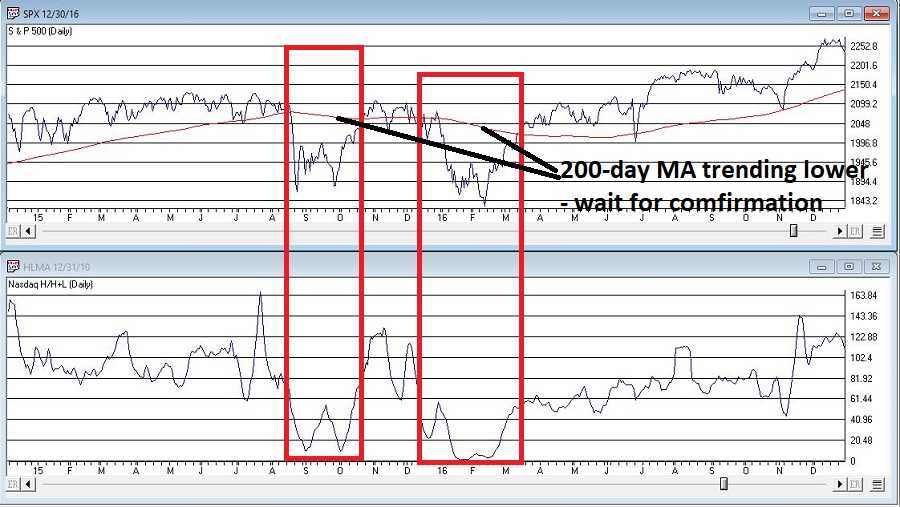
*Look for the indicator to bottom out before considering it to be “bullish”.
*A rise back above 20 is often a sign that the decline is over (but, importantly, not always). Sometimes there may be another retest of recent lows and sometimes a bear market just re-exerts itself)
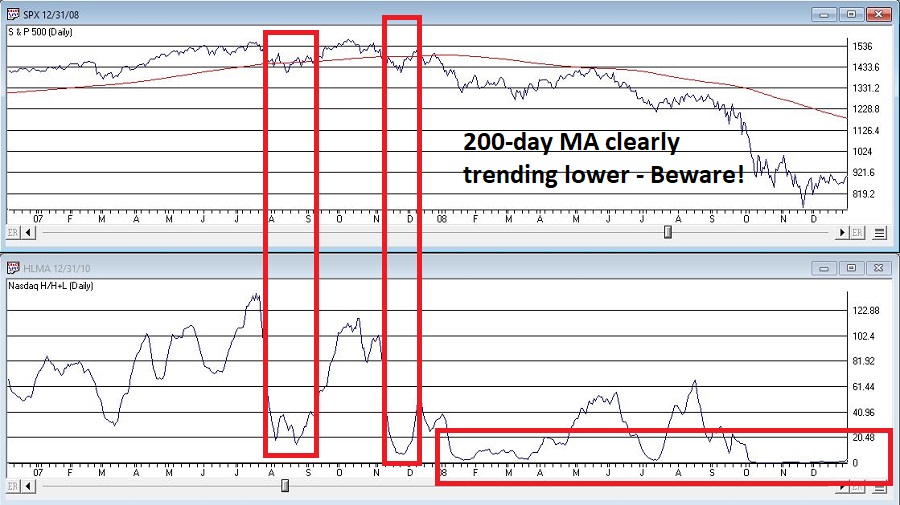
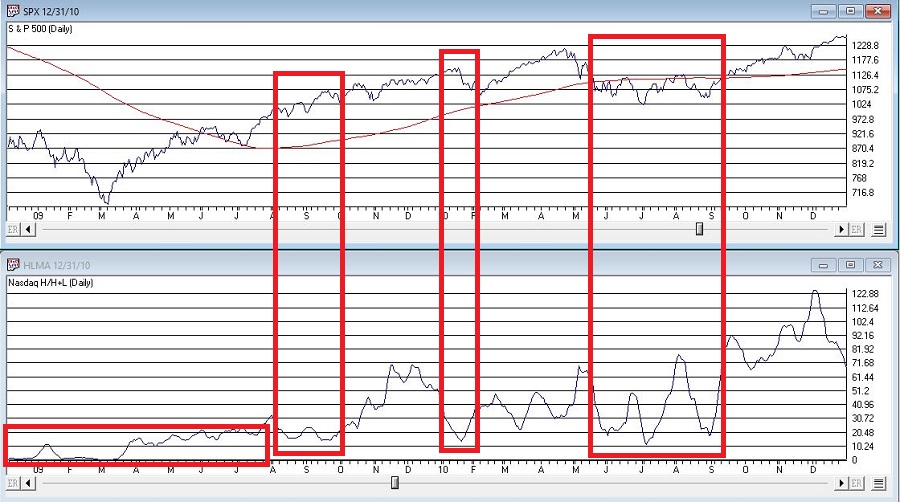
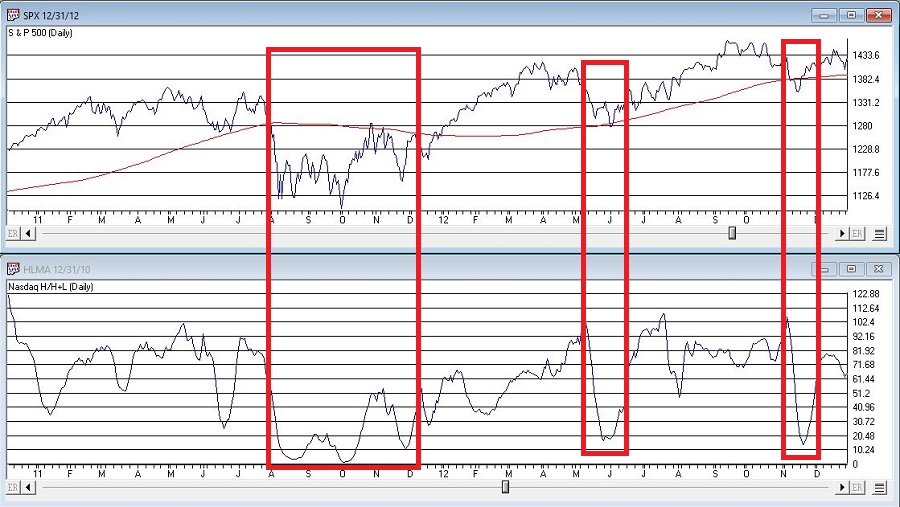
*If the 200-day moving average for the Dow or S&P 500 is currently trending lower be careful about using these signals. Signals are typically more useful if the 200-day moving average for these indexes is rising or at least drifting sideways rather than clearly trending lower (ala 2008).
Figures 2 through 8 displays the S&P 500 Index with the Nasdaq HiLoMA indicator. Click to enlarge any chart.
The stock market is in a favorable seasonal period and is oversold. As long as the former remains true, react accordingly (with proper risk controls in place of course).
Jay Kaeppel
Disclaimer: The data presented herein were obtained from various third-party sources. While I believe the data to be reliable, no representation is made as to, and no responsibility, warranty or liability is accepted for the accuracy or completeness of such information. The information, opinions and ideas expressed herein are for informational and educational purposes only and do not constitute and should not be construed as investment advice, an advertisement or offering of investment advisory services, or an offer to sell or a solicitation to buy any security.
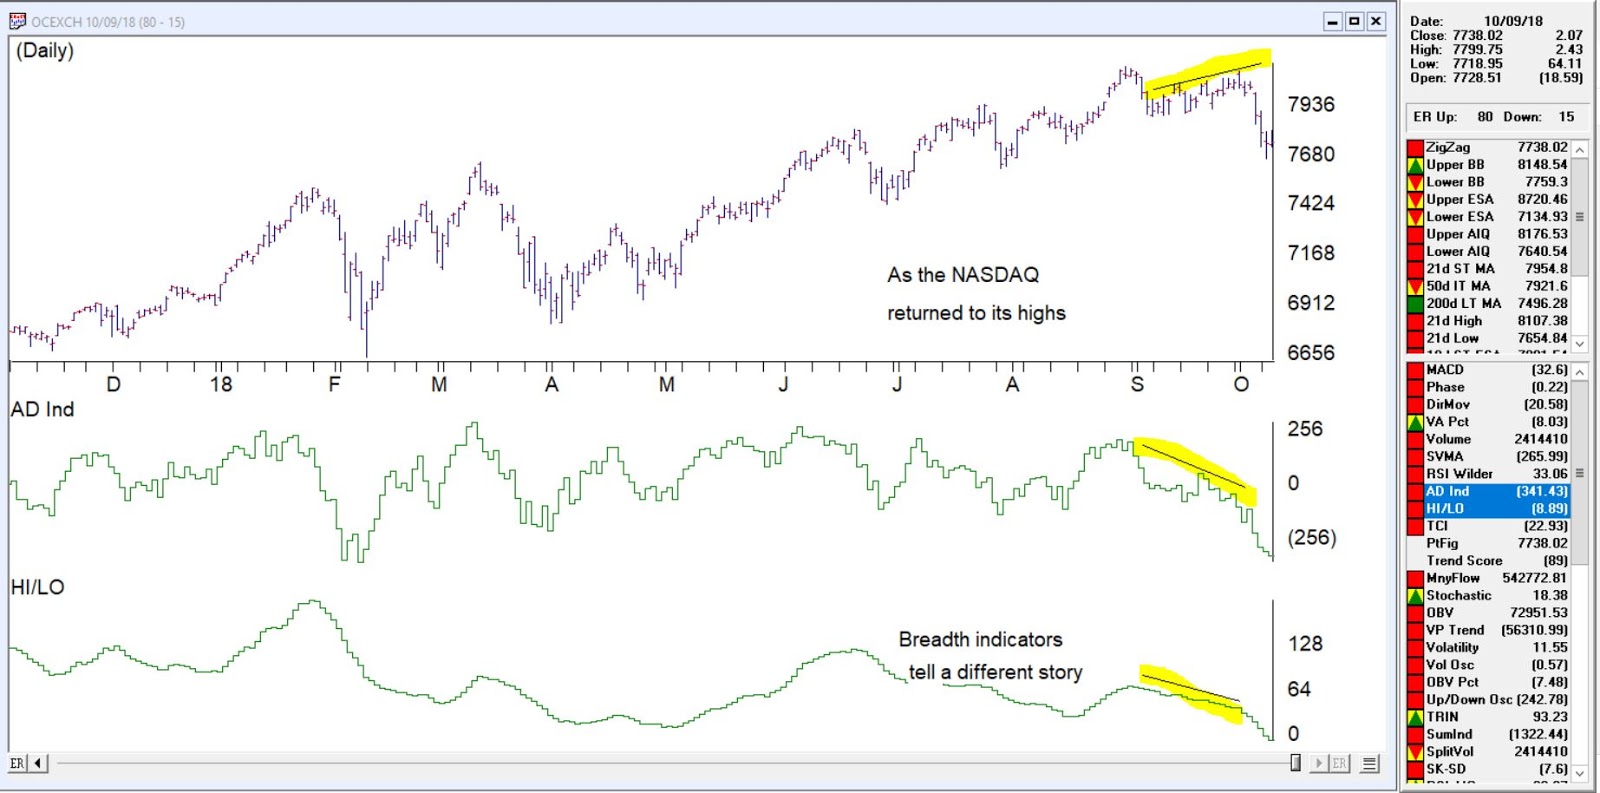
Working on some slides for a seminar last week, it was apparent that breadth indicators on the NASDAQ signaled a divergence from the price action of the market.
Looking specifically at AD Ind and HI/LO, although other breadth measures told the same tale.
The AD indicator explained
The Advance/Decline Indicator is an exponentially weighted average of the net advancing versus declining issues. With this indicator, the direction of the trend is of importance and not the actual value of the indicator. When the indicator is increasing, advances are outweighing declines, and when it is decreasing, there are more declining issues than advancing.
The Advance/Decline Indicator is a breadth indicator very similar to the Advance/Decline Line. However, this indicator tends to be more sensitive and at times will signal a move earlier than the Advance/Decline Line.
The breadth was telling us something was amiss from last week. Take a look at this chart of the NASDAQ clearly a divergence was in place before the downturn.
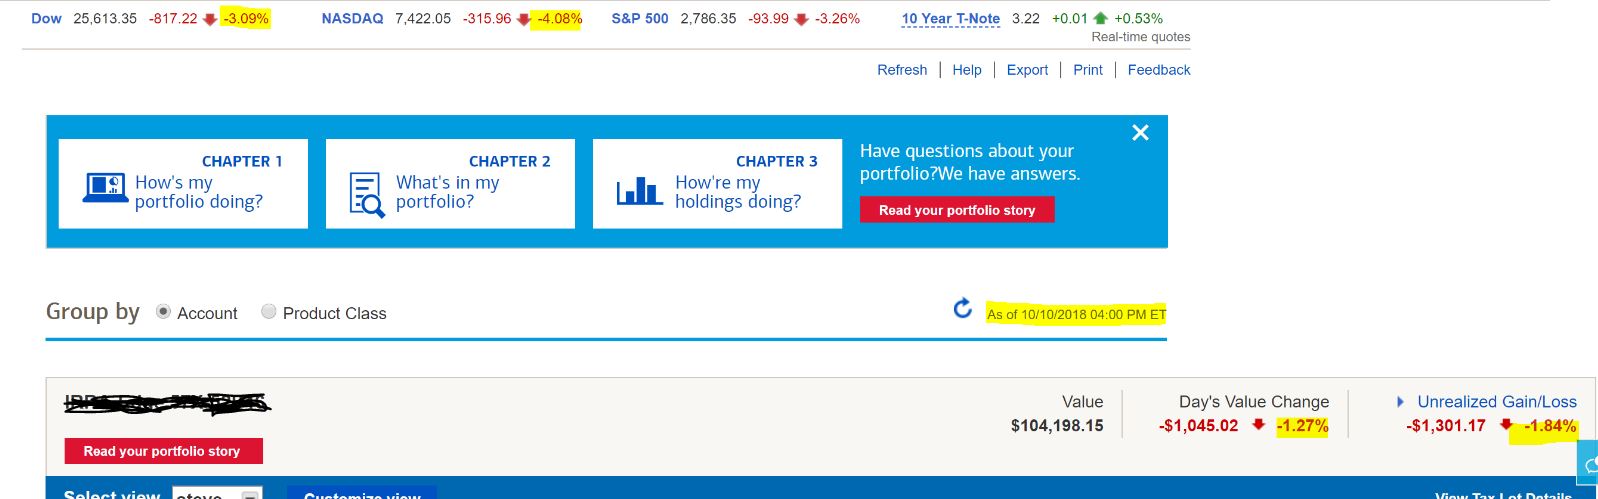
Today’s (10-10-18) 316 point drop in the NASDAQ a 4% drop and nearly 9% drop from the high is close to the 10% corrective point and some buyers may come in over the next few days and keep the decline in check or not.
The markets are down between 6 and 10% in 5 days. Keeping good stops is a must in your portfolio to protect you from the worst of this. Using trailing stops between 7 and 10 % on stocks that are moving and protective stops 5 to 7 % below initial investment for example can easily reduce your losses in these volatile markets.
One of the benefits of being an avowed trend-follower is that it can allow you to avoid a lot of the “angst” that many investors suffer with each new twist and turn in the economic/financial/political/price of tea in China arena. Let’s face it, if you scan the internet, watch cable news or read the financial press you will always have at least – roughly – 10,000 “things” that you could be worried about that will kick the legs out from whatever bullish thing might be happening at the moment.
I have a friend (no, seriously) and his comment recently was “The next person that mentions the Hindenburg Omen gets punched in the face”. The bottom line: someone is always crying “Wolf”, and living in perpetual fear is – let’s be honest – kind of a crappy way to go through life. Which is why I typically advocate focusing on the major trends and not sweating all the small stuff along the way.
Yes, things can go wrong and yes it would be nice to have at least some sort of a heads up in advance. So, in an effort to not be completely ignorant of the goings on around me I do have a few “things” I follow in hopes of getting some “early warning” if trouble is brewing. I call them my 4 bellwethers.
The main thing I look for is “divergence” between the action for the major stock market indexes and the action of these bellwethers. Even the existence of divergences does NOT guarantee trouble. But more often than not, major market tops are presaged by some “signs of trouble”. So, let’s take a look.
The Major Indexes
Figure 1 displays the Dow, Nasdaq 100, S&P 500 and Russell 2000 indexes. As you can see, they are all in up trends, well above their respective 200-day moving averages and 3 of the 4 are at or near all-time highs. In other words, from a solely trend-following perspective, “Thing are swell, things are great.”
(click to enlarge)
Figure 1 – Four major indexes all in bullish trends (Courtesy WinWayCharts TradingExpert)
The Bellwethers
Figure 2 displays my 4 bellwethers – they are:
Ticker SMH: an ETF that tracks the semiconductor sector. The world runs on technology and technology runs on semiconductors.
Dow Transportation Index: Whether the Transports confirm or diverge from the Dow Industrials has long been used as a gauge of market health by investors.
Ticker ZIV: An ETF that is designed to track the inverse of the VIX Index. Long story, but bottom line, it should go up when the market goes up and vice versa. Any deviation from that standard can be a warning sign.
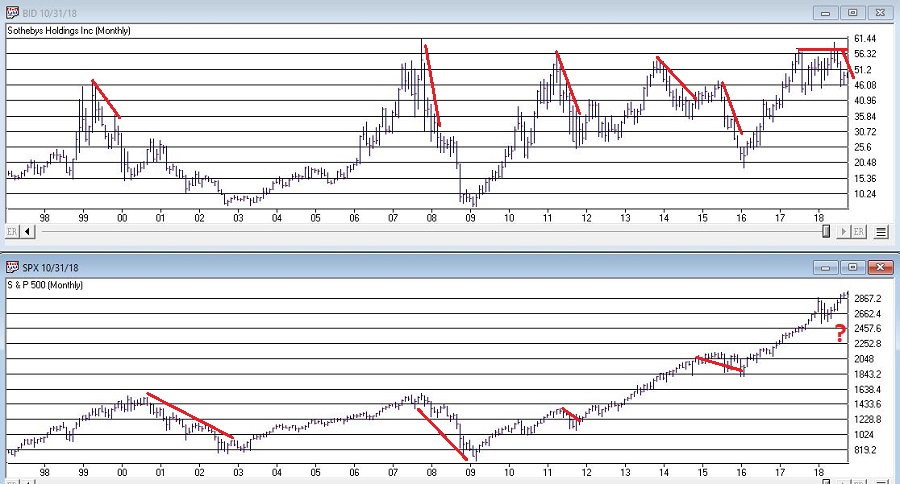
Ticker BID: Sotheby’s Holdings which run high-end auctions. Bottom line, if rich people are comfortable buying expensive stuff that is a good sign for the economy (and should be reflected in a rising trend in BID) and if rich people are NOT comfortable buying expensive stuff, well, vice versa.
As you can see, the Bellwethers are mostly not confirming the major average at the moment. This is not a reason to panic or fell angst. It is simply something to keep an eye on. The longer these divergences continue the more troublesome, so let’s focus on a couple of key things to watch to decide if maybe you should go ahead and start feeling angst.
Dow Transports
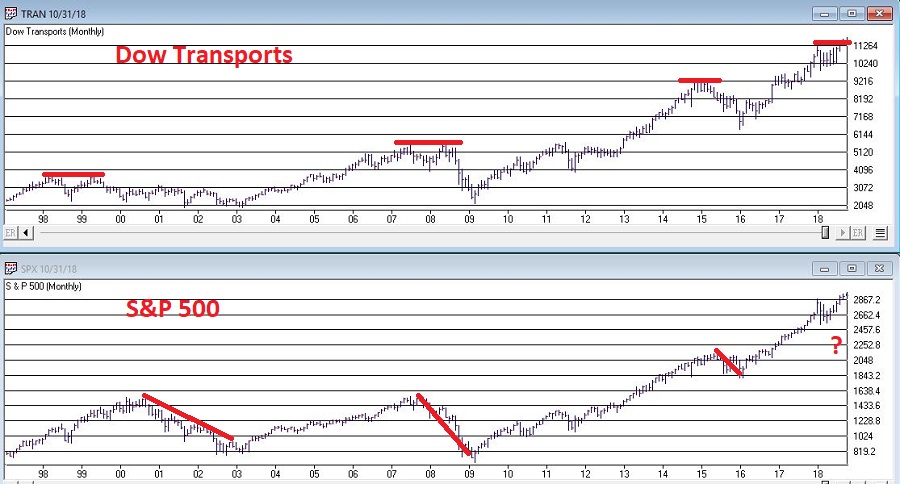
As you can see in Figure 3, double-tops in the Dow Transports have in the past signaled trouble for the overall stock market.
Figure 3 – Dow Transport double tops often a sign of impending trouble (Courtesy WinWayCharts TradingExpert)
The Good News and Bad News for the Transport Index is reflected in the daily chart shown in Figure 4. The Good News is that the Transports recently made a new all-time high. The Bad News is that price has subsequently fallen back below the important support/resistance level marked in Figure 4.
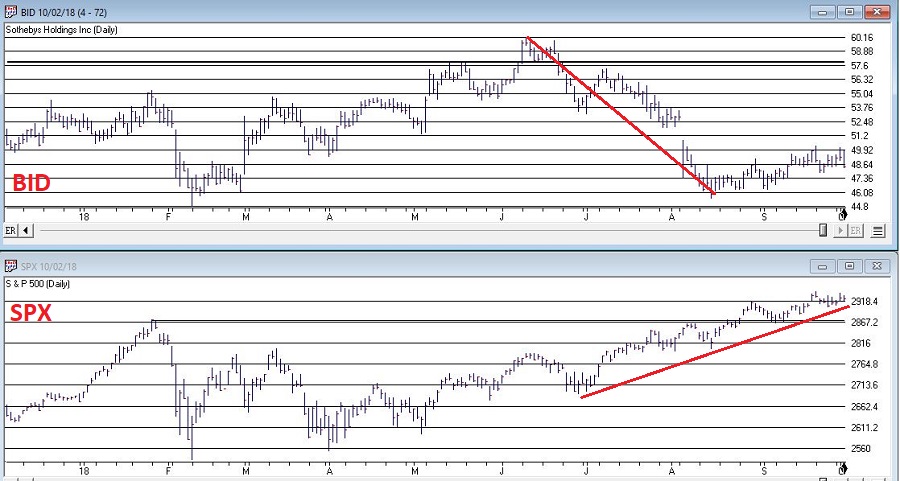
Figure 5 – Breakdowns in BID often an early warning sign (Courtesy WinWayCharts TradingExpert)
As you can see in Figure 6, BID recently tanked 25% before rebounding slightly. Is this a “Look Out Below” warning sign for the stock market? Dunno, but gonna keep a close eye on BID to see if it rebounds…or falls further.
Figure 6 – Ticker BID – which way from here? (Courtesy WinWayCharts TradingExpert)
Summary
The major market averages are (mostly) rallying to new highs while Jay’s 4 Market Bellwethers are, well, it’s too soon to say exactly what they are. But for the moment at least they are mostly not confirming the new highs in the major averages. Please try to remain calm. The proper response is Not fell angst and doubt, but rather to simply keep an eye on how things progress from here. If the Bellwethers start to move higher then “the crisis will have passed.” If not, then it will be very important to keep an eye open for – and to take seriously – signs of weakness in the major averages.
Jay Kaeppel
Disclaimer: The data presented herein were obtained from various third-party sources. While I believe the data to be reliable, no representation is made as to, and no responsibility, warranty or liability is accepted for the accuracy or completeness of such information. The information, opinions and ideas expressed herein are for informational and educational purposes only and do not constitute and should not be construed as investment advice, an advertisement or offering of investment advisory services, or an offer to sell or a solicitation to buy any security.