
One of the benefits of being an avowed trend-follower is that it can allow you to avoid a lot of the “angst” that many investors suffer with each new twist and turn in the economic/financial/political/price of tea in China arena. Let’s face it, if you scan the internet, watch cable news or read the financial press you will always have at least – roughly – 10,000 “things” that you could be worried about that will kick the legs out from whatever bullish thing might be happening at the moment.
I have a friend (no, seriously) and his comment recently was “The next person that mentions the Hindenburg Omen gets punched in the face”. The bottom line: someone is always crying “Wolf”, and living in perpetual fear is – let’s be honest – kind of a crappy way to go through life. Which is why I typically advocate focusing on the major trends and not sweating all the small stuff along the way.
Yes, things can go wrong and yes it would be nice to have at least some sort of a heads up in advance. So, in an effort to not be completely ignorant of the goings on around me I do have a few “things” I follow in hopes of getting some “early warning” if trouble is brewing. I call them my 4 bellwethers.
The main thing I look for is “divergence” between the action for the major stock market indexes and the action of these bellwethers. Even the existence of divergences does NOT guarantee trouble. But more often than not, major market tops are presaged by some “signs of trouble”. So, let’s take a look.
The Major Indexes
Figure 1 displays the Dow, Nasdaq 100, S&P 500 and Russell 2000 indexes. As you can see, they are all in up trends, well above their respective 200-day moving averages and 3 of the 4 are at or near all-time highs. In other words, from a solely trend-following perspective, “Thing are swell, things are great.”
(click to enlarge)
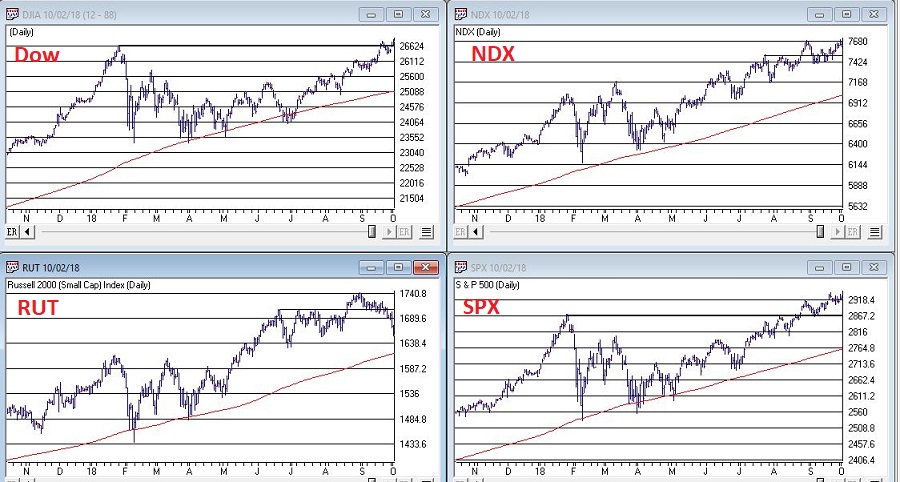
Figure 1 – Four major indexes all in bullish trends (Courtesy WinWayCharts TradingExpert)
The Bellwethers
Figure 2 displays my 4 bellwethers – they are:
Ticker SMH: an ETF that tracks the semiconductor sector. The world runs on technology and technology runs on semiconductors.
Dow Transportation Index: Whether the Transports confirm or diverge from the Dow Industrials has long been used as a gauge of market health by investors.
Ticker ZIV: An ETF that is designed to track the inverse of the VIX Index. Long story, but bottom line, it should go up when the market goes up and vice versa. Any deviation from that standard can be a warning sign.
Ticker BID: Sotheby’s Holdings which run high-end auctions. Bottom line, if rich people are comfortable buying expensive stuff that is a good sign for the economy (and should be reflected in a rising trend in BID) and if rich people are NOT comfortable buying expensive stuff, well, vice versa.
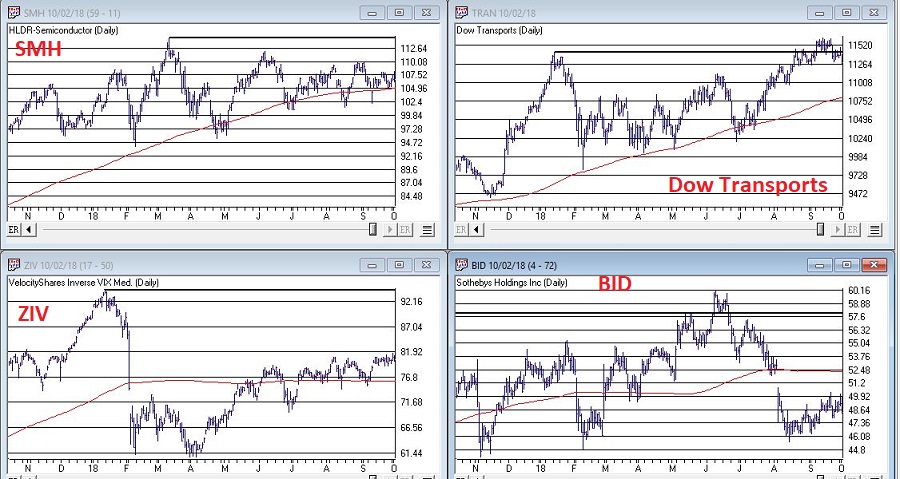
As you can see, the Bellwethers are mostly not confirming the major average at the moment. This is not a reason to panic or fell angst. It is simply something to keep an eye on. The longer these divergences continue the more troublesome, so let’s focus on a couple of key things to watch to decide if maybe you should go ahead and start feeling angst.
Dow Transports
As you can see in Figure 3, double-tops in the Dow Transports have in the past signaled trouble for the overall stock market.
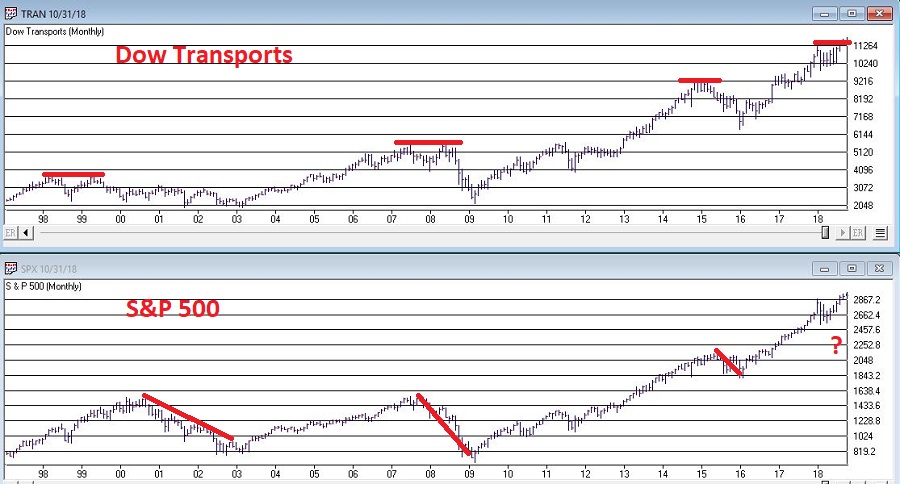
Figure 3 – Dow Transport double tops often a sign of impending trouble (Courtesy WinWayCharts TradingExpert)
The Good News and Bad News for the Transport Index is reflected in the daily chart shown in Figure 4. The Good News is that the Transports recently made a new all-time high. The Bad News is that price has subsequently fallen back below the important support/resistance level marked in Figure 4.
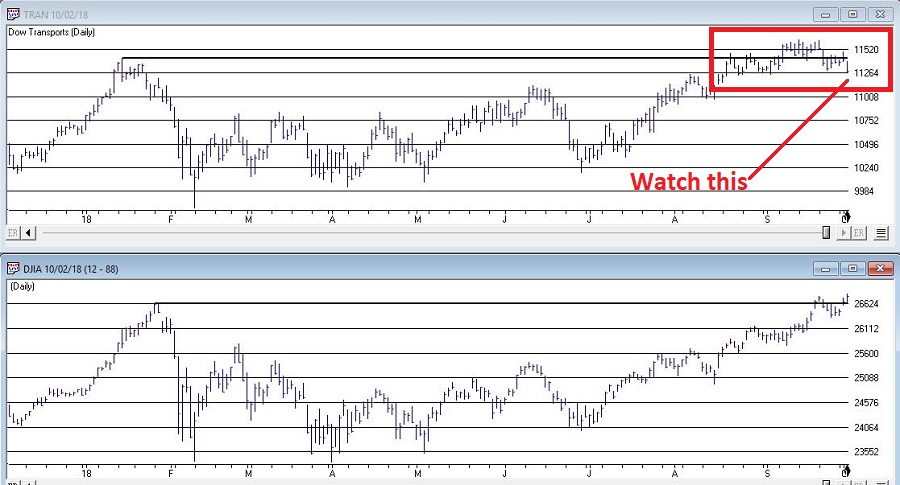
Figure 4 – Daily Dow Transports – up or down? (Courtesy WinWayCharts TradingExpert)
Interpretation going forward is relatively simple:
Good = Dow Transports above 11,424
Bad = Dow Transports below 11,424
Ticker BID
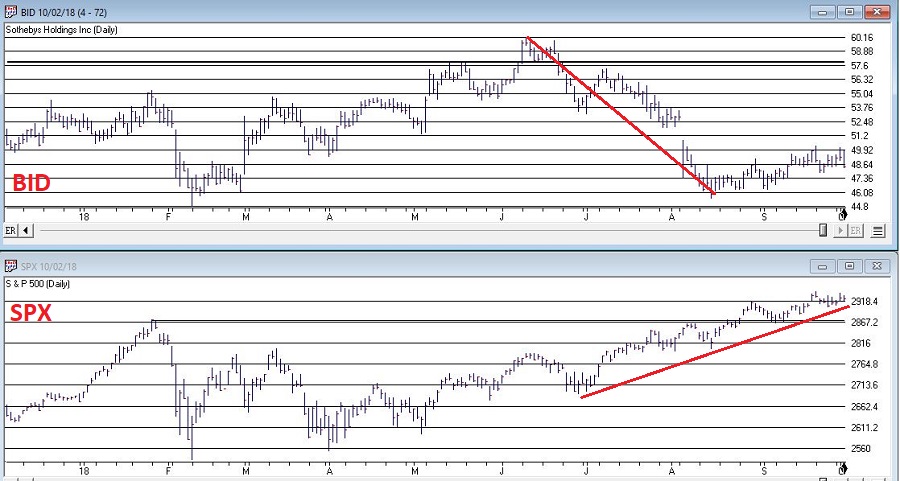
As you can see in Figure 5, weakness in the overall market averages is often presaged well in advance by a major breakdown in the price of BID.
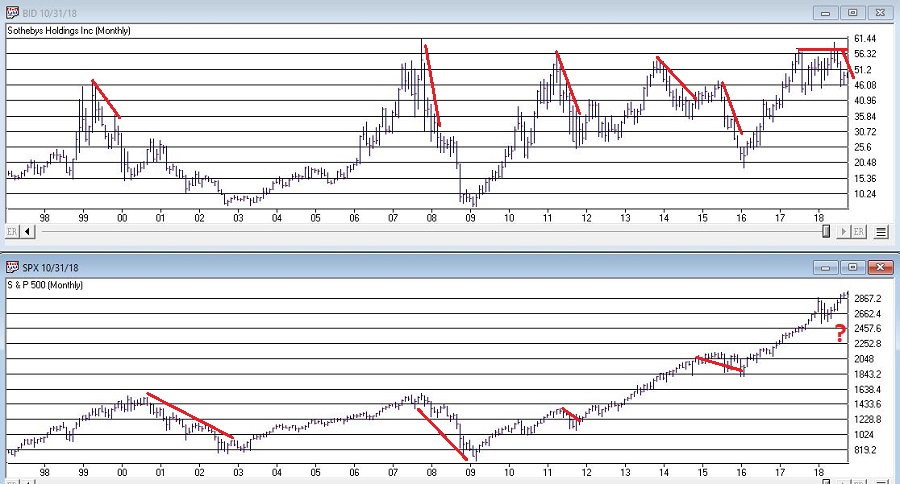
As you can see in Figure 6, BID recently tanked 25% before rebounding slightly. Is this a “Look Out Below” warning sign for the stock market? Dunno, but gonna keep a close eye on BID to see if it rebounds…or falls further.
Summary
The major market averages are (mostly) rallying to new highs while Jay’s 4 Market Bellwethers are, well, it’s too soon to say exactly what they are. But for the moment at least they are mostly not confirming the new highs in the major averages. Please try to remain calm. The proper response is Not fell angst and doubt, but rather to simply keep an eye on how things progress from here. If the Bellwethers start to move higher then “the crisis will have passed.” If not, then it will be very important to keep an eye open for – and to take seriously – signs of weakness in the major averages.
Jay Kaeppel
Disclaimer: The data presented herein were obtained from various third-party sources. While I believe the data to be reliable, no representation is made as to, and no responsibility, warranty or liability is accepted for the accuracy or completeness of such information. The information, opinions and ideas expressed herein are for informational and educational purposes only and do not constitute and should not be construed as investment advice, an advertisement or offering of investment advisory services, or an offer to sell or a solicitation to buy any security.