Jan 6, 2019 | educational newsletters, ETFs, jay kaeppel, sector funds
Crude oil and pretty much the entire energy sector has been crushed in recent months. This type of action sometimes causes investors to wonder if a buying opportunity may be forming.
The answer may well be, “Yes, but not just yet.”
Historically the energy sector shows strength during the February into May period. This is especially true if the November through January period is negative. Let’s take a closer look.
If Fidelity Select Energy (ticker FSENX) shows a loss during November through January then we will buy and hold FSENX from the end of January through the end of May. The cumulative growth of $1,000 appears in Figure 1 and the yearly results in Figure 2.
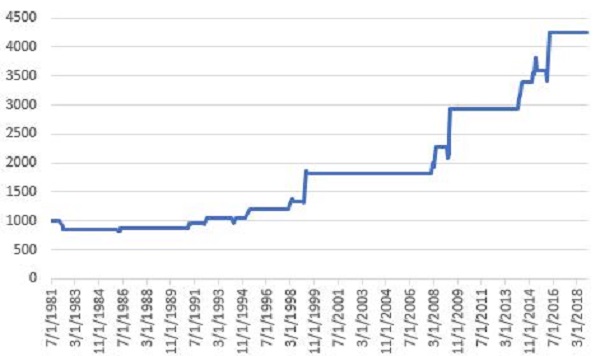
Figure 1 – Growth of $1,000 invested in FSENX ONLY during Feb-May ONLY IF Nov-Jan shows a loss
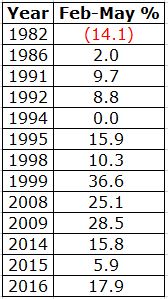
Figure 2 – % + (-) from holding FSENX during Feb-May ONLY IF Nov-Jan shows a loss
Figure 3 displays ticker XLE (an energy ETF that tracks loosely with FSENX). As you can see, at the moment the Nov-Jan return is down roughly -15%.
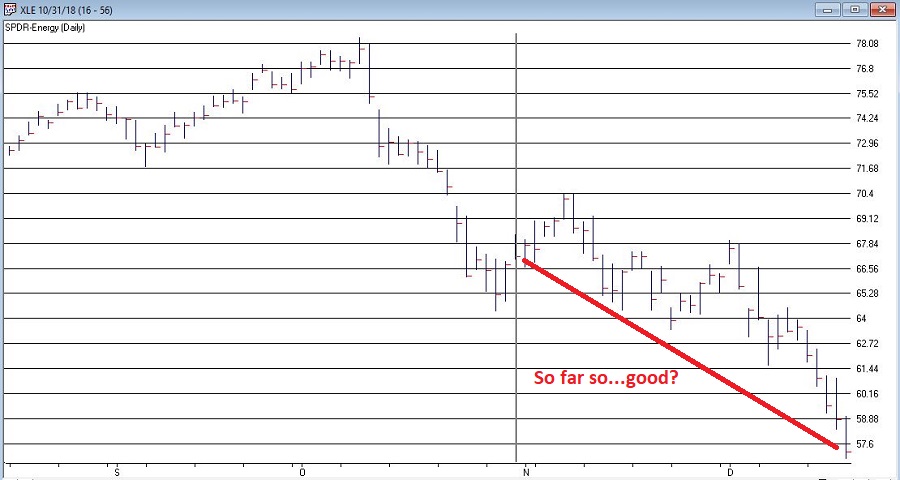
Figure 3 – Ticker XLE (Courtesy TradingExpert)
All of this suggests remaining patient and not trying to pick a bottom in the fickle energy sector. If, however, the energy sector shows a 3-month loss at the end of January, history suggests a buying opportunity may then be at end.
Paraphrasing here – “Patience, ah, people, patience”.
Disclaimer: The data presented herein were obtained from various third-party sources. While I believe the data to be reliable, no representation is made as to, and no responsibility, warranty or liability is accepted for the accuracy or completeness of such information. The information, opinions and ideas expressed herein are for informational and educational purposes only and do not constitute and should not be construed as investment advice, an advertisement or offering of investment advisory services, or an offer to sell or a solicitation to buy any security.
Oct 5, 2018 | educational newsletters, ETFs, indexes, jay kaeppel, market timing, sector funds
One of the benefits of being an avowed trend-follower is that it can allow you to avoid a lot of the “angst” that many investors suffer with each new twist and turn in the economic/financial/political/price of tea in China arena. Let’s face it, if you scan the internet, watch cable news or read the financial press you will always have at least – roughly – 10,000 “things” that you could be worried about that will kick the legs out from whatever bullish thing might be happening at the moment.
I have a friend (no, seriously) and his comment recently was “The next person that mentions the Hindenburg Omen gets punched in the face”. The bottom line: someone is always crying “Wolf”, and living in perpetual fear is – let’s be honest – kind of a crappy way to go through life. Which is why I typically advocate focusing on the major trends and not sweating all the small stuff along the way.
Yes, things can go wrong and yes it would be nice to have at least some sort of a heads up in advance. So, in an effort to not be completely ignorant of the goings on around me I do have a few “things” I follow in hopes of getting some “early warning” if trouble is brewing. I call them my 4 bellwethers.
The main thing I look for is “divergence” between the action for the major stock market indexes and the action of these bellwethers. Even the existence of divergences does NOT guarantee trouble. But more often than not, major market tops are presaged by some “signs of trouble”. So, let’s take a look.
Figure 1 displays the Dow, Nasdaq 100, S&P 500 and Russell 2000 indexes. As you can see, they are all in up trends, well above their respective 200-day moving averages and 3 of the 4 are at or near all-time highs. In other words, from a solely trend-following perspective, “Thing are swell, things are great.”
(click to enlarge)
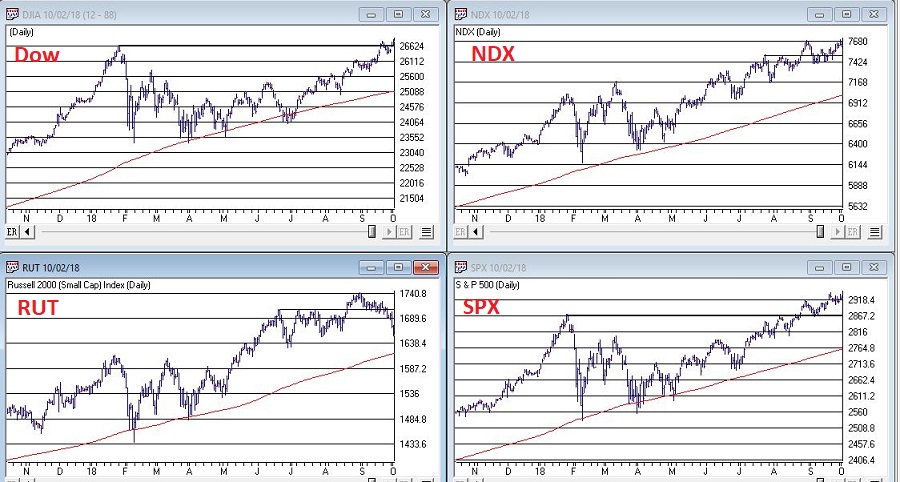
Figure 1 – Four major indexes all in bullish trends (Courtesy WinWayCharts TradingExpert)
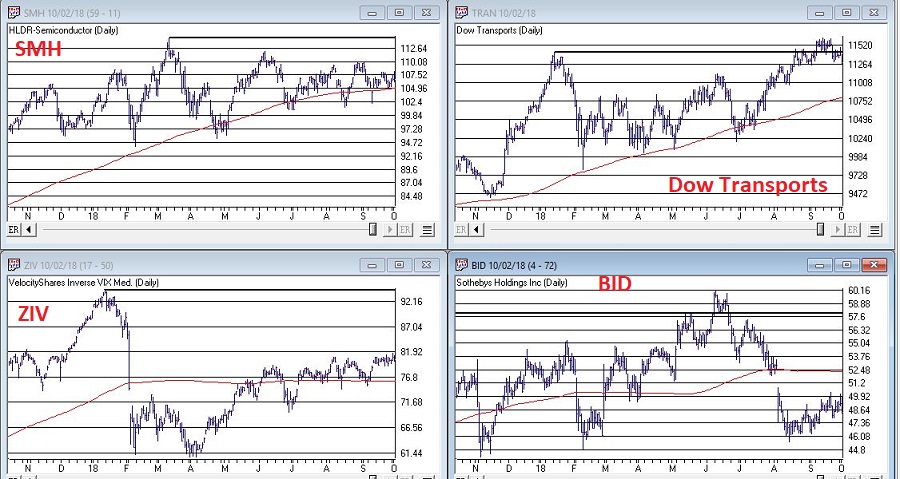
Figure 2 displays my 4 bellwethers – they are:
Ticker SMH: an ETF that tracks the semiconductor sector. The world runs on technology and technology runs on semiconductors.
Dow Transportation Index: Whether the Transports confirm or diverge from the Dow Industrials has long been used as a gauge of market health by investors.
Ticker ZIV: An ETF that is designed to track the inverse of the VIX Index. Long story, but bottom line, it should go up when the market goes up and vice versa. Any deviation from that standard can be a warning sign.
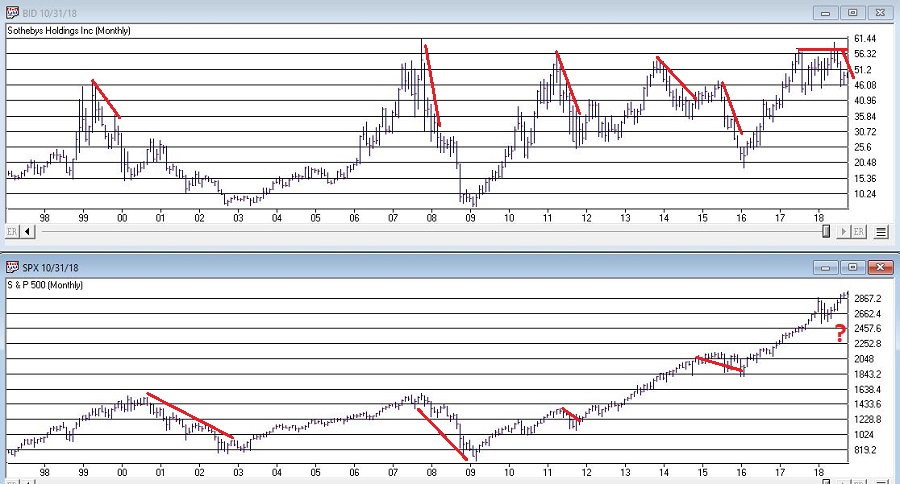
Ticker BID: Sotheby’s Holdings which run high-end auctions. Bottom line, if rich people are comfortable buying expensive stuff that is a good sign for the economy (and should be reflected in a rising trend in BID) and if rich people are NOT comfortable buying expensive stuff, well, vice versa.
As you can see, the Bellwethers are mostly not confirming the major average at the moment. This is not a reason to panic or fell angst. It is simply something to keep an eye on. The longer these divergences continue the more troublesome, so let’s focus on a couple of key things to watch to decide if maybe you should go ahead and start feeling angst.
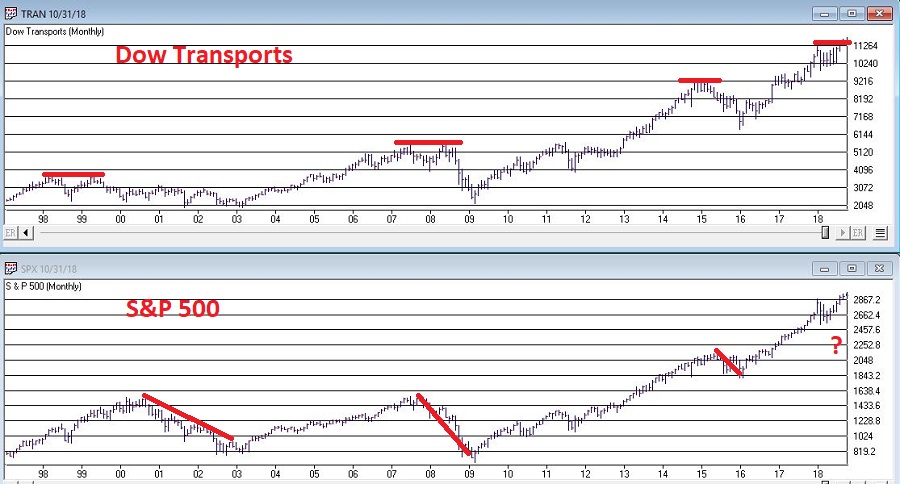
As you can see in Figure 3, double-tops in the Dow Transports have in the past signaled trouble for the overall stock market.
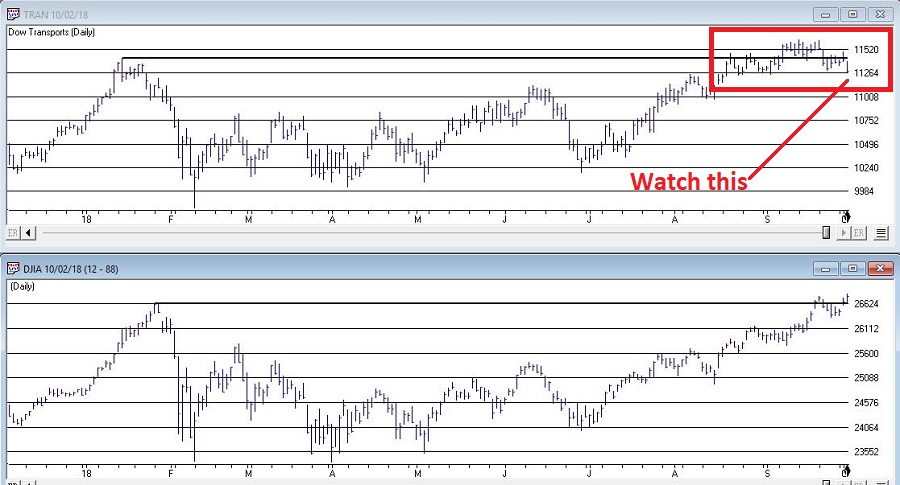
The Good News and Bad News for the Transport Index is reflected in the daily chart shown in Figure 4. The Good News is that the Transports recently made a new all-time high. The Bad News is that price has subsequently fallen back below the important support/resistance level marked in Figure 4.
Good = Dow Transports above 11,424
Bad = Dow Transports below 11,424
As you can see in Figure 5, weakness in the overall market averages is often presaged well in advance by a major breakdown in the price of BID.
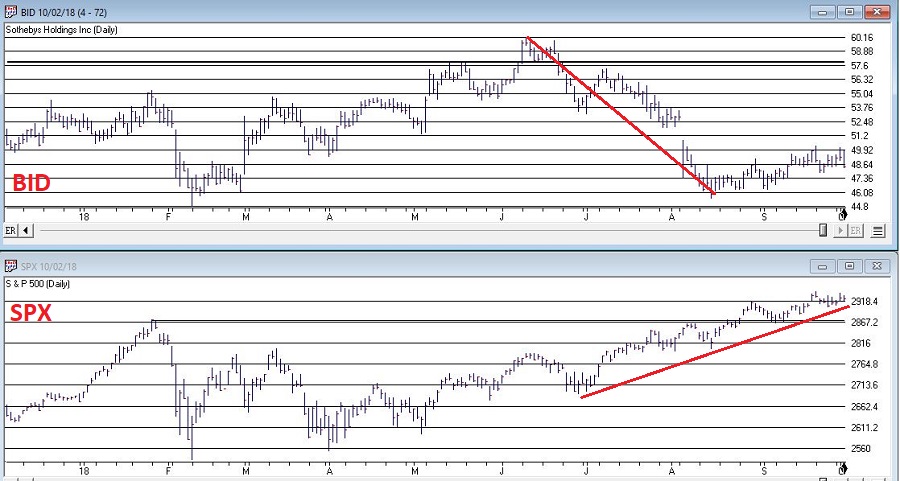
As you can see in Figure 6, BID recently tanked 25% before rebounding slightly. Is this a “Look Out Below” warning sign for the stock market? Dunno, but gonna keep a close eye on BID to see if it rebounds…or falls further.
The major market averages are (mostly) rallying to new highs while Jay’s 4 Market Bellwethers are, well, it’s too soon to say exactly what they are. But for the moment at least they are mostly not confirming the new highs in the major averages. Please try to remain calm. The proper response is Not fell angst and doubt, but rather to simply keep an eye on how things progress from here. If the Bellwethers start to move higher then “the crisis will have passed.” If not, then it will be very important to keep an eye open for – and to take seriously – signs of weakness in the major averages.
Disclaimer: The data presented herein were obtained from various third-party sources. While I believe the data to be reliable, no representation is made as to, and no responsibility, warranty or liability is accepted for the accuracy or completeness of such information. The information, opinions and ideas expressed herein are for informational and educational purposes only and do not constitute and should not be construed as investment advice, an advertisement or offering of investment advisory services, or an offer to sell or a solicitation to buy any security.
Jan 3, 2018 | educational newsletters, jay kaeppel, sector funds
At first blush there might not seem to be much to connect biotech stocks and gold stocks.
One type of company hires people to engage in high tech biomedical engineering in order to develop potentially life-saving – or at least, life altering – medical breakthroughs…
…while the other hires people to (essentially) dig holes in the ground and mine stuff (granted, valuable stuff, but stuff mined out of the ground nevertheless).
But there is one other connection – stocks of both categories are quite volatile. And that alone may be enough to create a potential opportunity.
The BioGold Index
I created an “index” (such as it is) that combines Fidelity Select Biotech (FBIOX) and Fidelity Select Gold (FSAGX). The index appears in Figure 1. Like every other index in the world this index fluctuates up and down.
The RSI32 Index
The RSI32 Index is simply a 2-day average of the standard 3-day RSI Index. The code for TradingExpert EDS is below:
Define days3 5.
U3 is [close]-val([close],1).
D3 is val([close],1)-[close].
AvgU3 is ExpAvg(iff(U3>0,U3,0),days3).
AvgD3 is ExpAvg(iff(D3>=0,D3,0),days3).
RSI3 is 100-(100/(1+(AvgU3/AvgD3))).
RSI32 is simpleavg(RSI3,2).
The RSI32 Index for the BioGold Index appears on the monthly bar chart in Figure 2.
Figure 2 – The BioGold Index with RSI32 (drop to 33 or below = BUY) (Courtesy
TradingExpert)
The BioGold “System”
The BioGold System works as follows:
*When the monthly RSI32 Index drops to 33 or lower, buy BOTH FBIOX and FSAGX
*After a “Buy Signal” then when the monthly RSI32 rises to 64 or higher, sell BOTH FBIOX and FSAGX
For testing purposes we will use monthly total return data for both FBIOX and FSAGX from the PEP Database from Callan Associates.
The Results
Figure 3 displays the results of the buy signals generated using the rules above (assumes that both FBIOX and FSAGX are bought after monthly RSI32 drops to 33 or lower and are held until monthly RSI32 rises to 64 or higher.
| Buy Signal |
Sell Signal |
FBIOX+FSAGX % +(-) |
| 4/30/1992 |
12/31/1992 |
+14.4% |
| 2/26/1993 |
4/30/1993 |
+14.7% |
| 4/29/1994 |
9/30/1994 |
+7.2% |
| 12/30/1994 |
4/28/1995 |
+9.8% |
| 4/30/1997 |
9/30/1997 |
+18.4% |
| 11/28/1997 |
4/30/1998 |
+10.4% |
| 6/30/1998 |
12/31/1998 |
+16.1% |
| 3/30/2001 |
6/29/2001 |
+22.7% |
| 7/31/2002 |
12/31/2002 |
+18.1% |
| 7/30/2004 |
10/29/2004 |
+11.2% |
| 3/31/2005 |
7/29/2005 |
+10.2% |
| 4/30/2008 |
7/31/2008 |
+9.4% |
| 9/30/2008 |
6/30/2009 |
+3.8% |
| 5/31/2012 |
9/28/2012 |
+20.0% |
| 2/28/2013 |
2/28/2014 |
+28.6% |
| 8/31/2015 |
4/29/2016 |
+22.2% |
| 12/30/2016 |
2/28/2017 |
+13.2% |
|
Average % |
+14.7% |
|
Median % |
+14.4% |
|
Std. Deviation % |
6.4% |
|
Max % +(-) |
+28.6% |
|
Min % +(-) |
+3.8% |
Figure 3 – Trade-by-Trade Results
For the record, the “System” has been in FBIOX and FSAGX only 28% of the time (88 months) and out of the market 72% of the time (223 months).
Figure 4 displays the trades in recent years.
Figure 4 – BioGold System trades; 2012-2017 (Courtesy
TradingExpert)
*The Good News is that all 17 signals since 1992 showed a profit, with an average gain if +14.7%.
*The Bad News is that, a) 17 trades in 25 years is a pretty small number of trades and, b) there are some not insignificant drawdowns along the way (-22.8% in 1998 and -22.4% in 2008, -14.1% in 2013 and -13.6% in 2016).
Still, for what it is worth the monthly equity curve appears in Figure 5.
Figure 5 – Growth of $1,000 invested using the “BioGold System”; 12/31/1991-12/29/2017
For the record, the “System” has been in FBIOX and FSAGX only 28% of the time (88 months) and out of the market 72% of the time (223 months).
For the record, the “System” has been in FBIOX and FSAGX only 28% of the time (88 months) and out of the market 72% of the time (223 months). No interest is assumed to be earned while out of the market in the test above.
If we invest in short-term treasuries (1-3 yr.) while not in the stock market we get the results shown in Figure 6.
In Figure 6:
*The blue line represents the growth of $1,000 achieved by holding FBIOX and FSAGX when the BioGold System is on a “buy signal” and 1-3 yr. treasuries the rest of the time.
*The red line represents the growth of $1,000 achieved by buying and holding both FBIOX and FSAGX and then rebalancing at the end of each year.
The “System” grew to $19,863 and the “split” grew to $12,844.
Figure 6 – Growth of $1,000 using BioGold System plus 1-3 yr. treasuries when out of stocks (blue) versus buying and holding FBIOX and FSAGX and rebalancing each year (red);12/31/1991-12/29/2017
Summary
So is the “BioGold System” really a viable investment idea? That’s not for me to say. The per trade returns are pretty good but there aren’t a whole lot of trades and if history is a guide an investor would likely have to ride some significant drawdowns in order to reap the gains.
Still, market-beating performance is market-beating performance, so who knows?
Disclaimer: The data presented herein were obtained from various third-party sources. While I believe the data to be reliable, no representation is made as to, and no responsibility, warranty or liability is accepted for the accuracy or completeness of such information. The information, opinions and ideas expressed herein are for informational and educational purposes only and do not constitute and should not be construed as investment advice, an advertisement or offering of investment advisory services, or an offer to sell or a solicitation to buy any security.
Oct 30, 2017 | educational newsletters, ETFs, jay kaeppel, sector funds
I know I repeat it a lot but the purpose of this blog is not to offer recommendations but rather to share ideas. So here is one that I am not quite sure about but am keeping an eye on.
The FourNonCorr Portfolio
Somewhere awhile back I started looking at trying to pair non correlated – or even inversely correlated – securities in a portfolio that had the potential to outperform the overall market. What follows is what I refer to as the FourNonCorr Portfolio. For the record I do not trade this portfolio with real money. I am still trying to figure out if there is something to it or not. But given that it has outperformed the S&P 500 by a factor of 3-to-1 (granted, using hypothetical results) since December of 2007, I figure it might be worth monitoring for awhile.
The portfolio consists of four ETFs:
Ticker FXE – Guggenheim CurrencyShares Euro Trust
Ticker UUP – PowerShares DB US Dollar Index Bullish
Ticker TLT – iShares Barclays 20+ Yr Treas. Bond
Ticker XIV – VelocityShares Daily Inverse VIX ST ETN
The monthly charts for each appear in Figure 1.
As you can see there is a lot of “zigging” by one accompanied by “zagging” for another. No surprise that when the Euro rises the dollar falls and vice versa. Also, TLT often seems to move opposite XIV. That is essentially the purpose of these pairings.
Figure 2 displays the correlations between the four ETFs in the portfolio (using AIQ TradingExpert Matchmaker function from 8/31/2012 through 8/31/2017 using weekly data). A reading of 1000 indicates a perfect correlation, a reading of -1000 indicates a perfectly inverse correlation.
|
FXE |
UUP |
TLT |
XIV |
| FXE |
|
(913) |
77 |
(13) |
| UUP |
(913) |
|
(117) |
43 |
| TLT |
77 |
(117) |
|
(234) |
| XIV |
(13) |
43 |
(234) |
|
Figure 2 – Correlations for the FourNonCorr Portfolio ETFs (Source:
AIQ TradingExpert)
Clearly there is a whole lot of “not correlating much” going on.
Results
For testing purposes I used monthly total return data for each ETF from the PEP Database from Callan Associates. The one exception is ticker XIV which did not start actual trading until December 2010. For January 2008 through November 2010 I used index data for the index that ticker XIV tracks inversely (
S&P 500 VIX SHORT-TERM FUTURES INDEX). Actual XIV ETF data is used starting in December 2010.
As a benchmark, I also tracked the cumulative total return for ticker SPY (that tracks the S&P 500 Index).
Figure 3 displays the cumulative percent gain or loss for both the FourNonCorr Portfolio and ticker SPY.
Figure 3 – Cumulative % gain/loss for The FourNonCorr Portfolio (blue) versus SPY (red); 12/31/2007-9/30/2017
Year-by-year results appear in Figure 4
|
4 NonCorr |
SPY |
Diff |
| 2008 |
(6.0) |
(37.0) |
31.0 |
| 2009 |
26.1 |
26.4 |
(0.3) |
| 2010 |
45.2 |
14.9 |
30.3 |
| 2011 |
(1.3) |
2.1 |
(3.4) |
| 2012 |
34.3 |
15.8 |
18.5 |
| 2013 |
19.3 |
32.2 |
(12.9) |
| 2014 |
5.3 |
13.5 |
(8.2) |
| 2015 |
0.6 |
1.3 |
(0.8) |
| 2016 |
21.0 |
11.8 |
9.2 |
| 2017* |
24.4 |
14.1 |
10.2 |
Figure 4 – Year-by-Year Results
The results by the numbers appear in Figure 5.
|
4NonCorr |
SPY |
| Average 12mo % +/- |
17.8 |
11.2 |
| Median 12mo % +/- |
14.9 |
15.0 |
| Std. Deviation |
17.1 |
16.8 |
| Ave/Std. Dev. |
1.04 |
0.67 |
| Worst 12mo % |
(11.9) |
(43.2) |
| Max. Drawdown % |
(17.8) |
(48.4) |
Figure 5 – By the numbers
All told The FourNonCorr Portfolio:
*Gained +334% versus +110% for SPY since 12/31/2007
*Experienced a maximum drawdown of -17.8% versus-48.4% for SPY
Thoughts
On paper, The FourNonCorr Portfolio looks pretty decent, particularly compared to the S&P 500 Index. But you will recall that I stated earlier that I don’t actually trade this portfolio with real money. Why not? A few concerns:
*Interest rates tend to move in long-term waves up and down. How beneficial will it be to have TLT in the portfolio if and when interest rates embark on a long-term wave up?
*I don’t entirely trust ticker XIV. Because of the way it is built it seems to have the benefit of upward bias due to contango in the VIX futures market (the opposite of ticker VXX – please Google “VXX” and/or “contango” for an actual explanation) it also holds the potential to sell off in shocking fashion. Using the index data as I did in order to replicate hypothetical performance from Jan 2008 through Nov 2010, XIV declined a stunning -72% between the end of May 2008 and the end of November 2008. It also experienced a -60% decline in 2015-2016. Need to give some thought to adding a security that is even capable of that to a permanent portfolio.
*On the flip side, XIV has been the driving force for gains in recent years and shows a cumulative gain of +416% since 12/31/2007. If (and when?) we ever do see a bear market and/or a significant pickup in volatility will XIV have a large negative influence on performance? That seems to be the $64,000 question.
Summary
As a thought experiment, The FourNonCorr Portfolio shows a pretty decent track record and seems to hold some interesting promise. As a real money, real world experience – questions remain.
Stay tuned, tinker and experiment if you wish,and don’t be too quick to “dive in.”
Disclaimer: The data presented herein were obtained from various third-party sources. Whilne I believe the data to be reliable, no representation is made as to, and no responsibility, warranty or liability is accepted for the accuracy or completeness of such information. The information, opinions and ideas expressed herein are for informational and educational purposes only and do not constitute and should not be construed as investment advice, an advertisement or offering of investment advisory services, or an offer to sell or a solicitation to buy any security.
Jan 7, 2014 | group sector rotation, sector funds
If there is one is universally true statement that I can make about trading systems in general and in specific, it is this – they sure are fun when they work.
When I first started trading – back in what I longingly refer to as the “Hair Era” in my life – I figured that I would be a “gut” trader – i.e., I was determined to rely on my keen instincts and intuitive reasoning to decide when to buy and sell based on current market conditions.
That was not fun. After continually getting sucked into the swirling vortex of emotion – not to mention the abject fear associated with seeing your money disappear – I found that I was getting the, um, back of my front so to speak, burned so many times that I was having difficulty, um, sitting down, so to speak.
Eventually I evolved into a systematic trader. Now I am able to sit down much more often. A few strategies that I have developed over the years have stood the test of time and become something of “bread and butter” strategies. And they sure are fun when they work. To wit….
Jay’s Pure Momentum System
In 2001, I published an article in “Technical Analysis of Stocks and Commodities” magazine titled “Trade Sector Funds with Pure Momentum”, which detailed one specific and simple trading method. While in fact this is only one of many sector trading systems that I have developed over the years – and not necessarily the best one – it remains one of my favorites. Probably because it is just so gosh darn simple. When I was young my Momma told me to be a simple kind of man (or was it a Freebird she told me to be?). Well, in any event, here are the “simple kind of rules” using Fidelity Select Sector funds:
– After the close of the last trading day of the month identify the five Fidelity Select Sector funds that have the largest gain over the previous 240 trading days.
– For this system, ignore Select Gold (ticker FSAGX). If FSAGX appears in the top 5 funds then skip it and include the 6th highest rated funds.
– If fewer than five funds showed a gain over the previous 240 trading days, then hold cash in that portion of the portfolio (i.e., if only 3 funds showed a gain, then 60% of the portfolio would be in those funds and 40% of the portfolio would be in cash).
– If you sell more than one fund at the end of a month, then rebalance the proceeds in the new funds being purchased (example, you are selling Funds A and B and buying Funds C and D. You have $12,000 in Fund A and $10,000 in Fund B. Split the difference and put $11,000 each into funds C and D).
And that’s all there is to it.
The Results
Figure 1 displays the annual results of this method. 
Figure 1 – Jay’s Pure Momentum Annual Results
Figure 2 displays the current portfolio.
Figure 2 – Jay’s Pure Momentum Current Portfolio
My opinion as to why this system has performed well over the years is, well – what else – simple. The effects of a positive change in the fundamentals for a given industry or sector typically take a long time to play out. Thus, by finding the sectors that are performing well you very often find the sectors that are most likely to continue to perform well for a while.
 Figure 3 – 12/31/13 Test (Courtesy: AIQ TradingExpert)
Figure 4 – Several Current Sector Fund Holdings (Courtesy: AIQ TradingExpert)
Summary
Obviously 2013 was a banner year for this system. There is nothing like a rip roaring bull market to help things along. A couple of caveats:
*First off, sometimes people new to momentum investing will look at the charts in Figure 4 and say “Whoa, these things have already rallied sharply, I’m not jumping into those.” That’s something you’ll have to get over to use this system.
*Secondly, while the long-term yearly numbers look pretty good, there was about a 45% drawdown along the way in 2008. So it is not for the faint of heart.
*One other danger is that some people see +48.8% for the year in 2013 and get it in their head that this will occur again often. History suggests otherwise.
Still, an average annual return of +20.7% since 1990 (versus +8.9% for the S&P 500) isn’t bad – especially for a “Simple Kind of System.”
Best of Good Fortune in 2014.
Jay Kaeppel
Chief Market Analyst at JayOnTheMarkets.com and AIQ TradingExpert Pro (http://www.aiq.com) client
Jay has published four books on futures, option and stock trading. He was Head Trader for a CTA from 1995 through 2003. As a computer programmer, he co-developed trading software that was voted “Best Option Trading System” six consecutive years by readers of Technical Analysis of Stocks and Commodities magazine. A featured speaker and instructor at live and on-line trading seminars, he has authored over 30 articles in Technical Analysis of Stocks and Commodities magazine, Active Trader magazine, Futures & Options magazine and on-line at www.Investopedia.com.
Nov 6, 2013 | Seasonality, sector funds, trading strategies
This post is more of an FYI than a specific call to action, still a reasonably good trend is a reasonably good trend.
As many investors know by now the November 1st into May time period has historically been very good for the stock market. One of the better performing sectors during this time period has tended to be the semiconductor/electronics sectors. Among tickers worthy of analysis are:
-FSELX (Fidelity Select Electronics mutual fund)
-SMH (HOLDRs Semiconductor ETF)
In a nutshell, the semiconductor/electronics sectors tend to perform well between October 31st and April 30th. The results for FSELX since October 1994 appear in Figure 1.
Figure 1 – FSELX Performance October 31 to April 30
A chart of the annual growth of $1,000 appears in Figure 2.
Figure 2 – $1,000 invested in FSELX 10/31 through 4.30 since 10/1994
In a nutshell:
-FSELX has been up 14 times (74%) and down 5 times (26%).
-The average gain was +18.7% and the median gain was +13.7%.
-The worst declines were -32.9% during 2000 to 2001 and -19.9% during 2007 to 2008, so remember that there is definitely risk involved
 Figure 3 – Fidelity Select Electronics (Ticker FSELX) (Courtesy: AIQ TradingExpert)
Summary
Please do not read this post and think “Aha, semiconductor/electronic stocks are sure to rally.” That is not the implication I am trying to make. Simply remember that the “trend is your friend” and that this sector tends to perform well during this time period. As long as these stocks act well it may be wise to give the bullish case the benefit of the doubt.
ay Kaeppel
Chief Market Analyst at JayOnTheMarkets.com and AIQ TradingExpert Pro (http://aiq.com) client
Jay has published four books on futures, option and stock trading. He was Head Trader for a CTA from 1995 through 2003. As a computer programmer, he co-developed trading software that was voted “Best Option Trading System” six consecutive years by readers of Technical Analysis of Stocks and Commodities magazine. A featured speaker and instructor at live and on-line trading seminars, he has authored over 30 articles in Technical Analysis of Stocks and Commodities magazine, Active Trader magazine, Futures & Options magazine and on-line at www.Investopedia.com.