Nov 22, 2013 | Uncategorized
The AIQ code based on Donald Pendergast’s article in the December 2013 issue of Stocks & Commodities, “Swing Trading With Three Indicators,” is provided at the following website: www.TradersEdgeSystems.com/traderstips.htm.
In addition to coding the author’s system as described in his article — which uses the following rules: buy to enter long and sell to exit the longs; short to enter shorts and cover to exit shorts — I created a second system that uses average true range to get the breakout amount. I also added some additional trend filters that use the NASDAQ 100 index.
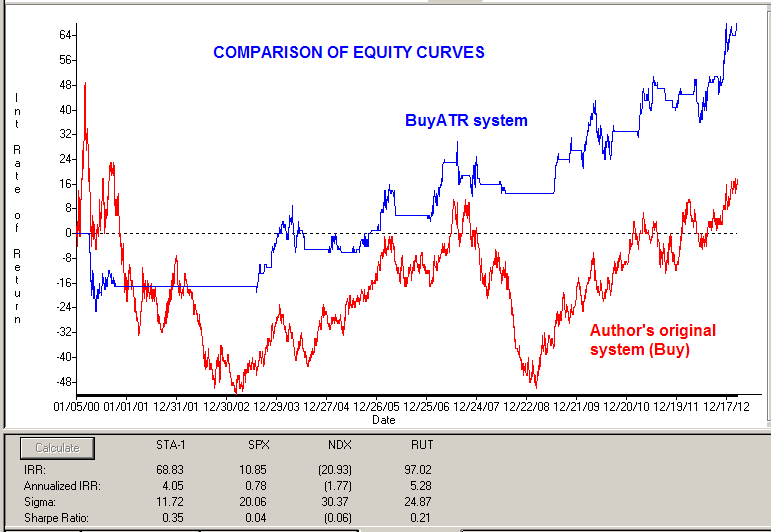
All trading was simulated using closing prices to determine whether an entry/exit had occurred, and then the trades are entered/exited the next day at the open. My modified system uses rules to “BuyATR,” “SellATR,” “ShortATR,” and “CoverATR.” A comparison of equity curves is shown in Figure 7. In testing the short side, neither the author’s original system nor my modified system was able to produce profitable results, although my modified system has a smaller total loss than the author’s original system.

FIGURE 7: AIQ, EQUITY CURVE. Here is a comparison of the equity curves for Donald Pendergast’s original system and my modified system trading the NASDAQ 100 list of stocks for the period 1/5/2000 to 10/9/2013.
The code and EDS file can be downloaded from www.TradersEdgeSystems.com/traderstips.htm.
!SWING TRADING WITH THREE INDICATORS
!Author: Donald Pendergast, TASC December 2013
!Coded by: Richard Denning 10/10/2013
!www.TradersEdgeSystems.com
!INPUTS:
emaLen is 50.
smaLen is 5.
breakAmt is 0.05.
atrLen is 10.
atrMult is 0.04.
H is [high].
L is [low].
C is [close].
C1 is valresult(C,1).
price is C.
emaLenLT is 200.
!UDFs:
maH is simpleavg(H,smaLen).
maL is simpleavg(L,smaLen).
ema is expavg(C,emaLen).
emaLT is expavg(C,emaLenLT).
TR is Max(H - L,max(abs(C1 - L),abs(C1- H))).
ATR is simpleavg(TR,atrLen).
ATRpct is simpleavg(TR/C,atrLen).
ndxC is tickerUDF("NDX",C).
emaNDX is tickerUDF("NDX",ema).
emaNDXlt is tickerUDF("NDX",emaLT).
!SYSTEM RULES:
!Author's system:
Buy if price > maH+breakAmt and C > ema.
Sell if price < maL.
Short if price < maL-breakAmt and C < ema.
Cover if price > maH.
!Modified system using average true range:
BuyATR if price > maH+atrMult*ATR and C > ema and ndxC < emaNDX and ndxC > emaNDXlt .
SellATR if price < maL-atrMult*ATR.
ShortATR if price < maL-atrMult*ATR and C < ema and ndxC > emaNDX.
CoverATR if price > maH+atrMult*ATR.
Nov 22, 2013 | indicators, swing trading
The AIQ code based on Donald Pendergast’s article in the December 2013 issue of Stocks & Commodities, “Swing Trading With Three Indicators,” is provided at the following website: www.TradersEdgeSystems.com/traderstips.htm.
In addition to coding the author’s system as described in his article — which uses the following rules: buy to enter long and sell to exit the longs; short to enter shorts and cover to exit shorts — I created a second system that uses average true range to get the breakout amount. I also added some additional trend filters that use the NASDAQ 100 index.
All trading was simulated using closing prices to determine whether an entry/exit had occurred, and then the trades are entered/exited the next day at the open. My modified system uses rules to “BuyATR,” “SellATR,” “ShortATR,” and “CoverATR.” A comparison of equity curves is shown in Figure 7. In testing the short side, neither the author’s original system nor my modified system was able to produce profitable results, although my modified system has a smaller total loss than the author’s original system.

FIGURE 7: AIQ, EQUITY CURVE. Here is a comparison of the equity curves for Donald Pendergast’s original system and my modified system trading the NASDAQ 100 list of stocks for the period 1/5/2000 to 10/9/2013.
The code and EDS file can be downloaded from www.TradersEdgeSystems.com/traderstips.htm.
!SWING TRADING WITH THREE INDICATORS
!Author: Donald Pendergast, TASC December 2013
!Coded by: Richard Denning 10/10/2013
!www.TradersEdgeSystems.com
!INPUTS:
emaLen is 50.
smaLen is 5.
breakAmt is 0.05.
atrLen is 10.
atrMult is 0.04.
H is [high].
L is [low].
C is [close].
C1 is valresult(C,1).
price is C.
emaLenLT is 200.
!UDFs:
maH is simpleavg(H,smaLen).
maL is simpleavg(L,smaLen).
ema is expavg(C,emaLen).
emaLT is expavg(C,emaLenLT).
TR is Max(H - L,max(abs(C1 - L),abs(C1- H))).
ATR is simpleavg(TR,atrLen).
ATRpct is simpleavg(TR/C,atrLen).
ndxC is tickerUDF("NDX",C).
emaNDX is tickerUDF("NDX",ema).
emaNDXlt is tickerUDF("NDX",emaLT).
!SYSTEM RULES:
!Author's system:
Buy if price > maH+breakAmt and C > ema.
Sell if price < maL.
Short if price < maL-breakAmt and C < ema.
Cover if price > maH.
!Modified system using average true range:
BuyATR if price > maH+atrMult*ATR and C > ema and ndxC < emaNDX and ndxC > emaNDXlt .
SellATR if price < maL-atrMult*ATR.
ShortATR if price < maL-atrMult*ATR and C < ema and ndxC > emaNDX.
CoverATR if price > maH+atrMult*ATR.
Nov 19, 2013 | Uncategorized
AIQ Opening bell contributor and TradingExpert Pro client, jay Kaeppel has a FREE webinar in association with the Market Technicians Association. details are below
On Wednesday, November 20th, 2013, the MTA’s Educational Web Series continues with another free educational webcast event at 12 PM Eastern / 9 AM Pacific. This week, we will feature…
“Finding Exceptional Opportunities with ETFs, Options, & Seasonal Trends”
with Jay Kaeppel
With all of the trading vehicles and great opportunities now available, there has never been a better time to be a trader. The key to success is to identify and take advantage of exceptional opportunities. In this fast-paced session, market veteran and author Jay Kaeppel reveals a handful of unique trading methods that you have likely never considered. Each method details a simple, objective and highly effective plan of action. Take a journey off the beaten path and discover simple trading strategies designed to succeed in the long run.
the link howver will not be live until 11/20/2013
Nov 19, 2013 | ETFs, options, Seasonality
AIQ Opening bell contributor and TradingExpert Pro client, jay Kaeppel has a FREE webinar in association with the Market Technicians Association. details are below
On Wednesday, November 20th, 2013, the MTA’s Educational Web Series continues with another free educational webcast event at 12 PM Eastern / 9 AM Pacific. This week, we will feature…
“Finding Exceptional Opportunities with ETFs, Options, & Seasonal Trends”
with Jay Kaeppel
With all of the trading vehicles and great opportunities now available, there has never been a better time to be a trader. The key to success is to identify and take advantage of exceptional opportunities. In this fast-paced session, market veteran and author Jay Kaeppel reveals a handful of unique trading methods that you have likely never considered. Each method details a simple, objective and highly effective plan of action. Take a journey off the beaten path and discover simple trading strategies designed to succeed in the long run.
the link howver will not be live until 11/20/2013
Nov 14, 2013 | Uncategorized
OK I’ll admit I am a little early with this one. But maybe not as early as you might think. In fact, as I was out driving I saw the first house in my neighborhood to have Christmas lights up…and lit. Hey, desperate times I guess.
While the stock market continues to push to new highs, “morale” is not quite what one might expect. This may be due in part to the fact that it is near impossible to peruse the financial media these days and not come away with a sense of foreboding, given all of the warnings and admonitions and liberal use of word like “frothy” and “bubble.” And make no mistake, I have voiced a few concerns recently myself and have gone so far as to suggest that investors consider hedging with VXX call options (http://jayonthemarkets.com/2013/10/30/is-vxx-issuing-a-warning/) from time to time.
Still, as a person who has been involved in the financial markets for a while I understand the power of the trend. So despite all of my personal concerns about the economy, debt, etc., etc., 2013 has been good to “go with the flow” kind of people. In the short-term, the stock market does appear to be a bit “overbought” and perhaps “due for a correction.” But while anything can happen, history suggests that people who are looking for a stock market collapse before the end of the year may be disappointed. Cue the Christmas music.
The Santa Claus Rally
As I define it, the Santa Claus rally time period:
-Begins at the close of trading on the Friday before Thanksgiving.
-Extends through the close of the third trading day of January.
And that’s all there is to it.
So how has the stock market performed during this period in the past? I am so glad you asked.
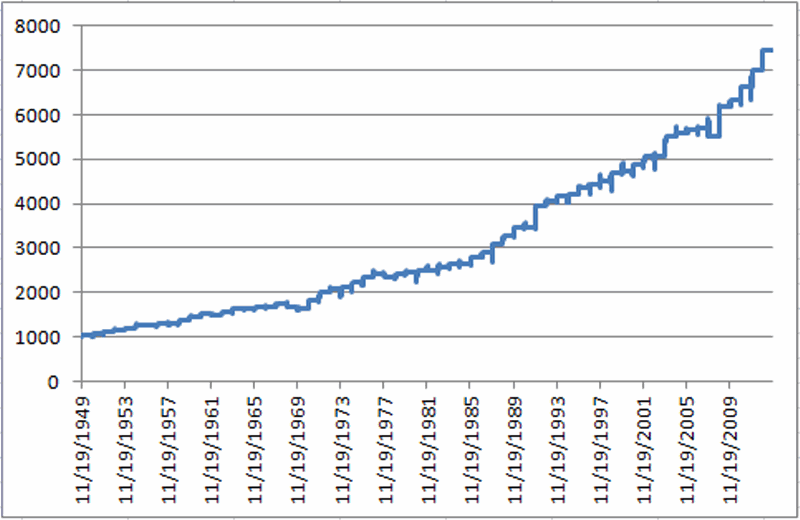
Figure 1 displays the growth of $1,000 invested in the Dow Jones Industrials Average only during the pre-Thanksgiving through post-New Year’s period I just described, starting in November 1949.

Figure 1 – Growth of $1,000 invested in Dow Jones Industrials during Santa Claus Rally period (1949-2012)
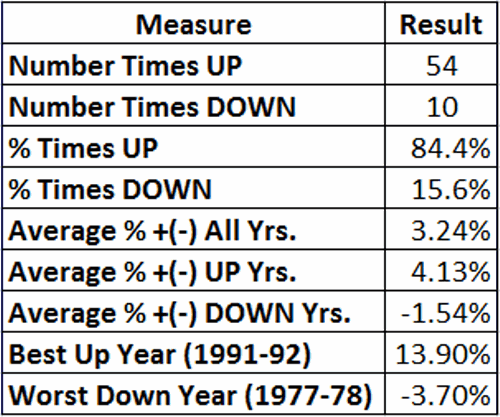
Figure 2 displays some important figures regarding this performance.
Figure 2 – Stock Market Performance during Santa Claus Rally Time Period
One other thing to note is that this Santa Claus Rally time period has witnessed an advance by the Dow during 26 of the last 28 and 32 of the last 35 years. It’s tough to the beat that kind of consistency.
Summary
So does all of this mean that “you can’t lose” trading stocks during this “sure thing” time period guaranteed to generate “above average, risk free” returns? Ah, if only. All any of this really means is that stocks have performed well during this time period in the past. What will happen this year remains to be seen.
Still, the real point is that investors may be wise to give the bullish case every benefit of the doubt starting in late November.
Jay Kaeppel
Chief Market Analyst at JayOnTheMarkets.com and AIQ TradingExpert Pro (http://aiq.com) client
Jay has published four books on futures, option and stock trading. He was Head Trader for a CTA from 1995 through 2003. As a computer programmer, he co-developed trading software that was voted “Best Option Trading System” six consecutive years by readers of Technical Analysis of Stocks and Commodities magazine. A featured speaker and instructor at live and on-line trading seminars, he has authored over 30 articles in Technical Analysis of Stocks and Commodities magazine, Active Trader magazine, Futures & Options magazine and on-line at www.Investopedia.com.
P.S. For all of you “numbers geeks” out there, the annual performance during the Santa Claus Rally Time period appears below
| Period Ending |
DJIA % +(-) |
|
1/5/50
|
3.6
|
|
1/4/51
|
4.0
|
|
1/4/52
|
3.9
|
|
1/6/53
|
4.6
|
|
1/6/54
|
2.9
|
|
1/5/55
|
5.1
|
|
1/5/56
|
0.2
|
|
1/4/57
|
3.7
|
|
1/6/58
|
(0.0)
|
|
1/6/59
|
5.7
|
|
1/6/60
|
5.8
|
|
1/5/61
|
3.2
|
|
1/4/62
|
(1.0)
|
|
1/4/63
|
5.0
|
|
1/6/64
|
5.0
|
|
1/6/65
|
(1.2)
|
|
1/5/66
|
3.0
|
|
1/5/67
|
(0.5)
|
|
1/4/68
|
4.3
|
|
1/6/69
|
(3.1)
|
|
1/6/70
|
(2.4)
|
|
1/6/71
|
10.0
|
|
1/5/72
|
11.6
|
|
1/4/73
|
3.4
|
|
1/4/74
|
2.0
|
|
1/6/75
|
3.6
|
|
1/6/76
|
6.0
|
|
1/5/77
|
3.1
|
|
1/5/78
|
(3.7)
|
|
1/4/79
|
3.6
|
|
1/4/80
|
1.6
|
|
1/6/81
|
1.5
|
|
1/6/82
|
0.9
|
|
1/5/83
|
2.3
|
|
1/5/84
|
2.5
|
|
1/4/85
|
(0.3)
|
|
1/6/86
|
5.7
|
|
1/6/87
|
4.3
|
|
1/6/88
|
6.5
|
|
1/5/89
|
6.2
|
|
1/4/90
|
5.4
|
|
1/4/91
|
0.6
|
|
1/6/92
|
13.9
|
|
1/6/93
|
2.4
|
|
1/5/94
|
2.8
|
|
1/5/95
|
0.9
|
|
1/4/96
|
3.7
|
|
1/6/97
|
1.5
|
|
1/6/98
|
1.8
|
|
1/6/99
|
4.2
|
|
1/5/00
|
1.1
|
|
1/4/01
|
2.7
|
|
1/4/02
|
4.0
|
|
1/6/03
|
(0.4)
|
|
1/6/04
|
9.5
|
|
1/5/05
|
1.3
|
|
1/5/06
|
1.1
|
|
1/5/07
|
0.4
|
|
1/4/08
|
(2.9)
|
|
1/6/09
|
12.0
|
|
1/6/10
|
2.5
|
|
1/5/11
|
4.6
|
|
1/5/12
|
5.3
|
|
1/4/13
|
6.7
|


