Apr 13, 2016 | chart patterns, swing trading, trading strategies
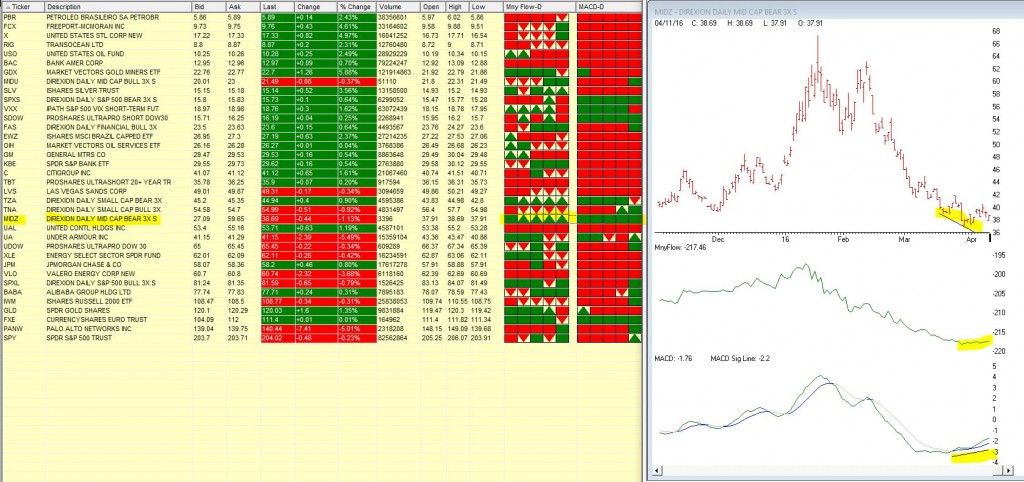
We’ve been watching MIDZ – Direxion Daily Mid Cap bear 3X in our barometer the last few trading days. This 3 x bearish ticker has been in a long down trend, but recently Moneyflow has begun to show signs of accumulation and the MACD diverged up when the price was still heading down.
The 5 day barometer readings on Moneyflow and MACD in our Quotes montage are showing some bullish signs either all green or green arrow up. Maybe times are a changing.
Mar 30, 2016 | group sector rotation, Reports, swing trading, trading strategies
In your WinWay TradingExpert or TradingExpert Pro package, look for the icon for Reports and open it. The Market Log is toward the bottom of the list on the left.
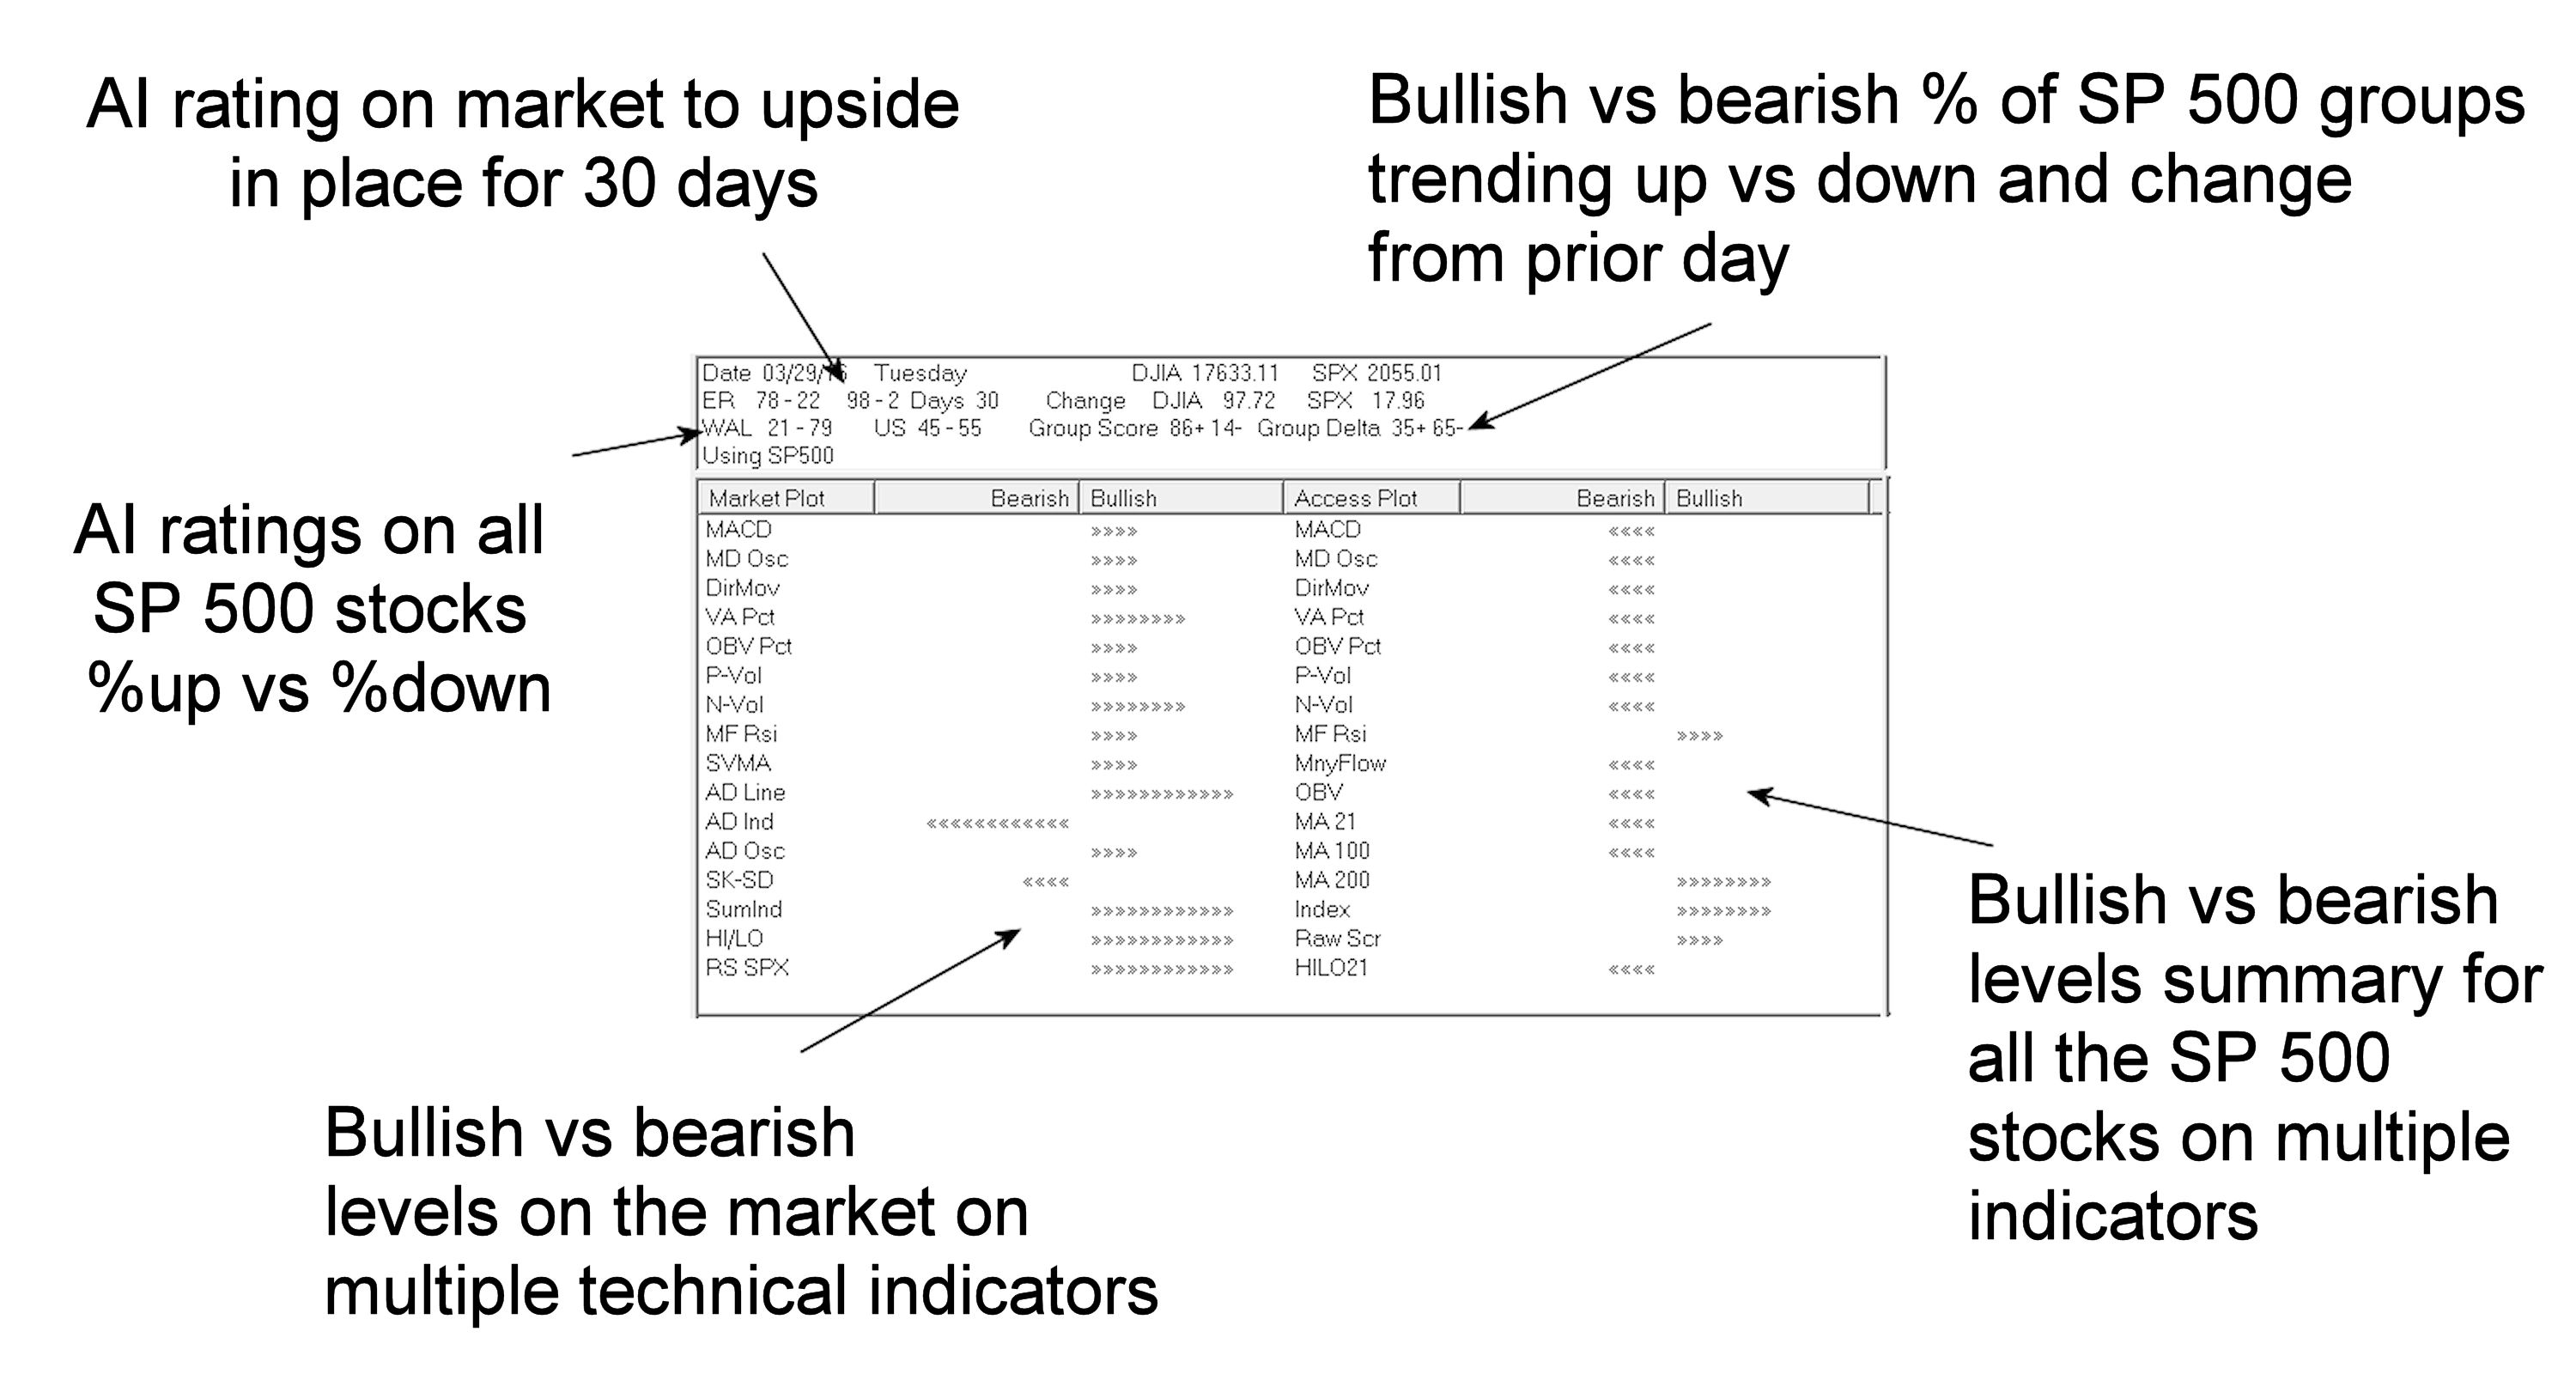
Trading and investing becomes clearer when you’re armed with this snapshot of the market and SP 500 stocks every day.
– AI rating on the market and how long it has been in place
– AI rating on all Sp 500 stocks percentage showing up ratings vs down ratings
– Bullish vs bearish levels on the market on multiple techncial indicators
– Bullish vs bearish percentage of SP 500 groups trending up vs down and the change from prior day
– Bullish vs bearish levels summary for all the SP 500 stocks on multiple indicators

Aug 11, 2014 | indicators, swing trading, trading strategies
In my last article (http://tinyurl.com/mzhstm2) I wrote about a simple entry method I have dubbed “The RSI 3 Strikes and You’re Out Play” or TSYO, for short.
The RSI 3 Strikes and You’re Out Method is a good candidate for option traders as it offers the potential to “make a few bucks” when the market experiences a pullback. So this week I want to offer a few examples.
In the interest of full disclosure I had planned to do it last week, but once my family and I arrived in Aruba I quickly settled into the “Sleep Late, Run on the Beach, Lay on the Beach, Swim in the Ocean and the Pool, Shower, Go to Dinner, Repeat” routine. And in the midst of that “busy” schedule I found little time to write.
TSYO Examples
I have a list of stocks and ETFs that I follow for option trading purposes. Not necessarily the “definitive” list but a good mix of tickers that trade lots of option volume. The list in Figure 1 displays some recent TSYO signals for some of the stocks on my list.
*The first column shows the stock ticker.
*The second column shows the date of the “Alert” signal (i.e., the 2nd non confirmation by RSI).
*The third column shows the date that the stock or ETF takes out the low of the previous three days.
|
Ticker
|
Alert
|
3-Day Low
|
|
AMGN
|
7/3
|
7/8
|
|
AMZN
|
7/22
|
7/25
|
|
EEM
|
7/28
|
7/30
|
|
F
|
7/24
|
7/25
|
|
GM
|
7/3
|
7/17
|
|
IBM
|
7/18
|
7/21
|
|
IBM
|
7/24
|
7/30
|
|
IWM
|
7/1
|
7/7
|
|
JPM
|
7/28
|
7/29
|
|
SLV
|
7/2
|
7/7
|
|
SMH
|
7/22
|
7/24
|
|
TXN
|
7/11
|
7/17
|
Figure 1 – TSYO Alerts and Triggers
For the purposes of this article we will assume that a put option is bought at the close of the “3-Day Low” day. For deciding which put option to buy we will use the “Percent to Double” routine found at www.Optionsanlysis.com.
One note, while I will highlight the profit potential for each trade reviewed, I will not detail any specific “exit criteria”. My goal is to highlight the entry signal and not necessarily create a mechanical “system”. I also think that each trader should do some thinking and consider their own criteria for when to take a profit or cut a loss.
Ticker AMGN
As you can see in Figures 1 and 2, AMGN triggered an “Alert” on 7/3 and made a new 3-day low on 7/8.
Figure 2 – AMGN (Courtesy: AIQ TradingExpert)
What followed was little more than a modest short-term pullback. Still, as you can see in Figure 3, if a trader bought the October 120 put option on 7/8, by 7/17 he or she would have had an open profit of +40.5%.
Ticker AMZN
In this example waiting for a 3-day low before entering actually worked against a trader because on 7/25 AMZN gapped significantly lower as you can see in Figure 4.
Figure 4 – AMZN (Courtesy: AIQ TradingExpert)
Nevertheless, if a trader had bought the September 320 put option at the close on 7/25, by 8/1 he or she would have had an open profit of +69.4%.
Ticker F
The example that follows for Ford (ticker F) highlights two things:
1. The ability to essentially “bet” on a short-term pullback while risking a relatively small amount of capital
2. The above average profit potential associated with trading options.
Ticker F triggered an “Alert” on 7/24 and made a new 3-day low on 7/25.
Figure 6 – F (Courtesy: AIQ TradingExpert)
If a trader had bought the September 17 put option at the close on 7/25, by 8/1 he or she would have had an open profit of +103.6%.
Summary
So once again, the point of all of this is not to attempt to promote the “be all, end all” of trading. Because the TSYO method is most certainly not that. But it can do a pretty decent job of identifying opportunities (especially after the overall market has experienced an extended run up and may be running out of team near term). For traders who are willing to consider alternative (though simple) strategies such as buying put options, a method such as this can offer the potential to make money even as the overall market pulls back.
No one should go out and start making trades using the method I have detailed here without doing some further study/analysis/etc. But the real point of all of this is that it is possible to use relatively simple ideas and relatively little capital to achieve trading success.
Jay Kaeppel
Chief Market Analyst at JayOnTheMarkets.com and AIQ TradingExpert Pro (http://www.aiq.com) client
Jay has published four books on futures, option and stock trading. He was Head Trader for a CTA from 1995 through 2003. As a computer programmer, he co-developed trading software that was voted “Best Option Trading System” six consecutive years by readers of Technical Analysis of Stocks and Commodities magazine. A featured speaker and instructor at live and on-line trading seminars, he has authored over 30 articles in Technical Analysis of Stocks and Commodities magazine, Active Trader magazine, Futures & Options magazine and on-line at www.Investopedia.com.
Jul 31, 2014 | chart patterns, Seasonality, swing trading, trading strategies, Uncategorized
It’s the beginning of the month and time to check the seasonal patterns for August 2014. First off some background.
Our study looks at 7 years of historical data and looks at the returns for all optionable stocks for the month of August from 2006 to 2013.
We filter to find two sets of criteria
– Stocks with gains in all 7 years during August
– Stocks with losses in all 7 years in August
We do make an assumption that the month is 21 trading days and work our way back from the last day of the month. If the last day of the month falls on a weekend, then we use the first trading day prior to that date.
We make no assumptions for drawdown, nor do we look at the fundamentals behind such a pattern. We do compare the stock to the market during the same period and look at the average SPY gain/loss vs. the average stock gain/loss. This helps filter out market influence. We are now including group information to identify particular segments that might display a seasonal bias.
Finally we look at the median gain/loss and look for statistical anomalies, like meteoric gains/loss in one year.
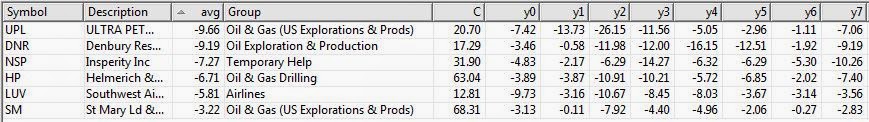
So here are the tickers that met the scan on the loss side, There was only 1 stock on the gainers side. So we’ll look at the down plays only.
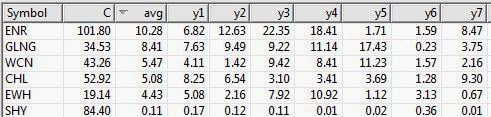
Figure 1 shows the stocks that have had losses in August, 7 years in row.
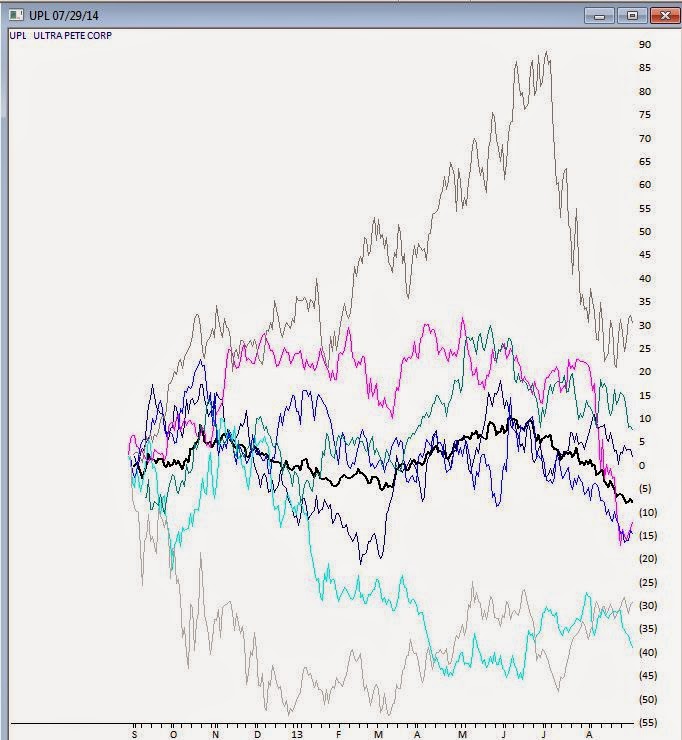
It’s almost immediately apparent that 4 of the 6 losers are in the Oil & Gas sector, one in the Drilling group, and 3 in Exploration and Production (2 US) groups. Not looking like a good month to be long this sector. The biggest loser is UPL, UltraPete Corp with an average -9.66% in August. A couple of years have seen significant losses in August, but the median is still -7.42%. Not being one to speculate on why the Oil & Gas sector has so many stocks taking a hit in August, but there it is. Here’s the seasonal chart of UPL through 8/31/2013, the prominent black line is the average of the 7 years in the study.
Figure 2 seasonal for UPL for last 7 years, average line in black
During the same period the market, as measured by SPY declined an average of -0.06, so there was no overriding market influence during this period.
Figure 3 shows SPY for the same period.
Interestingly a quick check of the Oil & Gas US Explorations and Production group for the same period revealed an average decline of -3.67% in August. The entire group was down 6 of the last 7 years in August. I have 38 stocks in this group in my database.
Figure 4 seasonal average for Oil & Gas US Explorations and Production group
We’ll keep track of the top 2 stocks in the August analysis. UPL and DNR and let you know how they preform.
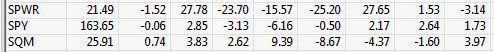
In July, GLNG was the seasonal star with an average of +8.41% for the 7 years through July 30, 2013. Tracking how it performed this July, GLNG opened at 60.73 on July 1, 2014 and reached a high of 65 on July 30, 2014. Some pullback occurring on July 31, 2014 with the entire market down, but still a gain for the month.
Figure 5 shows the stocks that have had gains in July, 7 years in row.
With seasonality you have to figure out what timeframe you want to analyze before anything else. Logic would seem to dictate that one week; comparing this week to the same period over X years would be the smallest time period you might consider. However there are events that seem to be seasonally predictable that occur at the end of a month or the beginning of the month. We’ll look at some these in a future article.
We don’t draw conclusions here, just mine for information.
Nov 22, 2013 | indicators, swing trading
The AIQ code based on Donald Pendergast’s article in the December 2013 issue of Stocks & Commodities, “Swing Trading With Three Indicators,” is provided at the following website: www.TradersEdgeSystems.com/traderstips.htm.
In addition to coding the author’s system as described in his article — which uses the following rules: buy to enter long and sell to exit the longs; short to enter shorts and cover to exit shorts — I created a second system that uses average true range to get the breakout amount. I also added some additional trend filters that use the NASDAQ 100 index.
All trading was simulated using closing prices to determine whether an entry/exit had occurred, and then the trades are entered/exited the next day at the open. My modified system uses rules to “BuyATR,” “SellATR,” “ShortATR,” and “CoverATR.” A comparison of equity curves is shown in Figure 7. In testing the short side, neither the author’s original system nor my modified system was able to produce profitable results, although my modified system has a smaller total loss than the author’s original system.
FIGURE 7: AIQ, EQUITY CURVE. Here is a comparison of the equity curves for Donald Pendergast’s original system and my modified system trading the NASDAQ 100 list of stocks for the period 1/5/2000 to 10/9/2013.
The code and EDS file can be downloaded from www.TradersEdgeSystems.com/traderstips.htm.
!SWING TRADING WITH THREE INDICATORS
!Author: Donald Pendergast, TASC December 2013
!Coded by: Richard Denning 10/10/2013
!www.TradersEdgeSystems.com
!INPUTS:
emaLen is 50.
smaLen is 5.
breakAmt is 0.05.
atrLen is 10.
atrMult is 0.04.
H is [high].
L is [low].
C is [close].
C1 is valresult(C,1).
price is C.
emaLenLT is 200.
!UDFs:
maH is simpleavg(H,smaLen).
maL is simpleavg(L,smaLen).
ema is expavg(C,emaLen).
emaLT is expavg(C,emaLenLT).
TR is Max(H - L,max(abs(C1 - L),abs(C1- H))).
ATR is simpleavg(TR,atrLen).
ATRpct is simpleavg(TR/C,atrLen).
ndxC is tickerUDF("NDX",C).
emaNDX is tickerUDF("NDX",ema).
emaNDXlt is tickerUDF("NDX",emaLT).
!SYSTEM RULES:
!Author's system:
Buy if price > maH+breakAmt and C > ema.
Sell if price < maL.
Short if price < maL-breakAmt and C < ema.
Cover if price > maH.
!Modified system using average true range:
BuyATR if price > maH+atrMult*ATR and C > ema and ndxC < emaNDX and ndxC > emaNDXlt .
SellATR if price < maL-atrMult*ATR.
ShortATR if price < maL-atrMult*ATR and C < ema and ndxC > emaNDX.
CoverATR if price > maH+atrMult*ATR.