It’s the beginning of the month and time to check the seasonal patterns for August 2014. First off some background.
Our study looks at 7 years of historical data and looks at the returns for all optionable stocks for the month of August from 2006 to 2013.
We filter to find two sets of criteria
– Stocks with gains in all 7 years during August
– Stocks with losses in all 7 years in August
We do make an assumption that the month is 21 trading days and work our way back from the last day of the month. If the last day of the month falls on a weekend, then we use the first trading day prior to that date.
We make no assumptions for drawdown, nor do we look at the fundamentals behind such a pattern. We do compare the stock to the market during the same period and look at the average SPY gain/loss vs. the average stock gain/loss. This helps filter out market influence. We are now including group information to identify particular segments that might display a seasonal bias.
Finally we look at the median gain/loss and look for statistical anomalies, like meteoric gains/loss in one year.
So here are the tickers that met the scan on the loss side, There was only 1 stock on the gainers side. So we’ll look at the down plays only.
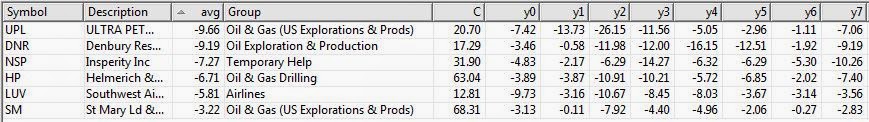
Figure 1 shows the stocks that have had losses in August, 7 years in row.
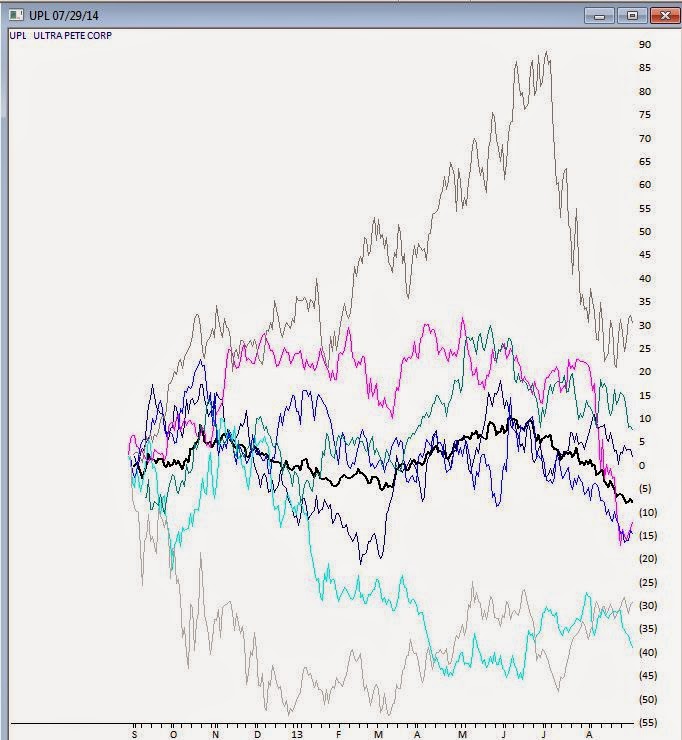
It’s almost immediately apparent that 4 of the 6 losers are in the Oil & Gas sector, one in the Drilling group, and 3 in Exploration and Production (2 US) groups. Not looking like a good month to be long this sector. The biggest loser is UPL, UltraPete Corp with an average -9.66% in August. A couple of years have seen significant losses in August, but the median is still -7.42%. Not being one to speculate on why the Oil & Gas sector has so many stocks taking a hit in August, but there it is. Here’s the seasonal chart of UPL through 8/31/2013, the prominent black line is the average of the 7 years in the study.
Figure 2 seasonal for UPL for last 7 years, average line in black
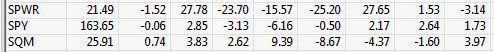
During the same period the market, as measured by SPY declined an average of -0.06, so there was no overriding market influence during this period.
Figure 3 shows SPY for the same period.
Interestingly a quick check of the Oil & Gas US Explorations and Production group for the same period revealed an average decline of -3.67% in August. The entire group was down 6 of the last 7 years in August. I have 38 stocks in this group in my database.
Figure 4 seasonal average for Oil & Gas US Explorations and Production group
We’ll keep track of the top 2 stocks in the August analysis. UPL and DNR and let you know how they preform.
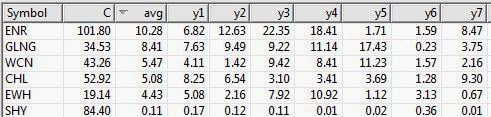
In July, GLNG was the seasonal star with an average of +8.41% for the 7 years through July 30, 2013. Tracking how it performed this July, GLNG opened at 60.73 on July 1, 2014 and reached a high of 65 on July 30, 2014. Some pullback occurring on July 31, 2014 with the entire market down, but still a gain for the month.
Figure 5 shows the stocks that have had gains in July, 7 years in row.
With seasonality you have to figure out what timeframe you want to analyze before anything else. Logic would seem to dictate that one week; comparing this week to the same period over X years would be the smallest time period you might consider. However there are events that seem to be seasonally predictable that occur at the end of a month or the beginning of the month. We’ll look at some these in a future article.
We don’t draw conclusions here, just mine for information.