Jan 6, 2014 | Uncategorized
The treasury bond market has showed a strong seasonal tendency to perform poorly during the early part of the year. People often ask me “why” this would be so. In fact I get that question often enough to make me wish I had a good answer. Alas, as a proud graduate of “The School of Whatever Works”, I can only repeat our school motto, which is “Whatever!”
Two Early Year Trends in T-Bonds: Part 1
First let’s look at the performance of t-bond futures between the end of the first trading day of the new year and the 14th trading day of February starting in 1978. Figure 1 displays the performance achieved by an (extremely stubborn and not terribly astute) investor who held a long position in t-bond futures during this time period every year.
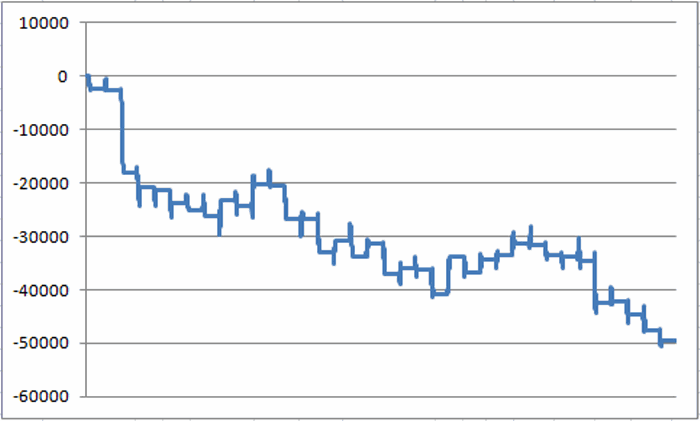 Figure 1 – Long t-bond futures from on January Trading Day 1 through February Trading Day 14 (1978-present)
All told, the loss came to -$49,511 (excluding any slippage and/or commissions). Of course, like all seasonal trends there is never any guarantee that the trend will hold true the next time around. For the record the Jan TD 1 through Feb TD 14 period saw T-bonds:
– Gain 10 times
– Lose 25 times
– Breakeven 1 time
Each point movement in t-bond futures is worth $1,000
– The median gain during up years was +$2,234
– The median loss during down years was -$2,406
– The largest gain was $6,937 in 2000.
– The largest loss was -$15,281 in 1980.
So basically, t-bonds gained 28% of the time, and lost or broke even 72% of the time, and the median loss was slightly greater than the median gain.
Two Early Year Trend in T-Bonds: Part 2
Let’s look next at the net performance for t-bonds during the first four months of the calendar year. Typically, after bonds sink into mid-February there is a bounce in the second half of February. But for our test we will just consider the results achieved by holding a long position in t-bonds from December 31st each year through the end of April. These results appear in Figure 2.
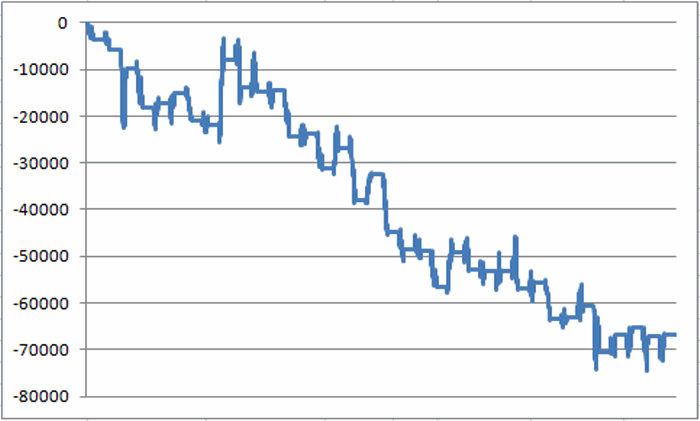 Figure 2 – Long t-bond futures December 31st through April 31st
All told, the loss came to -$66,389 (excluding any slippage and/or commissions). Of course, like all seasonal trends there is never any guarantee that the trend will hold true the next time around. For the record the Dec 31st to Apr 30th period saw T-bonds:
– Gain 16 times
– Lose 20 times
Each point movement in t-bond futures is worth $1,000
– The median gain during up years was +$1,797
– The median loss during down years was -$4,813
– The largest gain was $13,968 in 1986.
– The largest loss was -$11,313 in 1994.
In reality, the January through April time frame has seen t-bonds show a loss only 56% of the time. So this trend is absolutely by no means a sure thing, so the one thing you should absolutely not do is get it in your head that t-bonds are bound to decline between now and the end of April.
The key thing to note regarding this trend is that the median “down” year has witnessed a decline that is 2.7 times larger than the median gain shown during the “up” years. So the key is simply to recognize the potential danger.
Summary
With t-bonds presently quite oversold, it is a little difficult to jump on the bearish bandwagon at the moment (in fact, bonds are rallying nicely as I write here on the first trading day of the year). And as I have tried to make clear, a decline in t-bond prices during either of both of the highlighted periods is by no means a sure thing. Still, this little bit of history suggests that getting wildly bullish on t-bonds may not be the best strategy.
Jay Kaeppel
Chief Market Analyst at JayOnTheMarkets.com and AIQ TradingExpert Pro (http://www.aiq.com) client
Jay has published four books on futures, option and stock trading. He was Head Trader for a CTA from 1995 through 2003. As a computer programmer, he co-developed trading software that was voted “Best Option Trading System” six consecutive years by readers of Technical Analysis of Stocks and Commodities magazine. A featured speaker and instructor at live and on-line trading seminars, he has authored over 30 articles in Technical Analysis of Stocks and Commodities magazine, Active Trader magazine, Futures & Options magazine and on-line at www.Investopedia.com.
Jan 6, 2014 | bonds
The treasury bond market has showed a strong seasonal tendency to perform poorly during the early part of the year. People often ask me “why” this would be so. In fact I get that question often enough to make me wish I had a good answer. Alas, as a proud graduate of “The School of Whatever Works”, I can only repeat our school motto, which is “Whatever!”
Two Early Year Trends in T-Bonds: Part 1
First let’s look at the performance of t-bond futures between the end of the first trading day of the new year and the 14th trading day of February starting in 1978. Figure 1 displays the performance achieved by an (extremely stubborn and not terribly astute) investor who held a long position in t-bond futures during this time period every year.
Figure 1 – Long t-bond futures from on January Trading Day 1 through February Trading Day 14 (1978-present)
All told, the loss came to -$49,511 (excluding any slippage and/or commissions). Of course, like all seasonal trends there is never any guarantee that the trend will hold true the next time around. For the record the Jan TD 1 through Feb TD 14 period saw T-bonds:
– Gain 10 times
– Lose 25 times
– Breakeven 1 time
Each point movement in t-bond futures is worth $1,000
– The median gain during up years was +$2,234
– The median loss during down years was -$2,406
– The largest gain was $6,937 in 2000.
– The largest loss was -$15,281 in 1980.
So basically, t-bonds gained 28% of the time, and lost or broke even 72% of the time, and the median loss was slightly greater than the median gain.
Two Early Year Trend in T-Bonds: Part 2
Let’s look next at the net performance for t-bonds during the first four months of the calendar year. Typically, after bonds sink into mid-February there is a bounce in the second half of February. But for our test we will just consider the results achieved by holding a long position in t-bonds from December 31st each year through the end of April. These results appear in Figure 2.
Figure 2 – Long t-bond futures December 31st through April 31st
All told, the loss came to -$66,389 (excluding any slippage and/or commissions). Of course, like all seasonal trends there is never any guarantee that the trend will hold true the next time around. For the record the Dec 31st to Apr 30th period saw T-bonds:
– Gain 16 times
– Lose 20 times
Each point movement in t-bond futures is worth $1,000
– The median gain during up years was +$1,797
– The median loss during down years was -$4,813
– The largest gain was $13,968 in 1986.
– The largest loss was -$11,313 in 1994.
In reality, the January through April time frame has seen t-bonds show a loss only 56% of the time. So this trend is absolutely by no means a sure thing, so the one thing you should absolutely not do is get it in your head that t-bonds are bound to decline between now and the end of April.
The key thing to note regarding this trend is that the median “down” year has witnessed a decline that is 2.7 times larger than the median gain shown during the “up” years. So the key is simply to recognize the potential danger.
Summary
With t-bonds presently quite oversold, it is a little difficult to jump on the bearish bandwagon at the moment (in fact, bonds are rallying nicely as I write here on the first trading day of the year). And as I have tried to make clear, a decline in t-bond prices during either of both of the highlighted periods is by no means a sure thing. Still, this little bit of history suggests that getting wildly bullish on t-bonds may not be the best strategy.
Jay Kaeppel
Chief Market Analyst at JayOnTheMarkets.com and AIQ TradingExpert Pro (http://www.aiq.com) client
Jay has published four books on futures, option and stock trading. He was Head Trader for a CTA from 1995 through 2003. As a computer programmer, he co-developed trading software that was voted “Best Option Trading System” six consecutive years by readers of Technical Analysis of Stocks and Commodities magazine. A featured speaker and instructor at live and on-line trading seminars, he has authored over 30 articles in Technical Analysis of Stocks and Commodities magazine, Active Trader magazine, Futures & Options magazine and on-line at www.Investopedia.com.
Dec 26, 2013 | Uncategorized
Some seasonal trends have shown a tendency to persist through time (hence the use of the word “trend”, I guess). As it turns out we are at the cusp of one of “those times” right now. It is sitting there like a wrapped gift under the tree with our name on it – so let’s not waste any time diving in.
December-January Changeover
The period we will look at encompasses the last 4 trading days of December and the first 3 trading days of the following January. In other words, a contiguous 7 day trading period during which the stock market has showed a tendency to behave in a bullish manner.
Now given the persistence of the recent market run up, many may be a little leery of diving in here. Which I understand. Still, the numbers are what they are, so let’s take a look.
The Test
So as not to make it easy on ourselves, this test begins in December 1933, i.e., in the early days off the great Depression. We will buy the Dow Jones industrials Average at the close of the fifth to last trading day of the year and sell at the close of the third trading day of January. This test assumes no interest is earned while out of the market so that we measure only the performance during the supposedly bullish period.
The Results
Figure 1 displays the growth of $1,000 invested in the Dow every year since 1933 during the seven trading days just described.
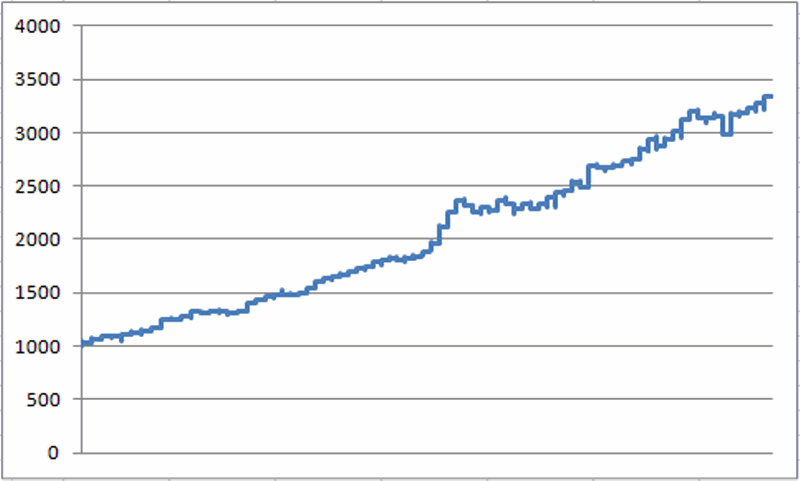
Figure 1 – Growth of $1,000 invested in Dow Industrials during bullish 7-day period (1933-present)
Two anecdotal comments from a quick perusal of the graph in Figure 1:
-There is clearly a lower left to upper right trend, which is what we want to see in any equity curve
-It is by no means “perfect”, so a little closer analysis of the numbers may be useful in convincing ourselves that this trend might actually be useful. So in order to gain some perspective, let’s compare the performance of the Dow during this time period versus Dow performance for all trading days.
A few figures of note:
-System average daily performance is +0.22% versus +0.03% for all trading days (7.53 times greater).
-System median daily performance is +0.17% versus +0.03% for all trading days (4.00 times greater).
-338 out of 560 system trading days showed a gain (60.4%).
-10,946 out of all 20,922 trading days showed a gain (52.3%).
-Average 7-day return only during system days = +1.55%.
-Average 7-day return for all trading days = +0.20%.
-The 7-day system period has showed a gain in 62 of the past 80 years (or 77.5% of the time)
One other thing to note is that returns (and albeit risk) is enhanced by trading leveraged funds such as ticker UDPIX (Profunds UltraDow) or UDOW (ProShares UltraDow30 ETF).
Summary
So is the Dow destined to be higher at the close on January 6, 2014 than it was at the close on December 24th, 2013? Not necessarily. But that would seem to be the way to bet.
Jay Kaeppel
Chief Market Analyst at JayOnTheMarkets.com and AIQ TradingExpert Pro (http://www.aiq.com) client
Jay has published four books on futures, option and stock trading. He was Head Trader for a CTA from 1995 through 2003. As a computer programmer, he co-developed trading software that was voted “Best Option Trading System” six consecutive years by readers of Technical Analysis of Stocks and Commodities magazine. A featured speaker and instructor at live and on-line trading seminars, he has authored over 30 articles in Technical Analysis of Stocks and Commodities magazine, Active Trader magazine, Futures & Options magazine and on-line at www.Investopedia.com.
Dec 26, 2013 | Seasonality
Some seasonal trends have shown a tendency to persist through time (hence the use of the word “trend”, I guess). As it turns out we are at the cusp of one of “those times” right now. It is sitting there like a wrapped gift under the tree with our name on it – so let’s not waste any time diving in.
December-January Changeover
The period we will look at encompasses the last 4 trading days of December and the first 3 trading days of the following January. In other words, a contiguous 7 day trading period during which the stock market has showed a tendency to behave in a bullish manner.
Now given the persistence of the recent market run up, many may be a little leery of diving in here. Which I understand. Still, the numbers are what they are, so let’s take a look.
The Test
So as not to make it easy on ourselves, this test begins in December 1933, i.e., in the early days off the great Depression. We will buy the Dow Jones industrials Average at the close of the fifth to last trading day of the year and sell at the close of the third trading day of January. This test assumes no interest is earned while out of the market so that we measure only the performance during the supposedly bullish period.
The Results
Figure 1 displays the growth of $1,000 invested in the Dow every year since 1933 during the seven trading days just described.
Figure 1 – Growth of $1,000 invested in Dow Industrials during bullish 7-day period (1933-present)
Two anecdotal comments from a quick perusal of the graph in Figure 1:
-There is clearly a lower left to upper right trend, which is what we want to see in any equity curve
-It is by no means “perfect”, so a little closer analysis of the numbers may be useful in convincing ourselves that this trend might actually be useful. So in order to gain some perspective, let’s compare the performance of the Dow during this time period versus Dow performance for all trading days.
A few figures of note:
-System average daily performance is +0.22% versus +0.03% for all trading days (7.53 times greater).
-System median daily performance is +0.17% versus +0.03% for all trading days (4.00 times greater).
-338 out of 560 system trading days showed a gain (60.4%).
-10,946 out of all 20,922 trading days showed a gain (52.3%).
-Average 7-day return only during system days = +1.55%.
-Average 7-day return for all trading days = +0.20%.
-The 7-day system period has showed a gain in 62 of the past 80 years (or 77.5% of the time)
One other thing to note is that returns (and albeit risk) is enhanced by trading leveraged funds such as ticker UDPIX (Profunds UltraDow) or UDOW (ProShares UltraDow30 ETF).
Summary
So is the Dow destined to be higher at the close on January 6, 2014 than it was at the close on December 24th, 2013? Not necessarily. But that would seem to be the way to bet.
Jay Kaeppel
Chief Market Analyst at JayOnTheMarkets.com and AIQ TradingExpert Pro (http://www.aiq.com) client
Jay has published four books on futures, option and stock trading. He was Head Trader for a CTA from 1995 through 2003. As a computer programmer, he co-developed trading software that was voted “Best Option Trading System” six consecutive years by readers of Technical Analysis of Stocks and Commodities magazine. A featured speaker and instructor at live and on-line trading seminars, he has authored over 30 articles in Technical Analysis of Stocks and Commodities magazine, Active Trader magazine, Futures & Options magazine and on-line at www.Investopedia.com.
Dec 21, 2013 | Uncategorized
This article presents another twist to the one I posted a few days ago titled “A Trader’s Guide to Buying the Dips”. This article presents a variation known as “Jay’s Pullback System”
First let’s look at the building blocks:
A = S&P 500 daily close
B = 10-day simple moving average of S&P 500 daily close
C = (A – B)
Buy Signal = Variable C declines for 3 or more consecutive days
In a nutshell, if the difference between the S&P 500 index (SPX) and its own 10-day moving average declines for 3 straight days we consider this to be a “pullback”, and thus a buying opportunity.
Trading Rules for Basic System:
When Variable C declines for 3 straight days, buy and hold the S&P 500 Index for 5 trading days. If the decline in Variable C extends itself one or more days, then extend the holding period for that many trading days.
So for example, if Variable C declined for 5 straight trading days, one would buy at the close of the third trading day and then hold for seven trading days
Day Variable C Action Position
1 Down
2 Down
3 Down Buy at close (hold for 5 days)
4 Down Hold (Var. C down again; hold for 5 days) Long
5 Down Hold (Var. C down again; hold for 5 days) Long
6 Up Hold (for 4 days) Long
7 Down Hold (for 3 days) Long
8 Up Hold (for 2 days) Long
9 Down Hold (for 1 day) Long
10 Up Sell at close Long; Flat at close
Figure 1 displays “bullish days for SPX in green. In the lower clip we see the difference between the close and the 10-day moving average (i.e., Variable C). A “bullish” period is signaled when that value declines for 3 straight days
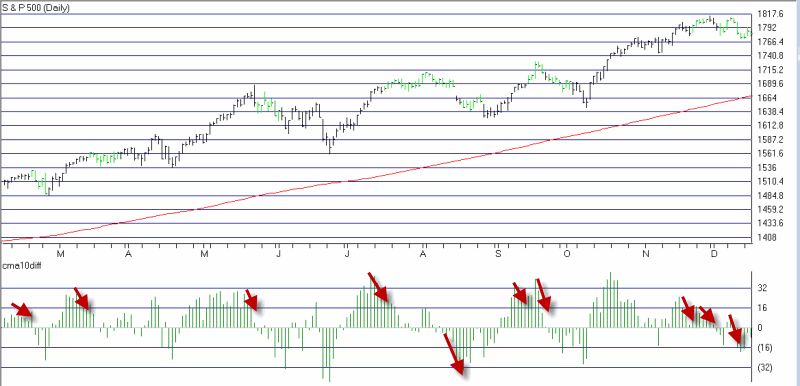 Figure 1 – Basic System bullish days for SPX (Courtesy AIQ TradingExpert)
Results:
This is a very rudimentary “system” and not suitable for many traders (note this raw system includes no stop-loss provision and does not attempt to filter for and trade with the major trend).
In any event, let’s look at what would have happened if one had followed the rules and held the S&P 500 for 5 trading days following every decline in Variable C of 3 days or more, and earned 1% of annual interest while out of the market. Those results are displayed (along with the growth of $1,000 achieved by buying and holding the S&P 500 Index) in Figure 2.
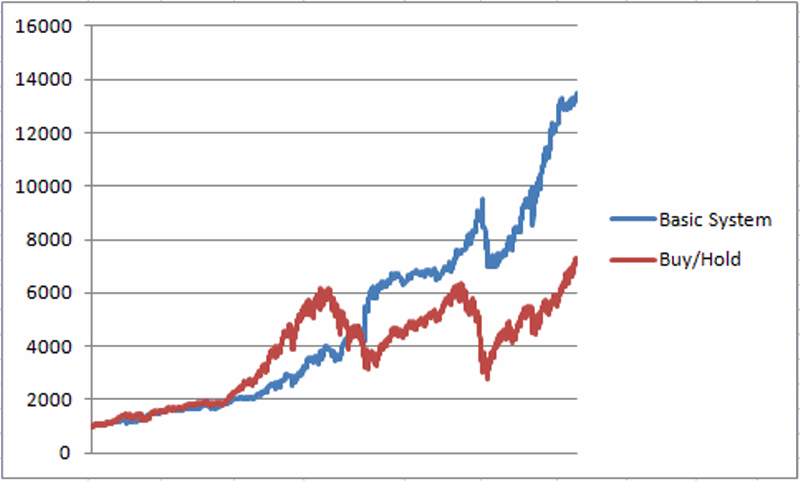 Figure 2 – Simple Pullback Systems (blue line) versus Buy and Hold (red line) Dec 1987 to present
Results:
-$1,000 invested using this system grew to $13,249 (+1,225%)
-$1,000 invested using buy-and-hold grew to $7,208 (+621%)
So we can reasonably state that these results are pretty good. Can they be improved? Let’s see.
Jay’s Pullback System
With this system we will filter for the trend and at times use leverage.
First we will note if the daily close for the S&P 500 Index is above or below its own 250-day moving average.
If Variable C above declines in value 3 straight days:
-If SPX > 250-day moving average we will buy using leverage of 2-to-1
-If SPX < 250-day moving average we will buy using no leverage
-Interest of 1% per year will be assumed when out of the market.
The results of this test appear in Figure 3.
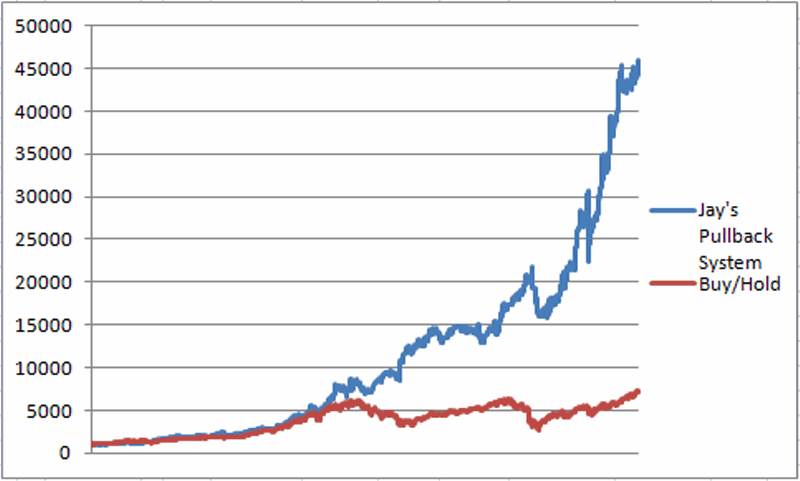 Figure 3 – Jay’s Pullback System: Growth of $1,000 (blue line) versus buy and hold (red line; Dec 1987-present
Results:
-$1,000 invested using Jay’s Pullback System grew to $44,541 (+4.354%)
-$1,000 invested using buy-and-hold grew to $7,208 (+621%)
Funds to Use
Mutual Fund: Profunds ticker BLPIX (S&P x 1)
Mutual Fund: Profunds ticker ULPIX (S&P x 2)
ETF: Ticker SPY (S&P 500 x 1)
ETF: Ticker SSO (S&P 500 x 2)
Summary
While the numbers for the leveraged system look pretty good, it should be noted that there are no stop-loss provisions incorporated. Before you decide to run off and trade any system – particularly one that may use leveraged funds or ETFs, you ought to do some homework and make sure you fully understand and can tolerate the risks involved.
Still, the real point of all of this is simply to note that buying on dips is a valid approach to trade the stocks markets.
Jay Kaeppel
Chief Market Analyst at JayOnTheMarkets.com and AIQ TradingExpert Pro (http://www.aiq.com) client
Jay has published four books on futures, option and stock trading. He was Head Trader for a CTA from 1995 through 2003. As a computer programmer, he co-developed trading software that was voted “Best Option Trading System” six consecutive years by readers of Technical Analysis of Stocks and Commodities magazine. A featured speaker and instructor at live and on-line trading seminars, he has authored over 30 articles in Technical Analysis of Stocks and Commodities magazine, Active Trader magazine, Futures & Options magazine and on-line at www.Investopedia.com.

 English