Jul 31, 2014 | chart patterns, Seasonality, swing trading, trading strategies, Uncategorized
It’s the beginning of the month and time to check the seasonal patterns for August 2014. First off some background.
Our study looks at 7 years of historical data and looks at the returns for all optionable stocks for the month of August from 2006 to 2013.
We filter to find two sets of criteria
– Stocks with gains in all 7 years during August
– Stocks with losses in all 7 years in August
We do make an assumption that the month is 21 trading days and work our way back from the last day of the month. If the last day of the month falls on a weekend, then we use the first trading day prior to that date.
We make no assumptions for drawdown, nor do we look at the fundamentals behind such a pattern. We do compare the stock to the market during the same period and look at the average SPY gain/loss vs. the average stock gain/loss. This helps filter out market influence. We are now including group information to identify particular segments that might display a seasonal bias.
Finally we look at the median gain/loss and look for statistical anomalies, like meteoric gains/loss in one year.
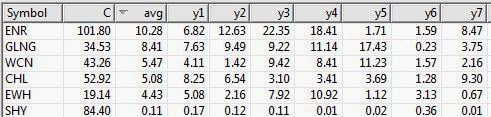
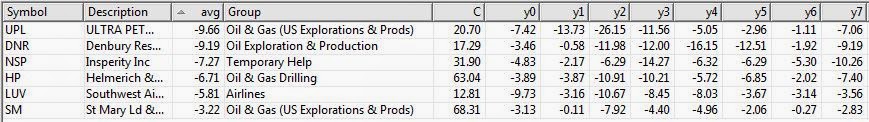
So here are the tickers that met the scan on the loss side, There was only 1 stock on the gainers side. So we’ll look at the down plays only.
Figure 1 shows the stocks that have had losses in August, 7 years in row.
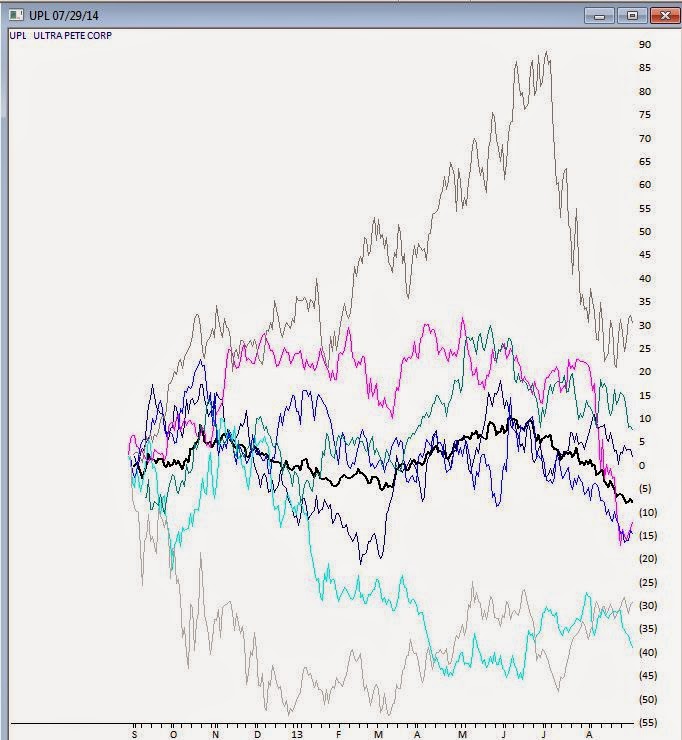
It’s almost immediately apparent that 4 of the 6 losers are in the Oil & Gas sector, one in the Drilling group, and 3 in Exploration and Production (2 US) groups. Not looking like a good month to be long this sector. The biggest loser is UPL, UltraPete Corp with an average -9.66% in August. A couple of years have seen significant losses in August, but the median is still -7.42%. Not being one to speculate on why the Oil & Gas sector has so many stocks taking a hit in August, but there it is. Here’s the seasonal chart of UPL through 8/31/2013, the prominent black line is the average of the 7 years in the study.
Figure 2 seasonal for UPL for last 7 years, average line in black
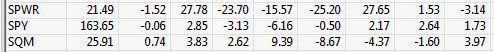
During the same period the market, as measured by SPY declined an average of -0.06, so there was no overriding market influence during this period.
Figure 3 shows SPY for the same period.
Interestingly a quick check of the Oil & Gas US Explorations and Production group for the same period revealed an average decline of -3.67% in August. The entire group was down 6 of the last 7 years in August. I have 38 stocks in this group in my database.
Figure 4 seasonal average for Oil & Gas US Explorations and Production group
We’ll keep track of the top 2 stocks in the August analysis. UPL and DNR and let you know how they preform.
In July, GLNG was the seasonal star with an average of +8.41% for the 7 years through July 30, 2013. Tracking how it performed this July, GLNG opened at 60.73 on July 1, 2014 and reached a high of 65 on July 30, 2014. Some pullback occurring on July 31, 2014 with the entire market down, but still a gain for the month.
Figure 5 shows the stocks that have had gains in July, 7 years in row.
With seasonality you have to figure out what timeframe you want to analyze before anything else. Logic would seem to dictate that one week; comparing this week to the same period over X years would be the smallest time period you might consider. However there are events that seem to be seasonally predictable that occur at the end of a month or the beginning of the month. We’ll look at some these in a future article.
We don’t draw conclusions here, just mine for information.
Apr 14, 2014 | Uncategorized
If there is one thing I have learned about trading over the years it is that there sure are a lot of ways to play. I mean there are literally thousands of stocks, bonds, funds, ETFs, options, FOREX, and so and so forth to choose from. From there a trader can analyze roughly a bazillion (give or take) different indicators, oscillators, trend following methods, fundamental factors, etc., etc.
No wonder people get confused and no wonder there is a tendency for a trader to “try” one method for “a while” and as soon as that one isn’t faring as well as something else they’ve heard about, well, that trader to move on to another method (you know who you are).
And then of course there are the pundits, you know wise guys like me who like to imply that they know everything there is to know about trading. And so traders sometimes feel compelled to listen to someone else if they assume that that person knows more about trading than them. The paradox here is that is that – as with any endeavor – it does make sense to listen people with more knowledge than you on given topic in order to learn things. But trading is a little trickier. So this seems like a good time to invoke:
Jay’s Trading Maxim #215: Whenever you hear someone say “In order to be successful in the markets you must……”, what they really should be saying is “In order for me to be successful in the market I must…..what you must do may be something completely different.”
In other words you need to take in a lot of information and then go through the painstaking process of stripping away about 90% of what you’ve been told and boil it down to just that which allows you to be successful. And whatever anyone else does is not relevant.
Buy the way it is not an easy process.
One other suggestion:
Jay’s Trading Maxim #218: Once you settle on a trading plan/method, DO NOT TINKER with it day in and day out. Revisit your trading plan/method a few times a year and see if you’ve learned anything that can add value. Otherwise “Trade, don’t Tinker.”
A Simple Signal
So all of that being said, I still can’t fight the urge to be a wise guy and offer up a simple “buy signal” using the Commodity Channel Index (or CCI). Now please not that there is no inference made that this is the “be all, end all” of trading. In fact, it really is only useful (I have found) for very short-term trading and for traders who are diligent about cutting losses. In other words if you have a recent history of buying something and then when it came time to cut a loss you said “Well, I’ll just give it a little while longer to see what happens”, then beware.
So any way here goes. If:
– SPY > 200-day moving average
– CCI drops to -90 or below and then turns up for one day
– then the next time SPY takes out the previous day’s high enter a long position
BUT WAIT! Before you even think about trying to use this idea note that you will need to develop some profit-taking and stop-loss criteria. One place to start would be to exit on the first profitable close. In other words, yes it can be that short-term in nature. If that is not your “cup of tea” you need to either, a) figure out a different way to use the idea, or b) ruthlessly discard it along with the 90% of ideas that you encounter that do you absolutely no good.
Again, there is no inference made that every new signal equates to “Happy Days are Here Again!” What I have described simply signals that maybe, just maybe the market will follow through at least a little bit to the upside. Do not read more into it than that.
In Figures 1 and 2 below, the green bars highlight days when CCI trend up from -90 or below while SPY was above its 200-day moving average. The red arrows highlight the next time SPY took out the previous day’s high. The key thing to note is that sometimes there is follow through and sometimes there is not.
It is how you deal with the “sometimes there is not” occasions that matters the most.
Figure 1 – SPY 2013-2014 (Courtesty: AIQ TradingExpert)
Figure 2 – SPY 2012 (Courtesty: AIQ TradingExpert)
Jay Kaeppel Chief Market Analyst at JayOnTheMarkets.com and AIQ TradingExpert Pro (http://www.aiq.com) client
Jay has published four books on futures, option and stock trading. He was Head Trader for a CTA from 1995 through 2003. As a computer programmer, he co-developed trading software that was voted “Best Option Trading System” six consecutive years by readers of Technical Analysis of Stocks and Commodities magazine. A featured speaker and instructor at live and on-line trading seminars, he has authored over 30 articles in Technical Analysis of Stocks and Commodities magazine, Active Trader magazine, Futures & Options magazine and on-line at www.Investopedia.com.
Mar 26, 2014 | Uncategorized
The AIQ code based on Perry Kaufman’s article in March 2014 Stocks & Commodities, “Timing The Market With Pairs Logic,” is provided at www.TradersEdgeSystems.com/traderstips.htm.
The code I am providing will backtest only the long trading and will not test the hedging portion of the system. For live trading, I provided a manual input for the total value of the open positions, which would have to be computed separately and then entered daily as an input before the daily report is run once the hedge rule becomes true.
!TIMING THE MARKET WITH PAIRS
!Author: Perry Kaufman, TASC March 2014
!Coded by: Richard Denning 1/7/2014
!www.TradersEdgeSystems.com
!INPUTS:
stoLen is 60.
idx is "NDX".
hedgeETF is "PSQ".
eLvl is 10.
xLvl is 50.
sLoss is 0.10.
hedgeLen is 60.
hedgeRatio is 0.50.
minP is 3.
invest is 5000.
totValOpenPos is 100000. !open position value must be set manually
H is [high].
L is [low].
C is [close].
O is [open].
idxH is tickerUDF(idx,H).
idxL is tickerUDF(idx,L).
idxC is tickerUDF(idx,C).
idxO is tickerUDF(idx,O).
hedgeC is tickerUDF(hedgeETF,C).
PEP is {position entry price}.
!STRESS CODE:
rngStk is highresult(H,stoLen) - lowresult(L,stoLen).
rngIdx is highresult(idxH,stoLen) - lowresult(idxL,stoLen).
stoStk is (C - lowresult(L,stoLen)) / rngStk.
stoIdx is (idxC - lowresult(idxL,stoLen)) / rngIdx.
stoDiff is stoStk - StoIdx.
rngDiff is highresult(stoDiff,stoLen) - lowresult(stoDiff,stoLen).
stressVal is ((stoDiff - lowresult(stoDiff,stoLen)) / rngDiff) * 100.
!PAIRS SYSTEM CODE:
Buy if C > minP and countof(C > minP,4,1)=4 and stressVal <= eLvl and symbol()<>hedgeETF.
StressExit if stressVal >= xLvl.
ExitBuy if countof(C > minP,5)<>5 or C/PEP-1 < -sLoss or StressExit.
!TREND CODE:
idxTrnd is simpleavg(idxC,hedgeLen).
Hedge if idxTrnd < valresult(idxTrnd,1) and symbol()=hedgeETF .
!SIZING CODE:
chgStk is C/valresult(C,1) - 1.
chgIdx is idxC/valresult(idxC,1) - 1.
idxSMA is simpleavg(idxC,hedgeLen).
size is floor(invest / C).
hedgeSize is floor(totValOpenPos / hedgeC*hedgeRatio) .
ShowAllValues if countof(C > minP,5)=5.
To get a correlated list of stocks that show good correlation to the index of choice (I used the NDX), AIQ has a matchmaker module that will quickly generate a list of stocks that show significant correlation to an index. In Figure 7, I show the matchmaker setup I used to quickly get a list of stocks in the NASDAQ 100 that were highly correlated to the NDX. In Figure 8, I show the results (part of which are hidden). After highlighting the ones desired for a list, simply click on the “data manager” button and a list is created, which is then used to run the tests.

FIGURE 7: AIQ, MATCHMAKER SETUP. Here is the setup used to get a list of stocks in the NASDAQ 100 that are highly correlated to the NDX.
FIGURE 8: AIQ, RESULTING LIST. Here are sample results of running the setup shown in Figure 7.
Mar 22, 2014 | Uncategorized
As I write the stock market is headed higher. As a trend-follower by nature (sorry it’s just my nature) I try to avoid sitting around and stewing in “The End is Near” type of thinking. For the record there is a lesson in that. Stop for a moment and think about all of the predictions of “the top” you have heard or read in roughly the last 17 months or so as the market has moved relentlessly higher (Thank you Fed – for now).
Those predictions all fall into one of three categories – Wrong, wrong or wrong.
Still, the phrase that “all good things got to come to an end” remains essentially a universal truth. My hope is that the major averages (and the majority of stocks) will break through to the upside and take out their recent highs and continue to power higher. But if this rally fails…………it might make sense to be prepared. Please note that I am not intending to imply that if the market fails to make new highs that Armageddon will ensue. But the market does appear to be losing some momentum (more on this topic in a moment). And once the “worm turns”, well, corrections tend to happen pretty quickly and at times pretty ferociously.
So my best advice at the moment is “enjoy the ride, but please take a moment to locate the nearest exit.”
Is The Market Losing Momentum?
Figure 1 displays the S&P 500 daily bar chart at the top with the 3-day RSI and the MACD (18/37/9) indicator at the bottom.
Figure 1 – RSI and MACD creating bearish divergence from SPX (Courtesy: AIQ TradingExpert)
Note that during the second half of 2013 as the S&P 500 moved higher both of the indicators confirmed the move. Since the first of this year both indicators have been forming a bearish divergence – i.e., price moves to a new high while the indicators do not. Now once again it should be noted that simple divergences happen from time to time and do not imply the end of the world as we know it. But they do flash a warning sign that alert traders should pay attention.
So there are two scenarios to watch for:
1) The S&P 500 index and other major average move to new highs and the indicators “stop diverging” and once again “start confirming” (This is “Good”).
2) The S&P 500 and other major average fail to make a new high or briefly reach new high ground and then reverse, while the indicators continue to signal weakness (This is “Bad”).
My advice is to pay close attention in the days and week ahead.
One Way to Play
This idea is merely “food for thought” and a little too soon to act upon in my opinion (i.e., the time to consider acting is if and when the market fails to follow through to a new high and the indicators remain weak). But if you want to consider a “cheap hedge” here is an example that uses the “Garbage Trade” I’ve written about (that I learned from Gustavo Guzman) of late.
The example trade displayed in Figure 2 involves:
Buying 1 June SPY 178 put option
Selling 2 June SPY 169 put options
Buying 1 June SPY 160 put options
At present prices this trade costs $67 to enter. If SPY got back down to about 181 this trade would generate an open profit in the range of 100%. If things actually did “fall apart” (again, not “predicting” just “preparing”) this trade would generate a profit of several hundred percent.
Again, not really a trade to make right now, but rather an idea to keep in the back of your mind, you know, just in case…..
Jay Kaeppel Chief Market Analyst at JayOnTheMarkets.com and AIQ TradingExpert Pro (http://www.aiq.com) client
Jay has published four books on futures, option and stock trading. He was Head Trader for a CTA from 1995 through 2003. As a computer programmer, he co-developed trading software that was voted “Best Option Trading System” six consecutive years by readers of Technical Analysis of Stocks and Commodities magazine. A featured speaker and instructor at live and on-line trading seminars, he has authored over 30 articles in Technical Analysis of Stocks and Commodities magazine, Active Trader magazine, Futures & Options magazine and on-line at www.Investopedia.com.
Mar 12, 2014 | Uncategorized
So you see what I was talking about, right? Under the category of “I hate it when I’m right”, last week I wrote “when I write an article about a trend that has been playing out time and time again over a several year period – that can pretty much be counted on to put an end to that trend”, referring to the fact that ticker VXX has been in a prolonged downtrend for a number of years.
Within minutes (or so it seems) the Russian Army is on the move. Coincidence? OK, probably so, but geez, maybe I should try picking tops and bottoms…
Anyway, in light of the newfound fear and loathing that popped back up over the weekend, it is time to review a useful strategy for traders concerned about the downside in the near term.
The Garbage Trade
Several years ago I learned a simple hedging strategy from Gustavo Guzman, a former colleague of mine. He dubbed it the “Garbage Trade”. But don’t be fooled by the name, for it is anything but.
Essentially a hedging strategy, the basic idea of this simple option strategy is to risk a little bit of capital on something that most people don’t think is going to happen. If it doesn’t happen, OK, you lose a little. But if it does happen, you make a whole lot.
One word of warning: for the “average” investor – one whose basic approach to investing is one of “buy a stock or mutual fund or ETF and hope it goes up” – this type of trading is quite a foreign concept. Of course, given the world we live in today, considering alternative ideas to investing and trading might be a good thing.
The Starting Point
The basic idea Guzman taught was that after a market (especially the stock market) had experienced a good run up, a pullback of some sort was invariably due. So his suggestion was after a run up, buy a put option roughly 5% out of the money. Then go down the strike prices until you find a put option that you can sell two of which will pay for the first put option you bought (example to follow). Then if you had gone down say three strike prices from the option you bought to the option you sold, then go down three more strike prices and buy one put at that price.
Right now all of the “non option junkies” have their fingers poised over the arrow to go back to the Main Web Page. But wait!! Please at least consider the example below.
Figure 1 – Ticker IWM tracking the Russell 2000 Index (Courtesy: AIQ TradingExpert)
In Figure 1 we see a bar chart for ticker IWM, an ETF that tracks the Russell 2000. Now let’s assume that a trader is concerned about the potential for a pullback – let’s say based on current geopolitical goings on – but not necessarily outright bearish. In other words, he doesn’t want to “Sell Everything!”, but would like some protection if things go south for a while.
In Figure 1 we can see that if IWM starts to decline there are several natural “price targets” where a trader might consider taking a profit. But I am getting ahead of myself.
Using Guzman’s outline for the Garbage Trade, one possibility is as follows:
-IWM shares are trading on 3/4/2014 at 120.32.
-If we multiply this by 0.95 we get 114.30
-We can choose either the 114 or the 115 strike price put. Due to higher volume I will select the May 115 put.
-In order to take in enough premium to pay for the 1115 put we would sell 2 May 109 puts for 1.13 each (or $113 x 2 = $226 premium taken in)
-We then go own six more point and buy one May 103 put for 0.60, or $61.
All told, it costs all of $55 to buy a 1 by 2 by 1 position. The risk curves for a 10-lot position costing $550 appears in Figures 2 and 3.
So basically, one of a couple things will happen. In a nutshell, either IWM will suffer a pullback and this position will offer the potential to make a fairly high return on capital, or the trader stands to lose a maximum of $560.
A couple of things to note:
*If IWM moves to new highs the trader can either:
a. Exit the trade and cut his loss
b. Continue to hold the position – at least for a while – just in case something bad happens later rather than sooner
*If IWM does start to decline then the trader should have a profit target in mind and should pay attention to the price level at which the risk curve for the latest date will “peak” and start to “roll back down.” Figure 1 displays several potentially useful “price target levels” where a trader might consider taking a full or partial profit.
Summary
As always, this example is not presented as a “recommendation”. It is simply an example of one way to get a little exposure to the downside if you start to feel some “concern.”
The vast majority of traders who look to options focus on buying calls and puts in hopes of maximizing a specific market timing method, and/or selling covered calls against stocks they hold. Nothing wrong with these ideas, but the real power of options is that they afford you the opportunity to “attempt” things you normally could not or would not do using stocks, ETFs or futures.
The Garbage Trade is an example of one way to use options to risk small amounts of capital with the potential for significant percentage gains.
As always this example is not a “recommendation”, only an example. Note that it would seem like an illogical time to put on a trade like this. The stock market has bounced back from the Russia/Ukraine crisis in one day and the current trend clearly remains to the upside.
For the record: At exactly the point when the Garbage Trade seems like a waste of money….is exactly the time to consider putting it on.
Jay Kaeppel Chief Market Analyst at JayOnTheMarkets.com and AIQ TradingExpert Pro (http://www.aiq.com) client
Jay has published four books on futures, option and stock trading. He was Head Trader for a CTA from 1995 through 2003. As a computer programmer, he co-developed trading software that was voted “Best Option Trading System” six consecutive years by readers of Technical Analysis of Stocks and Commodities magazine. A featured speaker and instructor at live and on-line trading seminars, he has authored over 30 articles in Technical Analysis of Stocks and Commodities magazine, Active Trader magazine, Futures & Options magazine and on-line at www.Investopedia.com.
Feb 28, 2014 | Uncategorized
Sometimes you can just tell when something is going to turn around? Like for instance, when I write an article about a trend that has been playing out time and time again over a several year period – that can pretty much be counted on to put an end to that trend (sorry for the paranoia, but as far as the markets go, it’s a “learned response”).
So with that word of warning in place, here goes.
The ETF ticker VXX is intended to track the widely followed VIX Index. And it does in a sense, expect that really it doesn’t. To better understand that seeming bit of gibberish simply glance at Figure 1. In the top clip you see the actual VIX Index. In the bottom clip you see the price action for ticker VXX.
Figure 1 – VIX Index versus the ETF Ticker VXX (Courtesy: AIQ TradingExpert)
Notice any difference? While VIX has been trending sideways for some time now, VXX has been in a steady decline for several years – with a series of upward “spikes” along the way. Now the reason for this is something known as “Contango” and has to do with the fact that ticker VXX holds futures contracts and the prices for the further out months is generally always higher than the nearer months, blah, blah, blah. Forgive my laziness, but for those with intellectual curiosity regarding contango may I suggest the following link:
www.google.com Then type in the word contango.
And don’t even get me started on “backwardation.”
As with any persistent trend that I might find in the markets, as a proud graduate of “The School of Whatever Works”, my interest – an all candor – is not so much in asking “Why”, but rather, “How Often” and “How Consistently.” So how does one take advantage of the downward bias built into VXX? Well, there are lot’s possibilities, but let’s look at one specific approach.
Whacking The VXX Mole
Basically the “theory” is that over the long run the downward bias in VXX will persist (with inevitable periods of strength. So the idea is simply that every time VXX “pops it’s head up”, we whack it and play the downside. The best way to do this – in my opinion – is with put options on VXX. The alternative is to sell short shares of VXX, but that involves unlimited risk, and potentially a lot of it – if something unexpectedly bad happens that affects the stock market, VXX is capable of shooting a great deal higher in a short period of time. Buying a put option on VXX at least insures limited risk.
One Way to Identify “Clobberin’ Time”
Just to make things needlessly complicated I am going to use something called “RSIAll”. RSIAll is simply the simple average of the 2-day RSI, the 3-day RSI and the 4-day RSI for ticker VXX. This indicator appears in the bottom clip in Figure 2.
So the play is simply this:
-When RSIAll rises to 80 or above (or some other value of your choosing)
-Look to sell short (i.e., buy put options on) VXX when it takes out the low of the previous two reading days.
Figure 2 displays several examples.
Figure 2 – Ticker VXX with several “Whack a VXX” opportunities highlighted (Courtesy: AIQ TradingExpert)
The other “key” is deciding when to get out. I am not going to address specifics in this article but there are many possibilities:
*First profitable close
*x-day RSI drops below y
*Some other indicator reaches oversold levels
*Etc.
Which Option to Buy
As far as which specific put option to buy, I am going to go with the “there is not necessarily one best option to trade” answer. Different traders have different levels of aggressiveness and risk tolerance when it comes to choosing trades. In general the shorter-term the option the greater the potential if you are exactly correct in your timing, but the more quickly you can lose money if the VXX goes sideways to higher for a while. So as a rule of thumb I would say it is better to consider options with a minimum of 30 days left until expiration. Beyond that, the basic choices are:
1) The lowest “Percent to Double”: This calculation measures how far the underlying must move in order for the option to double in price. This typically involves buying out-of-the-money options and is considered more of a “high risk, high reward” choice compared to the other choices that follow.
2) The highest “Gamma”: For people who don’t know the option “Greeks”, it can be boiled down pretty simply. “Delta” tells you how much the option should move if the underlying moves $1 in price. So a “Delta” of 50 means that if the underlying security moves $1 in price the option will move (roughly) fifty cents.
“Gamma” tell you how much the “Delta” will change if the underlying moves $1 in price. In more general terms “Gamma” can guide you to options with the most immediate “bang for the buck.”
3) Deep-in-the-money puts: This choice offers the least leverage but also limits the negative effect of time decay (because there simply isn’t much time premium built into the option price) and can start making money point-for-point with the underlying fairly quickly.
Summary
Now that I have planted the idea that playing the short side of VXX is a good idea I would not be surprised to see some unforeseen event cause volatility to trend sharply higher in the not too distant future. But remember, the purpose of this article is not to compel you to “take the next trade”, but to identify and consider opportunities that may occur on a fairly consistent basis into the future.
Jay Kaeppel Chief Market Analyst at JayOnTheMarkets.com and AIQ TradingExpert Pro (http://www.aiq.com) client
Jay has published four books on futures, option and stock trading. He was Head Trader for a CTA from 1995 through 2003. As a computer programmer, he co-developed trading software that was voted “Best Option Trading System” six consecutive years by readers of Technical Analysis of Stocks and Commodities magazine. A featured speaker and instructor at live and on-line trading seminars, he has authored over 30 articles in Technical Analysis of Stocks and Commodities magazine, Active Trader magazine, Futures & Options magazine and on-line at www.Investopedia.com.