May 15, 2014 | bonds, ETFs, group sector rotation, trading strategies
…and down will come, well just about everything, as far as I can tell.
OK, for the record maybe it should say “If the Dow Breaks.” After all I am still firmly ensconced here at “Camp Bull.” I would like to attribute this to disciplined nerves of steel, but it would be an understatement to say that that would be an overstatement. The truth is my crystal ball broke a very long time ago (sadly I continued believing what it portended for a long time before I realized it was actually broken). So I have long since held dual citizenship in “Camp Trend Follower”.
But I have got be honest…..I am feeling the urge to run like a sissy through the woods to “Camp Yikes”.
The Overall Market
Defining the “overall” market is something of a crapshoot these days, as some of the “overall” market seems to be going one way and another part of the “overall” market seems to be going another way. In Figure 1 we see the Dow, the S&P 500, the Nasdaq 100 and the Russell 2000.
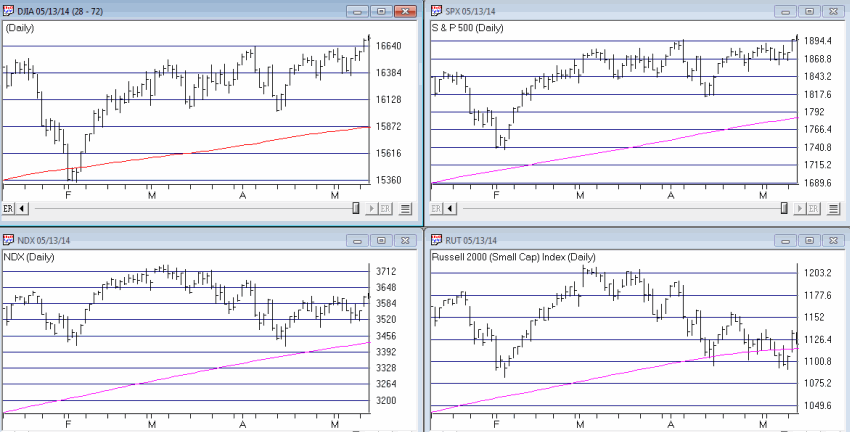
Figure 1 – The Four Major Averages with 200-day moving averages (charts courtesy AIQ TradingExpert Pro)
In a nutshell, the “Generals” are still marching but the “Troops” are in retreat. Now every market pundit seems to be offering up their opinion as to whether the “Generals” will ultimately lead the troops higher or the other way around. With my crystal ball still out of order I must unfortunately go with my stock answer here of “it beats the heck out me.” And “hey things are swell here at Camp Bull.” But I have been around this business long enough to remember several instance where the “Troops” led the way (1984, 1987, 1990, 2000, 2008) and the “Generals” followed. So we’ll see what we see.
OK, just in case that little segment was not foreboding enough, let’s get to the really “scary” part.
Sectors Suck in Summer (during Mid-term years)
One caveat before I even launch, the sample size of what I am about to detail is very small (6 calendar years each four years apart starting in 1990). Also, that’s the good news. As a “seasonalaholic” (“Hi, my name is Jay”) I am acutely aware of the following facts:
1. The market tends to perform better between the end of October and the third trading day of the following May than it does from the third trading day of May through the end of October (also known as “Where We Are Now.”)
2. This is a mid-term election year.
I also do a lot of work with sectors and sector funds as I have found that investing at the right sector at the right time is – all kidding aside – one heck of a great way to invest.
So I was curious as to which sectors tended to perform the best during the May to October period during mid-term election years. Here is the short list:
Health Care. Period.
Everything else. Well on a buy in May and sell in October basis – let’s just say it isn’t pretty. So here is the test I ran:
Tracking the growth of $1,000 invested in each Fidelity Select Sector fund only:
*Between the close of May trading day 3 and the end of September (for the record, October tends to be an OK month during mid-term election years – more on this topic in a future article) during each mid-term election year.
The results appear below in Figure 2. If you are squimish you might want to brace yourself.
|
Fund
|
%+(-)
|
|
FBIOX
|
(12.1)
|
|
FBMPX
|
(34.5)
|
|
FBSOX
|
(36.9)
|
|
FCYIX
|
(28.8)
|
|
FDCPX
|
(42.4)
|
|
FDFAX
|
(3.7)
|
|
FDLSX
|
(45.9)
|
|
FIDSX
|
(55.9)
|
|
FNARX
|
(35.4)
|
|
FPHAX
|
(18.6)
|
|
FSAGX
|
(1.6)
|
|
FSAIX
|
(65.7)
|
|
FSAVX
|
(71.4)
|
|
FSCGX
|
(58.9)
|
|
FSCHX
|
(49.7)
|
|
FSCPX
|
(31.2)
|
|
FSCSX
|
(35.9)
|
|
FSDAX
|
(62.7)
|
|
FSDCX
|
(38.2)
|
|
FSDPX
|
(57.5)
|
|
FSELX
|
(71.0)
|
|
FSENX
|
(42.9)
|
|
FSESX
|
(65.3)
|
|
FSHCX
|
(20.1)
|
|
FSHOX
|
(79.1)
|
|
FSLBX
|
(59.1)
|
|
FSLEX
|
(49.6)
|
|
FSMEX
|
(12.0)
|
|
FSNGX
|
(47.5)
|
|
FSPCX
|
(27.2)
|
|
FSPHX
|
41.6
|
|
FSPTX
|
(42.0)
|
|
FSRBX
|
(59.5)
|
|
FRESX
|
(26.4)
|
|
FSRFX
|
(61.2)
|
|
FSRPX
|
(43.8)
|
|
FSTCX
|
(35.4)
|
|
FSUTX
|
(12.1)
|
|
FSVLX
|
(59.1)
|
|
FWRLX
|
(32.8)
|
|
FNARX
|
(35.4)
|
Figure 2 – Net %+(-) invested only between 3rd trading day of May and last trading day of September during mid-term election years (1990 , 1994, 1998, 2002, 2006, 2010, 2014)
Anyone notice a trend? To see just how bad things can be, once you are able to work yourself back up out of the fetus position, take a glance at Figure 3, which shows the three worst performers during the May-Sep mid-term year period – FSAIX (-71%), FSELX (-71%) and FSHOX (-79%).
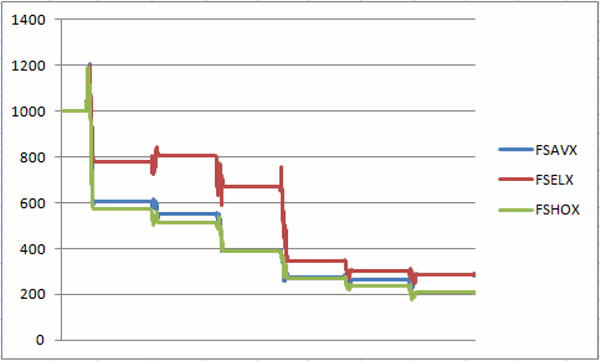
Figure 3 – FSAIX, FSELX, FSHOX – growth of $1,000 May through Sep of mid-term election years (1988-present)
Now I have an obvious flare for the obvious (which I think should be pretty obvious – also I tend to repeat myself) but I am not even going to comment on Figures 2 and 3.
The Good News
The one mistake you should not make based on looking at these numbers and charts is to assume that it is not possible to make money in sector funds between May and September of mid-term years. It just requires something better than a buy and hold approach. Several momentum systems and seasonal plays that I have developed over the years have still managed to show some pretty good gains historically “among the ruins” of midterm election summer months.
But if you’re gonna play, you’d better bring your “A” game.
Summary
Repeating now – I am still in “Camp Bullish.” And ideally I’d like to spend the summer. There seems to be a lot of fear and loathing among the “crowd” that I follow regarding the stock market. Typically that’s a good thing and suggests that the stock market just might surprise everyone this time around. And I hope that it does.
But I will be keeping a pretty close eye on my “camp mates” in the days and week ahead. Any sign of “trouble” (i.e., Dow, S&P breaking below 200-day moving averages) and they are going to have to send a search party out to find me……
Jay Kaeppel
Chief Market Analyst at JayOnTheMarkets.com and AIQ TradingExpert Pro (http://www.aiq.com) client
Jay has published four books on futures, option and stock trading. He was Head Trader for a CTA from 1995 through 2003. As a computer programmer, he co-developed trading software that was voted “Best Option Trading System” six consecutive years by readers of Technical Analysis of Stocks and Commodities magazine. A featured speaker and instructor at live and on-line trading seminars, he has authored over 30 articles in Technical Analysis of Stocks and Commodities magazine, Active Trader magazine, Futures & Options magazine and on-line at www.Investopedia.com.
Nov 19, 2013 | ETFs, options, Seasonality
AIQ Opening bell contributor and TradingExpert Pro client, jay Kaeppel has a FREE webinar in association with the Market Technicians Association. details are below
On Wednesday, November 20th, 2013, the MTA’s Educational Web Series continues with another free educational webcast event at 12 PM Eastern / 9 AM Pacific. This week, we will feature…
“Finding Exceptional Opportunities with ETFs, Options, & Seasonal Trends”
with Jay Kaeppel
With all of the trading vehicles and great opportunities now available, there has never been a better time to be a trader. The key to success is to identify and take advantage of exceptional opportunities. In this fast-paced session, market veteran and author Jay Kaeppel reveals a handful of unique trading methods that you have likely never considered. Each method details a simple, objective and highly effective plan of action. Take a journey off the beaten path and discover simple trading strategies designed to succeed in the long run.
the link howver will not be live until 11/20/2013
Nov 1, 2013 | ETFs, trading strategies
A lot of U.S investors have come to realize in recent years that there are many trading opportunities outside the USA. This creates something of a bad news, good news, bad news, good news situation.
-The bad news is that picking individual stocks is never an easy thing even if you focus only on domestic U.S. companies. For the average investor to successfully pick and choose among individual stocks around the globe is simply too much to expect.
-The good news is that the proliferation of international ETFs – Single country funds, regional funds, global funds, etc. – has made it much easier for investors to diversify across the globe than it used to be.
-The bad news is that the proliferation of ETFs has also reached a point where choosing an international ETF is getting to be almost as confusing as choosing a phone plan.
-The good news is that there are ways to simplify and systematize things.
So let’s take a look at “one way” to play the international stocks game.
BRIC vs. SPX
BRIC refers to an index comprised of stocks from Brazil, Russia, India and China. For the purposes of this article I will demonstrate a simple method for switching between BRIC and the S&P 500 Index.
The Vehicles:
For calculating switches I will use:
1) An index I created using AIQ TradingExpert. I refer to it as BRICINDX and it is comprised of single-country ETF tickers EWZ (Brazil), RSX (Russia), INP (India) and FXI (China).
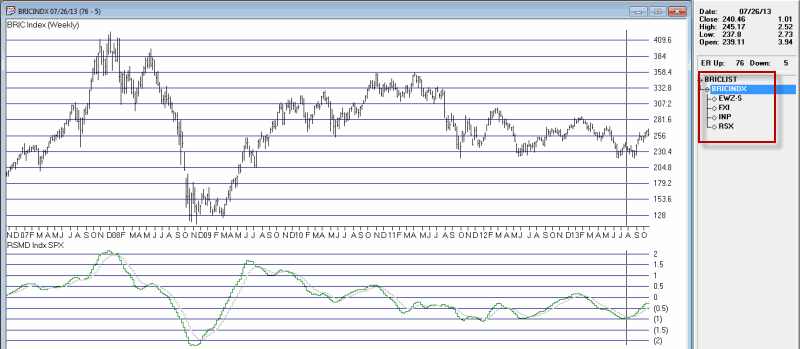
Figure 1 – Jay’s BRICINDEX
2) Ticker SPX (i.e., the S&P 50 Index)
For actual trading purposes there are a few choices that I will discuss a little later.
The Method:
I will use a method I learned a long time ago from David Vomund, President of Vomund Investment Management, LLC and the author of “ETF Strategies Revealed.” The measure calculates the relative strength between two assets on a weekly basis. When the trend of relative strength reverses in a particular direction for two consecutive weeks it signals a switch into the stronger index.
The Test:
We start our test on 10/26/01 simple because that is the first time we can get a good reading using back data. Each week we look at the relative strength of my BRICINDX versus the S&P 500 Index (ticker SPX). If the RSMD rises for two consecutive weeks we want to switch into the BRICINDX and if the RSMD declines for two consecutive weeks we want to switch into the S&P 500 Index.
Figure 2 displays the switches over the past several years.
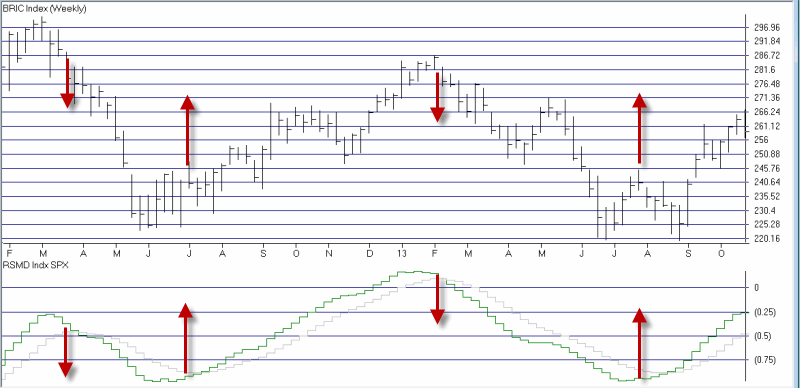
Figure 2 – BRICINDEX (vs. SPX; lower clip)
When an “Up” arrow occurs in Figure 2, the system switches into BRICINDX, when a “Down” arrow occurs in Figure 2 the system switches into ticker SPY. The results of this “System” are displayed in Figure 3. Note the two columns at the far right:
Switch: The growth of $1,000 using the system
Split: The growth of $1,000 split evenly between BRICINDX and SPY.
|
|
|
BRIC |
SPY |
Switch |
Split |
Switch |
Split |
| Date |
Date |
Index |
%+(-) |
%+(-) |
%+(-) |
%+(-) |
$1,000 |
$1,000 |
| 10/26/01 |
2/8/02 |
BRIC |
20.9 |
3.7 |
20.9 |
12.3 |
1,209 |
1,123 |
| 2/8/02 |
2/22/02 |
SPY |
13.9 |
0.0 |
0.0 |
7.0 |
1,209 |
1,201 |
| 2/22/02 |
5/10/02 |
BRIC |
(12.6) |
(3.2) |
(12.6) |
(7.9) |
1,057 |
1,106 |
| 5/10/02 |
7/19/02 |
SPY |
(25.0) |
(23.8) |
(23.8) |
(24.4) |
806 |
837 |
| 7/19/02 |
8/2/02 |
BRIC |
(14.1) |
1.9 |
(14.1) |
(6.1) |
692 |
786 |
| 8/2/02 |
11/1/02 |
SPY |
(0.8) |
8.8 |
8.8 |
4.0 |
753 |
817 |
| 11/1/02 |
6/27/03 |
BRIC |
45.0 |
7.1 |
45.0 |
26.0 |
1,091 |
1,030 |
| 6/27/03 |
8/29/03 |
SPY |
18.3 |
5.3 |
5.3 |
11.8 |
1,000 |
1,000 |
| 8/29/03 |
11/14/03 |
BRIC |
10.9 |
2.1 |
10.9 |
6.5 |
1,109 |
1,065 |
| 11/14/03 |
12/12/03 |
SPY |
11.9 |
2.5 |
2.5 |
7.2 |
1,137 |
1,142 |
| 12/12/03 |
1/23/04 |
BRIC |
16.4 |
7.7 |
16.4 |
12.1 |
1,324 |
1,280 |
| 1/23/04 |
7/2/04 |
SPY |
(18.5) |
(3.4) |
(3.4) |
(10.9) |
1,279 |
1,140 |
| 7/2/04 |
11/5/04 |
BRIC |
29.0 |
4.7 |
29.0 |
16.8 |
1,650 |
1,331 |
| 11/5/04 |
12/3/04 |
SPY |
9.0 |
1.8 |
1.8 |
5.4 |
1,679 |
1,403 |
| 12/3/04 |
12/31/04 |
BRIC |
(0.2) |
0.9 |
(0.2) |
0.3 |
1,675 |
1,408 |
| 12/31/04 |
2/11/05 |
SPY |
5.4 |
0.3 |
0.3 |
2.9 |
1,681 |
1,449 |
| 2/11/05 |
3/25/05 |
BRIC |
(4.3) |
(2.8) |
(4.3) |
(3.5) |
1,609 |
1,398 |
| 3/25/05 |
7/1/05 |
SPY |
8.1 |
2.7 |
2.7 |
5.4 |
1,653 |
1,473 |
| 7/1/05 |
10/21/05 |
BRIC |
13.9 |
(0.4) |
13.9 |
6.7 |
1,882 |
1,572 |
| 10/21/05 |
1/13/06 |
SPY |
18.3 |
7.6 |
7.6 |
12.9 |
2,024 |
1,776 |
| 1/13/06 |
3/17/06 |
BRIC |
9.6 |
1.6 |
9.6 |
5.6 |
2,219 |
1,876 |
| 3/17/06 |
4/28/06 |
SPY |
9.0 |
(0.0) |
(0.0) |
4.5 |
2,219 |
1,961 |
| 4/28/06 |
5/26/06 |
BRIC |
(13.5) |
(3.3) |
(13.5) |
(8.4) |
1,920 |
1,796 |
| 5/26/06 |
8/4/06 |
SPY |
9.2 |
1.5 |
1.5 |
5.4 |
1,948 |
1,892 |
| 8/4/06 |
9/1/06 |
BRIC |
2.1 |
2.9 |
2.1 |
2.5 |
1,988 |
1,939 |
| 9/1/06 |
10/20/06 |
SPY |
4.2 |
4.4 |
4.4 |
4.3 |
2,076 |
2,023 |
| 10/20/06 |
2/16/07 |
BRIC |
23.4 |
6.2 |
23.4 |
14.8 |
2,561 |
2,322 |
| 2/16/07 |
4/13/07 |
SPY |
5.2 |
0.5 |
0.5 |
2.8 |
2,573 |
2,387 |
| 4/13/07 |
8/17/07 |
BRIC |
5.0 |
(1.4) |
5.0 |
1.8 |
2,700 |
2,430 |
| 8/17/07 |
9/7/07 |
SPY |
11.2 |
0.8 |
0.8 |
6.0 |
2,722 |
2,576 |
| 9/7/07 |
12/21/07 |
BRIC |
35.8 |
2.4 |
35.8 |
19.1 |
3,696 |
3,067 |
| 12/21/07 |
4/25/08 |
SPY |
(9.3) |
(6.4) |
(6.4) |
(7.9) |
3,458 |
2,826 |
| 4/25/08 |
6/13/08 |
BRIC |
(3.0) |
(2.4) |
(3.0) |
(2.7) |
3,353 |
2,749 |
| 6/13/08 |
12/5/08 |
SPY |
(57.0) |
(35.5) |
(35.5) |
(46.2) |
2,164 |
1,478 |
| 12/5/08 |
6/26/09 |
BRIC |
53.1 |
5.4 |
53.1 |
29.3 |
3,314 |
1,911 |
| 6/26/09 |
10/2/09 |
SPY |
20.4 |
12.2 |
12.2 |
16.3 |
3,719 |
2,223 |
| 10/2/09 |
11/6/09 |
BRIC |
9.6 |
5.3 |
9.6 |
7.5 |
4,076 |
2,388 |
| 11/6/09 |
4/9/10 |
SPY |
5.6 |
9.3 |
9.3 |
7.5 |
4,454 |
2,567 |
| 4/9/10 |
4/23/10 |
BRIC |
(2.0) |
1.3 |
(2.0) |
(0.3) |
4,365 |
2,558 |
| 4/23/10 |
6/18/10 |
SPY |
(6.2) |
(8.2) |
(8.2) |
(7.2) |
4,008 |
2,374 |
| 6/18/10 |
11/19/10 |
BRIC |
11.7 |
7.9 |
11.7 |
9.8 |
4,475 |
2,606 |
| 11/19/10 |
3/11/11 |
SPY |
(0.1) |
8.2 |
8.2 |
4.0 |
4,843 |
2,712 |
| 3/11/11 |
5/6/11 |
BRIC |
(0.4) |
3.6 |
(0.4) |
1.6 |
4,823 |
2,755 |
| 5/6/11 |
6/10/11 |
SPY |
(1.9) |
(5.2) |
(5.2) |
(3.6) |
4,571 |
2,656 |
| 6/10/11 |
7/15/11 |
BRIC |
(1.7) |
2.3 |
(1.7) |
0.3 |
4,494 |
2,664 |
| 7/15/11 |
11/4/11 |
SPY |
(11.7) |
(3.3) |
(3.3) |
(7.5) |
4,344 |
2,463 |
| 11/4/11 |
12/16/11 |
BRIC |
(15.3) |
(4.7) |
(15.3) |
(10.0) |
3,678 |
2,216 |
| 12/16/11 |
1/20/12 |
SPY |
16.0 |
9.4 |
9.4 |
12.7 |
4,024 |
2,497 |
| 1/20/12 |
3/23/12 |
BRIC |
2.4 |
7.6 |
2.4 |
5.0 |
4,121 |
2,623 |
| 3/23/12 |
7/6/12 |
SPY |
(15.3) |
(4.4) |
(4.4) |
(9.9) |
3,938 |
2,363 |
| 7/6/12 |
2/1/13 |
BRIC |
17.5 |
10.5 |
17.5 |
14.0 |
4,628 |
2,694 |
| 2/1/13 |
7/26/13 |
SPY |
(15.2) |
12.7 |
12.7 |
(1.3) |
5,216 |
2,660 |
| 7/26/13 |
|
BRIC |
13.1 |
4.4 |
13.1 |
8.8 |
5,900 |
2,893 |
Figure 3 – BRICINDX vs. SPY
Figure 4 displays the trade-by-trade result in graphical form.
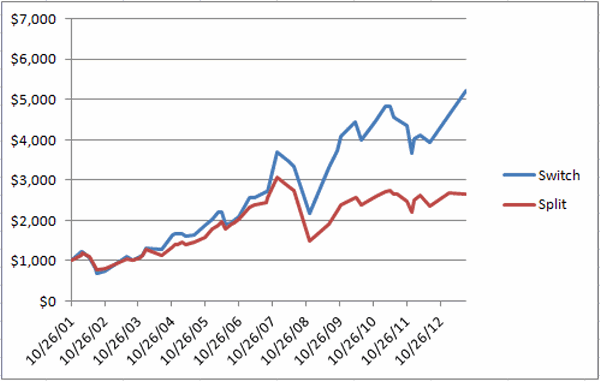
Figure 4 – Jay’s BRIC/SPY System (blue line) versus Split/Buy-and-Hold
A Few Performance Notes
-An investor who had split $1,000 between BRICINDX and SPY in 2001 would now have $2,893, a gain of 189.3%
-An investor who had utilized this switching system starting with $1000 in 2001 would now have $5,900, a gain of 490%.
So you clearly see the potential long-term benefit.
-Long-term is the key phrase. While the system clearly outperformed over time, over any trade or series of trades there is no guarantee that that will be the case.
-One other thing to note is that this particular system is allows long the stock market, either foreign or domestic. This means that if there is a global bear market (such as 2008) this system will suffer. Therefore, aggressive investors might consider building in some sort of market timing in order to avoid some of the downside.
A Few Trading Notes
For actual trading purposes a trader can emulate my BRICINDEX by splitting money between the four ETFs that comprise the index. There are other, easier alternatives including:
-Ticker VWO: Vanguard Emerging Markets ETF does not track these four funds exactly but has a correlation of roughly 97% with the BRICINDX and enjoys active trading volume.
-Ticker BKF: iShares BRIC Index Fund is the fund most closely correlated to my BRICINDX, however, trading is very thin.
-Ticker DXELX: This is the Direxion 2x leveraged Emerging Markets open end mutual fund. The leverage creates more profit potential (with commensurate downside risk) and this is a good choice for someone who would rather trade a standard mutual fund than an ETF.
-Ticker EDC: I am leery of 3x leveraged ETFs, but someone looking to “go for the gusto”, -Direxion Emerging Markets 3x ETF offers a lot of upside potential (but also a great deal of downside risk)
Summary
The “system” I’ve detailed here isn’t necessarily something that you should rush out and start trading right this very minute. Still, it does illustrate a few things:
-It is possible to “beat the market” (in this case, the “market” is defined as a portfolio evenly split between foreign and domestic stock indexes) over time using a mechanical approach.
-It is possible to profit from global stock market trends without becoming an expert in Chinese stocks or Russian stocks (or whatever country’s stocks).
-Demonstrating the discipline to follow an objective approach to investing is one of the keys to long-term success.
All in all it’s just another, well, you can sing the rest of it yourself……
Jay Kaeppel
Chief Market Analyst at JayOnTheMarkets.com and AIQ TradingExpert Pro (http://aiq.com) client
Jay has published four books on futures, option and stock trading. He was Head Trader for a CTA from 1995 through 2003. As a computer programmer, he co-developed trading software that was voted “Best Option Trading System” six consecutive years by readers of Technical Analysis of Stocks and Commodities magazine. A featured speaker and instructor at live and on-line trading seminars, he has authored over 30 articles in Technical Analysis of Stocks and Commodities magazine, Active Trader magazine, Futures & Options magazine and on-line at www.Investopedia.com.
Oct 21, 2013 | ETFs, group sector rotation, Seasonality, sector funds, trading strategies
The Stock Trader’s Almanac, put out each year by the Hirsch Organization, is one of my favorite publications. Interesting ideas are one thing. Interesting ideas that actually work are entirely something else. And the Almanac is chock full of just that.
Of course, some of us are not content to leave well enough alone (Hi, my name is Jay). One system that I follow involves using the Almanac’s “Nasdaq’s Best Eight Months Strategy” with MACD Timing. However, instead of buying a stock index I focus on the top performing Fidelity Select Sector Funds.
The method works like this:
-Starting on October first, track the action of the MACD indicator for the Nasdaq Composite Index using MACD parameter values of 8/17/9.
-When the fast line crosses above the slow line – or if the fast line is already above the slow line on 10/1, a buy signal occurs.
Figure 1 displays the most recent buy signal which occurred at the close on 10/15/13.
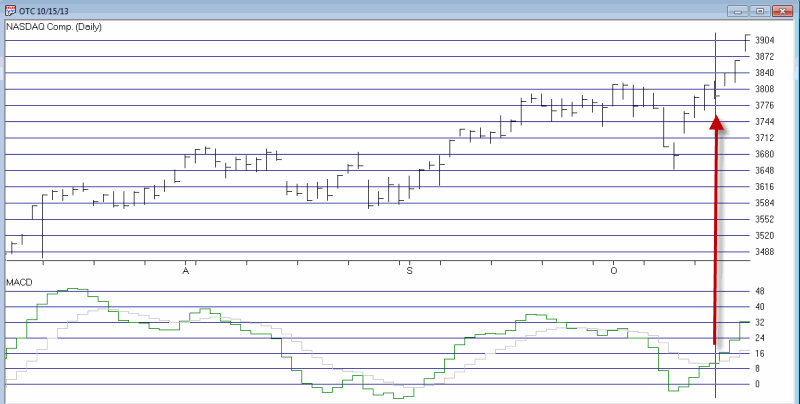
Figure 1 – MACD Buy Signal (Chart courtesy of AIQ TradingExpert)
-Then find the five top Fidelity Select sector funds.
There are a number of different ways to do this. The method I use is to run AIQ TradingExpert Relative Strength report over the past 240 trading days. This routine looks at the performance of each fund over 240 trading days but gives extra weight to the most recent 120 days. You can use different variables, or you can simply look at raw price change over the previous 6 months to come up with a list of “Top Select Sector Performers.” The list for 10/15/13 appears in Figure 2.
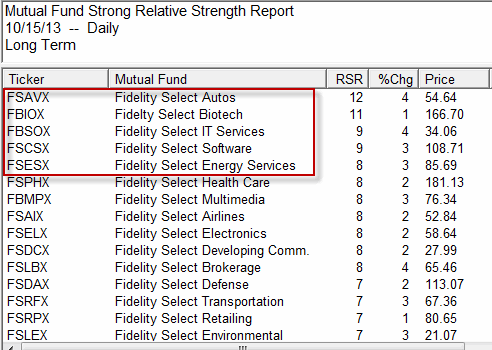
Figure 2 – High Relative Fidelity Select Sector Funds (Courtesy AIQ TradingExpert)
-Buy the top five Select Sector funds the next day.
-Starting on June 1st of the next year, track the action off the MACD indicator for the Nasdaq Composite Index using MACD parameter values of 12/25/9.
When the fast line crosses below the slow line – or if the fast line is already above the slow line on 6/1, then sell the Fidelity Select sector funds on the next trading day.
Repeat.
Results
The test period used here starts in October of 1998. The year-by-year results of this system during the Favorable eight month period versus the performance of the S&P 500 Index during the same time appears in Figure 3.
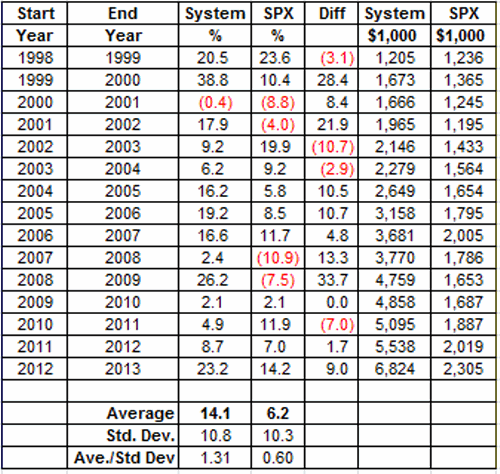
Figure 3 – Year-By-Year Bullish Eight Months (System vs. SPX)
|
Measure
|
System
|
S&P 500 Index
|
|
Number of times UP
|
14 (93%)
|
11 (73%)
|
|
Number Times Down
|
1(7%)
|
4 (27%)
|
|
Number time better performer
|
11
|
4
|
|
Average % +(-)
|
+14.1%
|
+6.2%
|
|
Worst %+(-)
|
(-0.8%)
|
(-10.9%)
|
Figure 4 – System versus S&P 500 during “Bullish Eight Months”
Summary
As you can see, this relatively simple system has registered a gain in 14 of the past 15 “bullish” eight month periods. On average it has outperformed the S&P 500 by a factor of 2.27-to-1.
So does any of this mean that a portfolio of FSAVX/FBIOX/FBSOX/FSCSX/FSESX is sure to make money and outperform the S&P 500 between now and June of 2014? Sadly, no.
I guess I’ll just have to take my chances.
Jay Kaeppel
Chief Market Analyst at JayOnTheMarkets.com and AIQ TradingExpert Pro client
http://jayonthemarkets.com/
Jay has published four books on futures, option and stock trading. He was Head Trader for a CTA from 1995 through 2003. As a computer programmer, he co-developed trading software that was voted “Best Option Trading System” six consecutive years by readers of Technical Analysis of Stocks and Commodities magazine. A featured speaker and instructor at live and on-line trading seminars, he has authored over 30 articles in Technical Analysis of Stocks and Commodities magazine, Active Trader magazine, Futures & Options magazine and on-line at www.Investopedia.com.
Apr 7, 2010 | ETFs, indicators, trading strategies
The market has been in a tight trading range for two weeks.
When the market is in a tight range most stocks do not move much
if they hit their trigger points so as noted in previous Letters,
tight ranges like this are best left alone. Trying to force trades
when the market is in a tight range will generally just churn the
account. These tight ranges do not last long, and are often followed
by nice tradable moves. When the market moves out of the range, I
will be actively trading in the direction of the break.
When the market is resting in a narrow trading range, instead of
swing trading I spend some time reviewing lessons I have learned
during the last twenty years. Some of the important ones are:
• There is no magic to trading. It is about putting the odds on
your side and not trading unless they are. This sounds simple,
but it takes a few years to get good at it. And like most things,
while you are learning it is best to work with someone. The
learning time is long because traders have to see how things
behave in different markets, and learn to trade the odds and
not their feelings. Read this paragraph again.
• The market will not adapt to us, we must adapt to it. Swing
trading in a trading range environment presents higher than
average risk. Traders can compensate for higher risk market
conditions by trading fewer positions and using smaller position
sizes. Failure to do this can be costly.
* Successful traders adjust their trading style, trading system,
holding Period, and exit strategies based on the current market
conditions. This is a process I refer to as market adaptive
trading. It is better to Learn how to adapt to the market rather
than running from one trading idea to the next looking for the
next super system. Being frustrated that the market is not doing
not what you want often leads to losses. The market does what
it wants, we just need to adapt to it. This will take time to learn,
be patient. Read this paragraph again.
* As a trader I do not care which way the market moves, I can
make money either way. It is important to be able to quickly
react to whatever the market does and not be emotionally
attached to any particular choice.
* I cannot control what the market does, so I have a plan for
whichever path it picks and then trade the plan.
* Successful trading is not about predicting what the market is
going to do. It is about knowing how to react to whatever it
actually does.
* Always be thinking about taking and protecting profits.
* If you are not sure what to do, exit the position. There will be
other good setups.
* You do not need to trade every day. Let the setups come to you
and take the best ones. When the market is moving there lots
of good setups to trade. If there are few setups, or most are
failing, then listen to the message of the market.
* Do not rush in, there is plenty of time to get into a
tradable move when the market changes. If a trend
is worth trading, then by definition you do not have
to be in on the first day.
* Never enter a position without a plan for exiting.
* Do not count your chickens before they hatch. You do not
have a profit until you are back in cash.
* Never trade with money you cannot afford to lose.
* Trading is not a team sport. Stay away from chat rooms and
financial TV. Seek the truth, not support from others with
your point of view.
Steve Palmquist a full time trader who invests his own money in the market every day. He has shared trading techniques and systems at seminars across the country; presented at the Traders Expo, and published articles in Stocks & Commodities, Traders-Journal, The Opening Bell, and Working Money. Steve is the author of, “Money-Making Candlestick Patterns, Backtested for Proven Results’, in which he shares backtesting research on popular candlestick patterns and shows what actually works, and what does not. Steve is the publisher of the, ‘Timely Trades Letter’ in which he shares his market analysis and specific trading setups for stocks and ETFs. To receive a sample of the ‘Timely Trades Letter’ send an email to sample@daisydogger.com. Steve’s website:www.daisydogger.com provides additional trading information and market adaptive trading techniques. Steve teaches a weekly web seminar on specific trading techniques and market analysis through Power Trader Tools.
Terms of Use & Disclaimer:
This newsletter is a publication for the education of short term stock traders. The newsletter is an educational and information service only, and not intended to offer investment advice. The information provided herein is not to be construed as an offer or recommendation to buy or sell stocks of any kind. The newsletter selections are not to be a recommendation to buy or sell any stock, but to aid the investor in making an informed decision based on technical analysis. Readers should always check with their licensed financial advisor and their tax advisor to determine the suitability of any investment or trade. Trading stocks involves risk and you may lose part or all of your investment. Do not trade with money you cannot afford to lose. All readers should consult their registered investment advisor concerning the risks inherent in the stock market prior to investing in or trading any securities.
Mar 22, 2010 | ETFs, indicators, Risk management, trading strategies
An Excerpt from the Timely Trades Letter.
Horizontal support and resistance levels should always be considered when selecting potential trades. Since stocks often consolidate, or bounce near support and resistance the distance between the entry point and support (for shorts) or resistance (for longs) is an important consideration when deciding whether or not to take a particular trade. I want to find trades with ‘room to run’ as the stock pulls back and approaches support.
Trading is based on being positioned to profit if the stock, or the market, does the usual thing in a given situation. Since stocks often bounce from support, candidates with a larger distance to support from the entry are more attractive because they have more ‘room to run. When a trading pattern occurs near support it may just drop to support and bounce, thereby limiting potential profits.
I also apply the same concepts of support, resistance, and accumulation to the market itself to determine if trading is appropriate. If I am trading shorts and the market is approaching support I become cautious. The reason is that the market often bounces or bases near support and thus shorts would be less attractive. When the market is clearly trending and well away from support I will use larger position sizes in my trades than when the market is approaching a support level. I cannot influence what the market does, but I can react to it and reduce my risks by taking smaller position sizes when the market is approaching a support level.
Someone usually asks the question, ‘yes, but what if the market had broken below support, would it not have been better to hold onto the short positions’?
I trade based on what the market usually does, not what I hope may
happen, or what sometimes happens. Since the market often bounces when retesting important lows I will stop taking new shorts and take profits on existing ones when the market approaches support. The market has two choices when it approaches support. It can bounce or it can break bellow. If the market bounces I will not incur potential losses from new shorts and will have the profits from the positions I closed. If the market breaks below support I will have the profits from the positions I closed and can easily take new positions to get back in the game. There is less risk in taking the profits when the market approaches support. It is tough to go broke taking profits. It is easy to go broke by holding on too long.
Things to do each evening:
Look at the price and volume action on the NASDAQ. Where are support and resistance levels? How is the volume on recent up and down days. Given the recent daily range, how many days would it take to reach support or resistance?
Look at each of your positions for the same information listed above. Where are your stops, and do they need to be adjusted? Do you have any stocks that are extended (consider profit taking) or ones that are breaking trend lines or support (consider exiting)?
Review your watch list of interesting patterns and make a list of the best set ups to take a look at tomorrow. Review the watch list for patterns that are no longer valid and delete those stocks from the
watch list.
Learning to trade with the Market is a key part of taking investment results to the next level. It’s harder than it sounds, and takes some experience. I haven’t met many traders who got the experience by paper trading, the pain of losing is what causes people to spend thetime and effort to review their trades and learn from the mistakes.Don’t just write off losses, learn from them, they are part of the tuition you pay to learn how to trade.
Learning to sell as the Market approaches resistance takes some practice, since after a nice run most people want to put more money in.
I generally place a protective stop immediately after entering the trade. The stop is normally under the previous day’s low, or the low of the pattern. Remember that the protective stop is just to keep you from having a bad loss. If you leave the stop at its initial protective value and use it as your only exit you will lose money. Generally set the initial protective stop at the point where the trade set up would be invalidated, then watch the behavior of the stock and the market to determine when to get out. I also make sure the stop is not at a round number, or something that ends in 5 since this is where most people place the stop. Instead of 23.00, I would place the stop at 22.95. Instead of 18.95, I would use 18.84.
Steve Palmquist a full time trader who invests his own
money in the market every day. He has shared trading
techniques and systems at seminars across the country;
presented at the Traders Expo, and published articles in
Stocks & Commodities, Traders-Journal, The Opening Bell,
and Working Money. Steve is the author of, “Money-Making Candlestick Patterns, Backtested for Proven Results’, in which he shares backtesting research on popular candlestick patterns and shows what actually works, and what does not. Steve is the publisher of the, ‘Timely Trades Letter’ in which he shares his market analysis and specific trading setups for stocks and ETFs. To receive a sample of the ‘Timely Trades Letter’ send an email to sample@daisydogger.com. Steve’s website:www.daisydogger.com provides additional trading information and market adaptive trading techniques. Steve teaches a weekly web seminar on specific trading techniques and market analysis through Power Trader Tools.
Terms of Use & Disclaimer:
This newsletter is a publication for the education of short
term stock traders. The newsletter is an educational and
information service only, and not intended to offer investment advice. The information provided herein is not to be construed as an offer or recommendation to buy or sell stocks of any kind. The newsletter selections are not to be a recommendation to buy or sell any stock, but to aid the investor in making an informed decision based on technical analysis. Readers should always check with their licensed financial advisor and their tax advisor to determine the suitability of any investment or trade. Trading stocks involves risk and you may lose part or all of your investment. Do not trade with money you cannot afford to lose. All readers should consult their registered investment advisor concerning the risks inherent in the stock market prior to
investing in or trading any securities.
