Mar 21, 2017 | EDS, EDS code, Moving averages, Stock trading
Please note that I tested the author’s system using the NASDAQ 100 list of stocks on daily bars rather than intraday bars from 12/31/2008 thru 2/10/2017. Figure 7 shows the resulting equity curve trading the author’s system with the cross-down exit. Figure 8 shows the ASA report for this test. The annualized return showed about a 17% return with a maximum drawdown of 19%.
FIGURE 7: Here are sample test results from the WinWay Portfolio Manager taking three signals per day and 10 concurrent positions maximum run on NASDAQ 100 stocks (daily bar data) over the period 12/31/08 to 2/10/07.
FIGURE 8: This shows the ASA report for the system, which shows the test metrics and settings.
!Volume-Weighted Moving Average Breakouts
!Author: Ken Calhoun, TASC Apr 2017
!Coded by: Richard Denning 2/11/17
!www.TradersEdgeSystems.com

!INPUTS:
smaLen is 70.
vwmaLen is 50.

SMA is simpleavg([close],smaLen).
VWMA is sum([close]*[volume],vwmaLen)/sum([volume],vwmaLen).
HasData if hasdatafor(max(smaLen,vwmaLen)+10)>max(smaLen,vwmaLen).
Buy if SMA < VWMA and valrule(SMA > VWMA,1) and HasData.
Sell if SMA > VWMA.

rsVWMA is VWMA / valresult(VWMA,vwmaLen)-1.
rsSMA is SMA / valresult(SMA,smaLen)-1.
Feb 2, 2017 | educational newsletters, jay kaeppel, seasonal, Stock trading
I’ve been seeing a number of panicked missives lately regarding the retailing sector. They typically go something like this:
“Despite new highs for most of the major market indexes, the retailing sector has been struggling – and in some cases hit hard – therefore it is clearly (paraphrasing here) THE END OF THE WORLD AS WE KNOW IT, AHHHHHHHHHHHHH……………………..”
Or something along those lines. And the truth is that they may be right. But as it turns out, with the retailing sector it is typically more a question of “when” and not “what” (or even WTF
Recent Results
The concerns alluded to above are understandable given recent results in certain segments of the retailing sector. Figure 1 displays the stock price action for four major retailers. It isn’t pretty.
(click to enlarge)
So if major retailers are performing poorly one can certainly see why someone might extrapolate this to conclude that the economy is not firing on all cylinders and that the recent rally to new highs by the major averages is just a mirage. And again, that opinion may ultimately prove to be correct this time around.
But before swearing off of retailing stocks, consider the following.
Retailers – When not What
For our test we will use monthly total return data for the Fidelity Select Retailing sector fund (ticker FSRPX). Figure 2 displays the growth of $1,000 invested in FSRPX only during the months of:
*February, March, April, May, November, December
Figure 2 – Growth of $1,000 invested in ticker FSRPX only during the “favorable” months since 1986
For the record:
*An initial $1,000 grew to $50,274, or +4,927% (this test does not include any interest earned during the months out of FSRPX).
*# of years showing a net gain = 27
*# of years showing a net loss = 4
*Average UP year = +17.0%
*Average DOWN year = (-3.4%)
*Maximum UP Year = +50.0% (1990)
*Maximum DOWN Year = (-5.9%) (1994)
The Year-by-Year Results appear in Figure 3
| Year |
% +(-) |
| 1986 |
26.2 |
| 1987 |
15.8 |
| 1988 |
12.2 |
| 1989 |
16.9 |
| 1990 |
50.0 |
| 1991 |
45.5 |
| 1992 |
8.0 |
| 1993 |
4.6 |
| 1994 |
(5.9) |
| 1995 |
3.0 |
| 1996 |
26.1 |
| 1997 |
18.1 |
| 1998 |
45.7 |
| 1999 |
4.0 |
| 2000 |
1.8 |
| 2001 |
12.5 |
| 2002 |
(0.1) |
| 2003 |
18.5 |
| 2004 |
11.3 |
| 2005 |
10.3 |
| 2006 |
0.1 |
| 2007 |
(2.8) |
| 2008 |
(4.7) |
| 2009 |
44.9 |
| 2010 |
24.5 |
| 2011 |
4.6 |
| 2012 |
10.8 |
| 2013 |
16.6 |
| 2014 |
11.5 |
| 2015 |
6.1 |
| 2016 |
9.2 |
Figure 3 – Year-by-Year Results for “Favorable” Months since 1986
The Rest of the Year
If for some reason you had decided to skip the months above and hold FSRPX only during all of the other months of the year, your results appear in Figure 4.
Figure 4 – Growth of $1,000 invested in ticker FSRPX only during the “unfavorable” months since 1986
For the record:
*An initial $1,000 grew to $1,037, or +3.7% (this test does not include any interest earned during the months out of FSRPX).
Summary
Is the retailing sector guaranteed to generate a gain during our “favorable” months in 2017? Not at all. Still, given that retailing is presently beaten down a bit and the fact that the worst full year loss during the favorable months was -5.9%, it may be time to think about taking a look (although – as always, and for the record – I am not “recommending” retailing stocks, only pointing out the historical trends).
Still, as the old saying goes, the results below are what we “quantitative types” refer to as “statistically significant”.
*Favorable months since 1986 = +4,927%
*Unfavorable months since 1986 = +3.7%
Sep 19, 2016 | group and sector, indexes, stock market, Stock trading
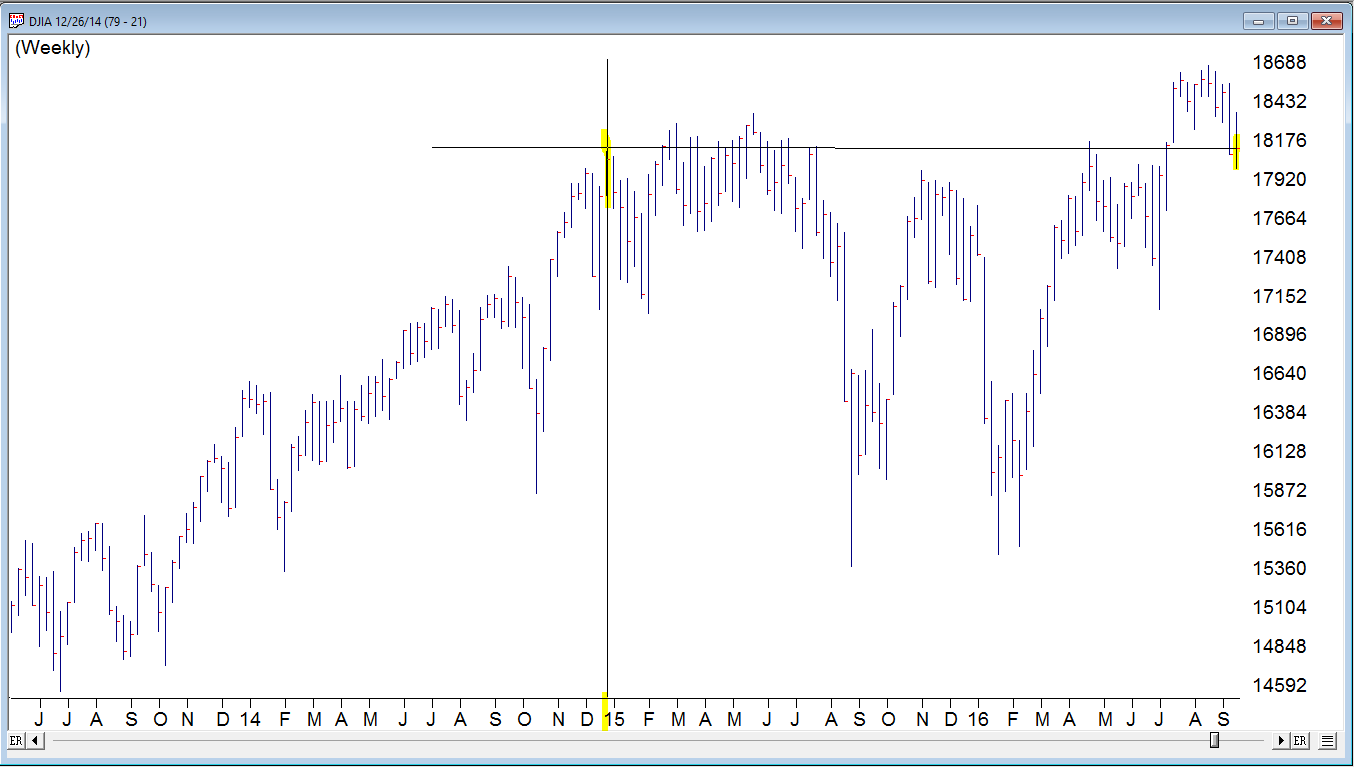
The markets have been shall we say been less than inspiring recently. Brexit came and went with a brief hiccup in the action and only in the last week or so has the volatility picked up. The Dow as you can see in this weekly chart is back the same level as December 2014
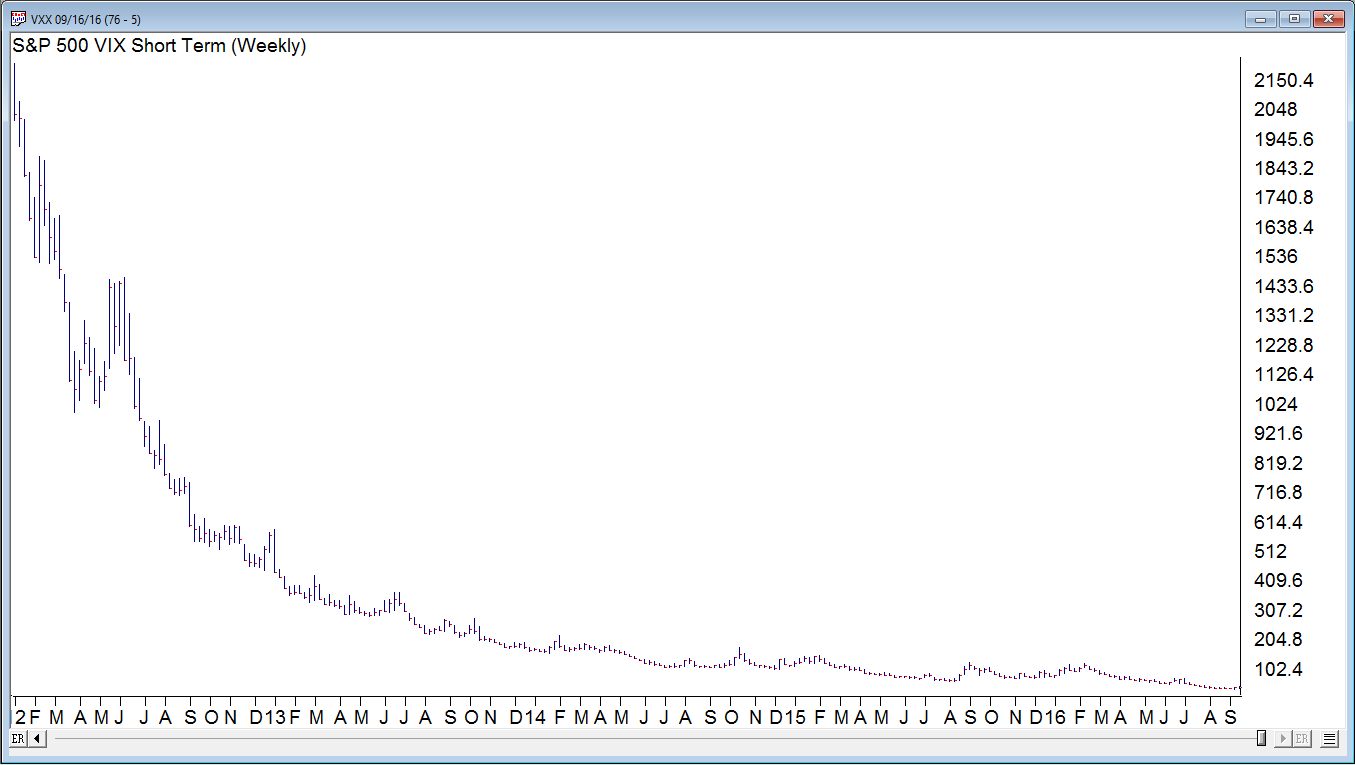
The VXX shows clearly the decline in volatility since the high back in 2011
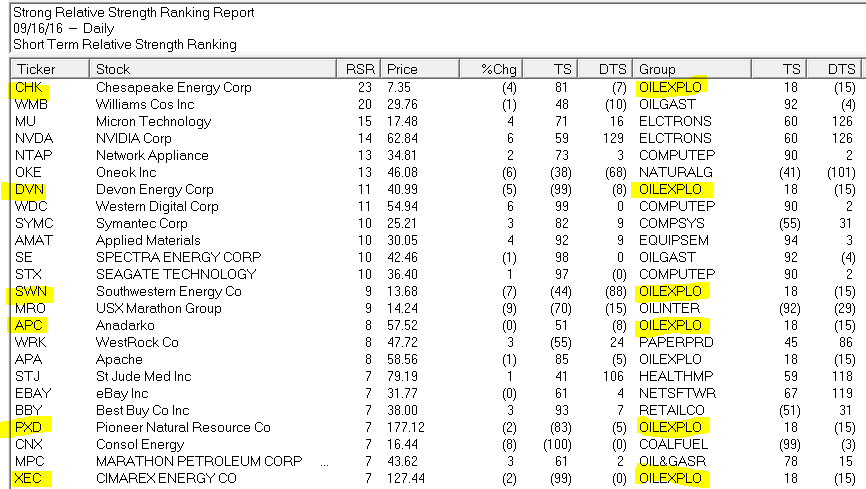
The summer doldrums may be over, but during periods when the market is range bound, segments within the market are often performing very well or very poorly. One AIQ Report that can show the strength within segments is the Relative Strength Strong – Short Term. This report shows stocks in 3 month trend up and is a great report for those who trade with ‘the trend is your friend’. Here is Friday 9-16-2016 report. The report is ranked by the stocks with the best trend.
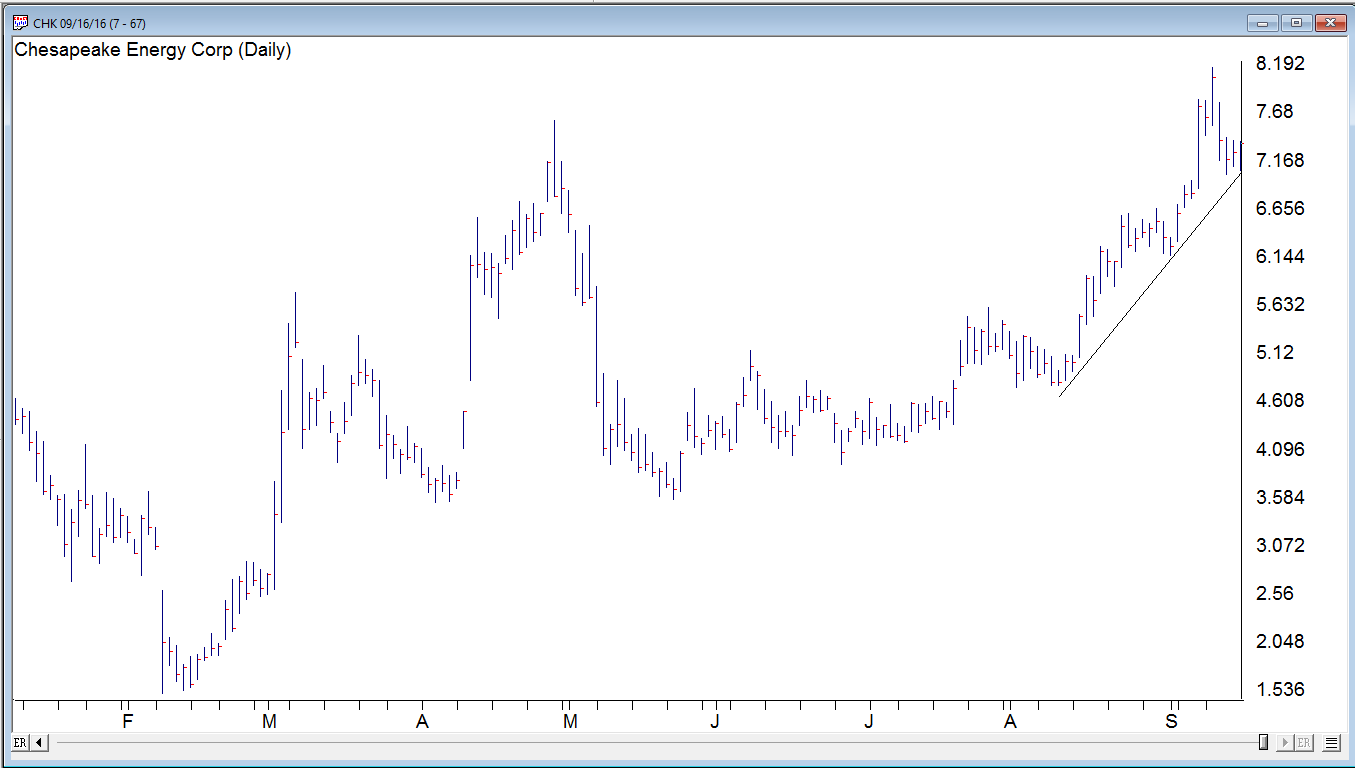
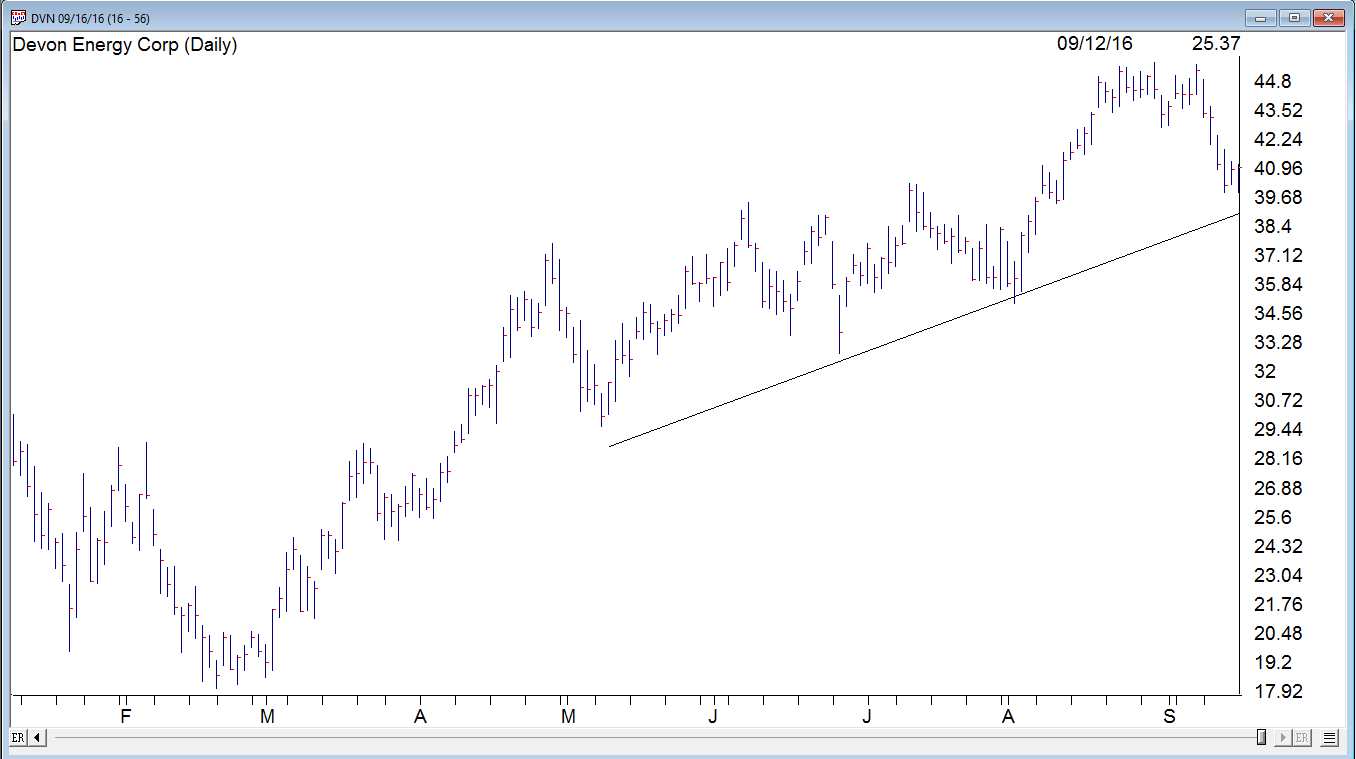
I highlighted 6 stocks in the top of this report. All have good trends in place, and all in the Oil and Exploration S&P 500 group. The group has performed quite well recently. The top 2 OILEXPO stocks CHK and DVN have both had a small pullback to their uptrend line. We’ll see how they do this week.