Jan 20, 2018 | EDS, EDS code, educational newsletters, jay kaeppel
In this article I detailed an indicator I refer to as VixRSI14 using monthly charts. Today let’s apply the same method to weekly bar charts. Before we do that a quick look at how this indicator functions.
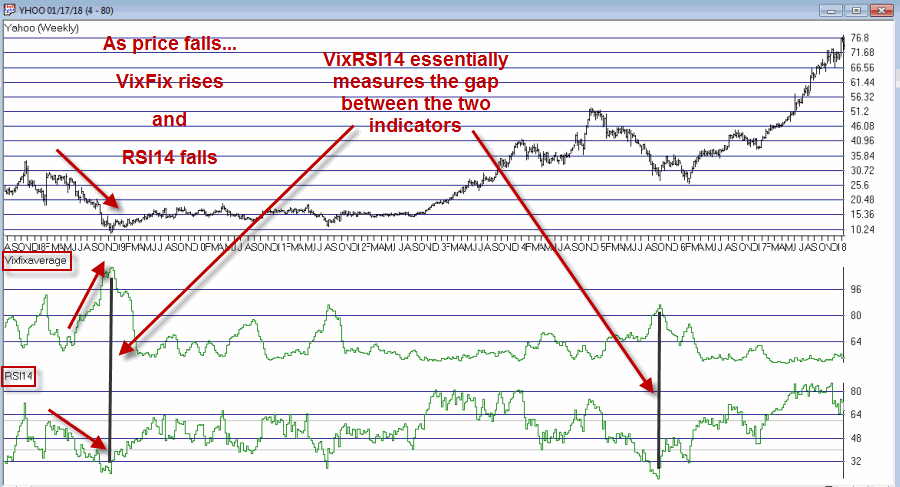
VixRSI combines two indicators – Larry William’s VixFix and Welles Wilder’s Relative Strength Index (RSI). In Figure 1 you see a weekly bar chart for YHOO. Notice that as price declines the VixFix indicator rises and RSI falls. VixRSI14 essentially measures the difference between the two and looks for extremes as a sign of a potential reversal. See Figure 5 for YHOO with VixRSI14.
Figure 1 – YHOO with Williams VixFix (with 3-day exponential smoothing) and Wilder’s 14-period RSI (Courtesy
TradingExpert)
The Weekly Version of VixRSI14
We will use the same method I described in the previous article, i.e.:
*We will calculate the VixRSI14 indicator (see code at end of article) on a weekly basis
*A “buy alert” occurs when VixRSI14 drops below 3.00 after first rising to 3.50 or higher
Once again, please note that:
*There is nothing magic about 3.50 or 3.00
*Not every “buy alert” is followed by an immediate rally (or even any rally at all for that matter)
*Any actually trading”results” will depend heavily on what you trade, how much of it you trade, when you actually get in, when you get out with a profit and/or when you get out with a loss.
*This VixRSI14 alert signal is simply serving notice that a given security may be overdone on the downside and may be ready soon to reverse to the upside. Nothing more, nothing less.
Summary
In 2018 I intend to try to share a few more trading “ideas” that maybe are not quite “finished products”. VixRSI14 fits neatly into the “Idea” category. Sometimes the alerts are early. Sometimes the alerts are late. Sometime the alerts don’t really pan out at all. Sometimes alerts are followed by one more sharp decline which is then followed by a major rally. So maybe some sort of trend reversal confirmation would be helpful. I don’t know.
Hey, that gives me an idea….
Code:
William’s VixFix is simply the 22-period high price minus today’s low price divided by the 22-day period price (I then multiply by 100 and then add 50). That may sound complicated but it is not.
The code for AIQ TradingExpert appears below.
########## VixFix Code #############
hivalclose is hival([close],22).
vixfix is (((hivalclose-[low])/hivalclose)*100)+50.
###############################
####### 14-period RSI Code ###########
Define periods14 27.
U14 is [close]-val([close],1).
D14 is val([close],1)-[close].
AvgU14 is ExpAvg(iff(U14>0,U14,0),periods14).
AvgD14 is ExpAvg(iff(D14>=0,D14,0),periods14).
RSI14 is 100-(100/(1+(AvgU14/AvgD14))).
###############################
VixRSI14 is then calculated by dividing the 3-period exponential average of VixFix by the 3-period exponential average of RSI14
####### VixRSI14 Code ###########
VixRSI14 is expavg(vixfix,3)/expavg(RSI14,3).
###############################
Jay Kaeppel
Disclaimer: The data presented herein were obtained from various third-party sources. While I believe the data to be reliable, no representation is made as to, and no responsibility, warranty or liability is accepted for the accuracy or completeness of such information. The information, opinions and ideas expressed herein are for informational and educational purposes only and do not constitute and should not be construed as investment advice, an advertisement or offering of investment advisory services, or an offer to sell or a solicitation to buy any security.
Jan 17, 2018 | EDS, EDS code, educational newsletters, jay kaeppel
While the bulk of the financial world focuses most of its attention on whether or not Bitcoin will turn to sh, er, something that rhymes with Bitcoin, a lot of “old timers” continue on with trying to look at markets in a more traditional way. Unfortunately, some people who try to look at markets in a more traditional way also spend an inordinate amount of time “dividing one number by another” thinking there is some purpose to it (“Hi. My name is Jay”)
The only good news is that every once in awhile something useful – or at least potentially useful (since no single calculation guarantees profitability which also involves other “minor” issues such as which securities to trade, allocation size, entry method, profit taking criteria, stop loss triggers and so on and so forth). A number of years ago I stumbled upon a calculation that I ultimately refer to as VixRSI (for reasons that will become fairly obvious soon). More specifically I have a few different versions but one I like is call used VixRSI14.
First the Good News: In this and some future articles I will detail how I apply VixRSI14 to monthly, weekly and daily price charts.
Now the Bad News: Nothing that I will write in any of those articles will detail a “simple automated system that generates you can’t lose trading signals guaranteed to make you rich beyond the dreams of avarice.” Sorry about that. But I thought you should know.
The truth is that the indicator generates signals – and yes, a certain percentage of the time those signals aren’t that great. And even on occasions when the signals are decent all of the factors I mentioned above (securities traded, capital allocation, etc.) still hold the key to turning a “signal” into a “profit”.
VixRSI14 is calculated by combining Larry William’s “VixFix” indicator with the standard old 14-day RSI from Welles Wilder. I’ve decided to put the calculations at the end of the article in order to avoid scaring anyone off.
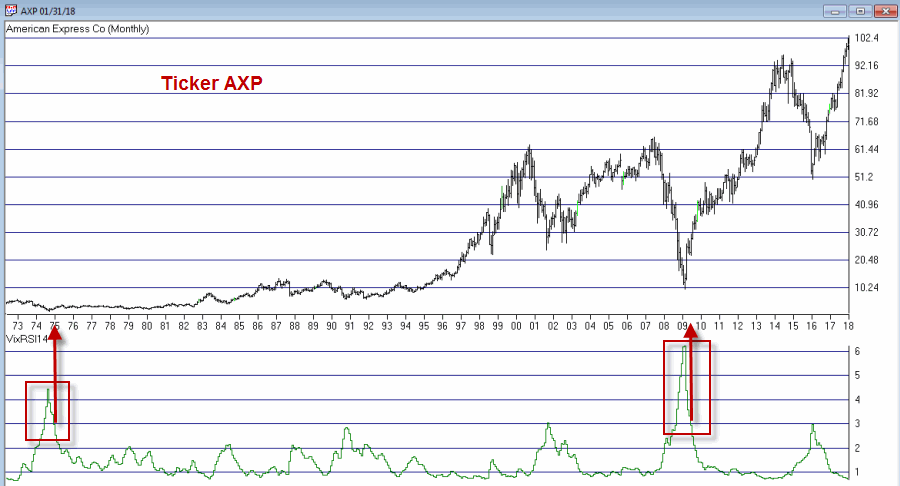
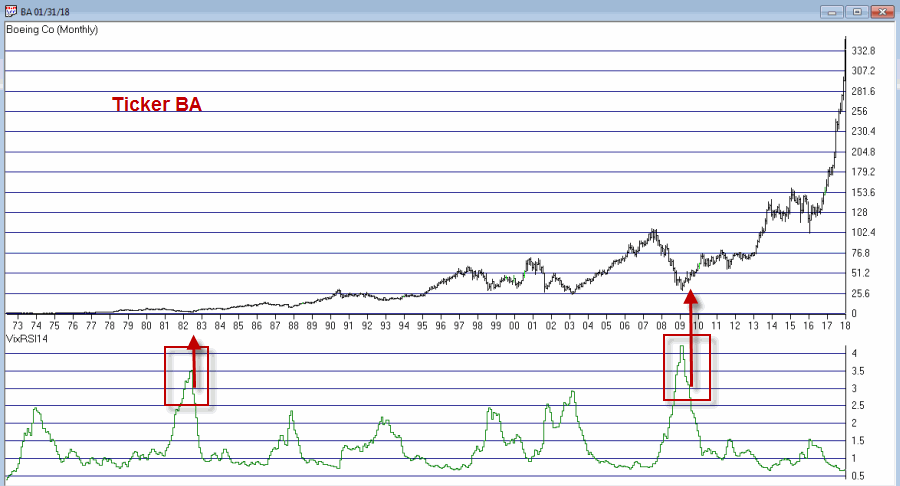
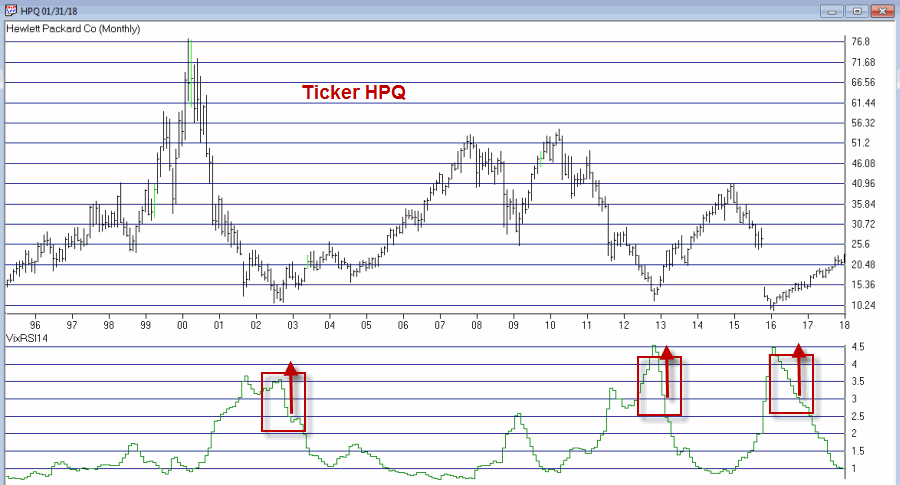
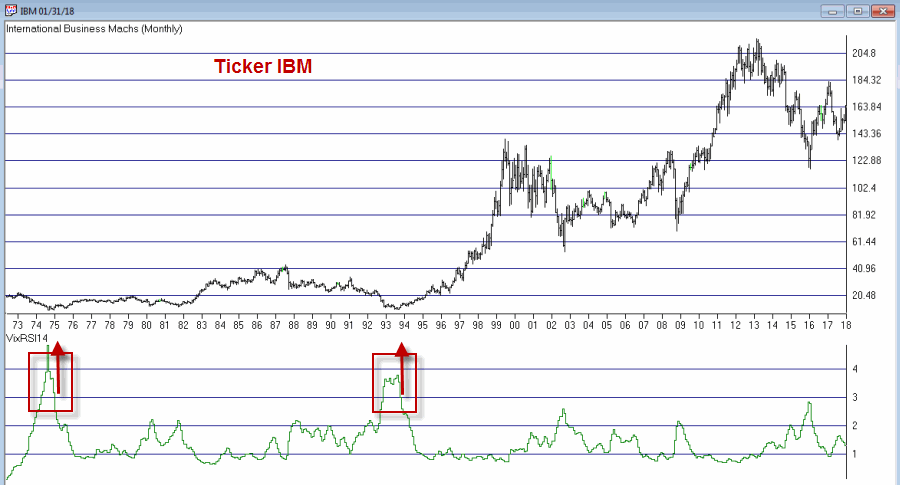
For now let’s look at what to look for on a monthly price chart.
VixRSI14 on a Monthly Chart
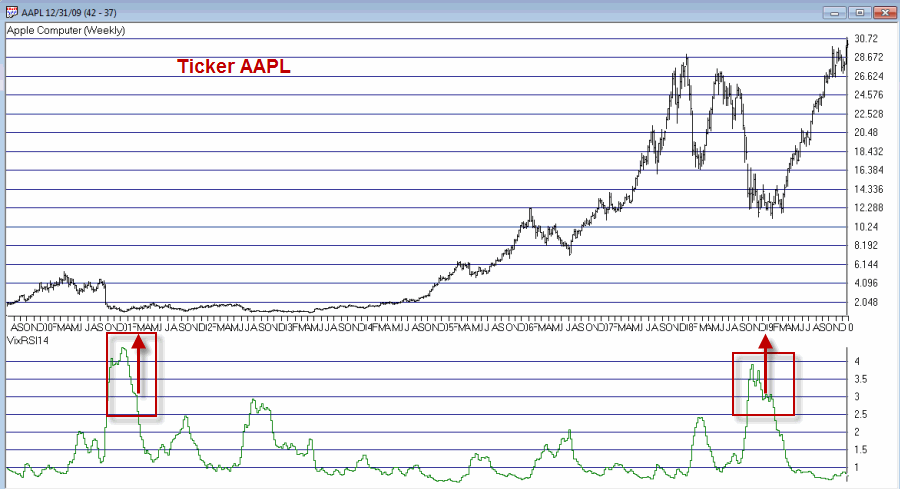
OK, true confession time: there is (at least as far as I can tell) no “one best way” to use VixRSI14 on a monthly chart. So I will simply show you “One way.”
*A “buy alert” is triggered when the monthly value for VixRSI14 first rises to 3.5 or higher and then drops back to 3.0 or below
*Before going on please note that there is nothing “magic” about 3.5 or 3. Different values can be used and will generate varying results.
*Also, some may prefer to simply look for a drop from above 3 to below 3 without requiring a move above 3.5
*Finally please note the use of the phrase “buy alert” and the lack of the phrase “BUY AS MUCH AS YOU CAN RIGHT THIS VERY MINUTE!!!!”
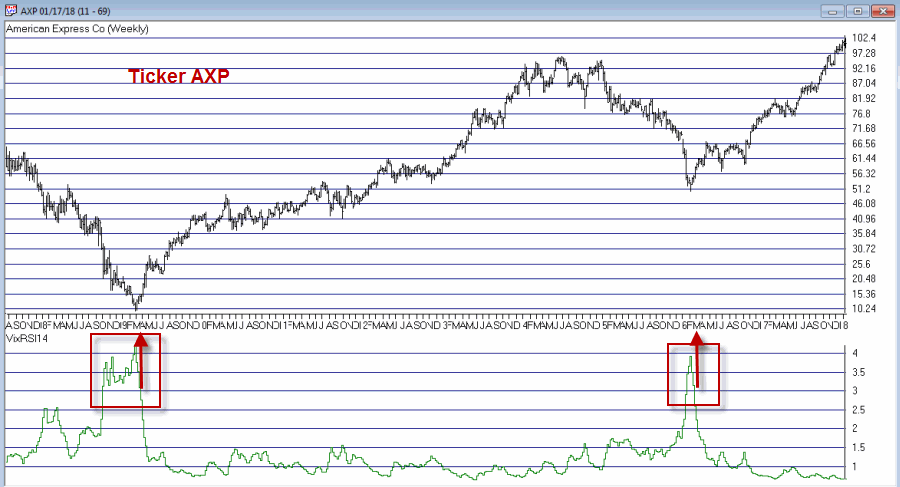
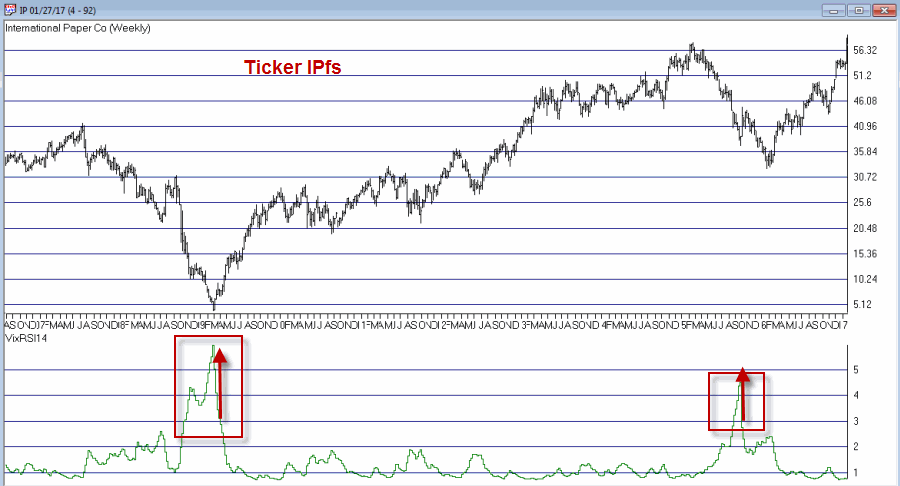
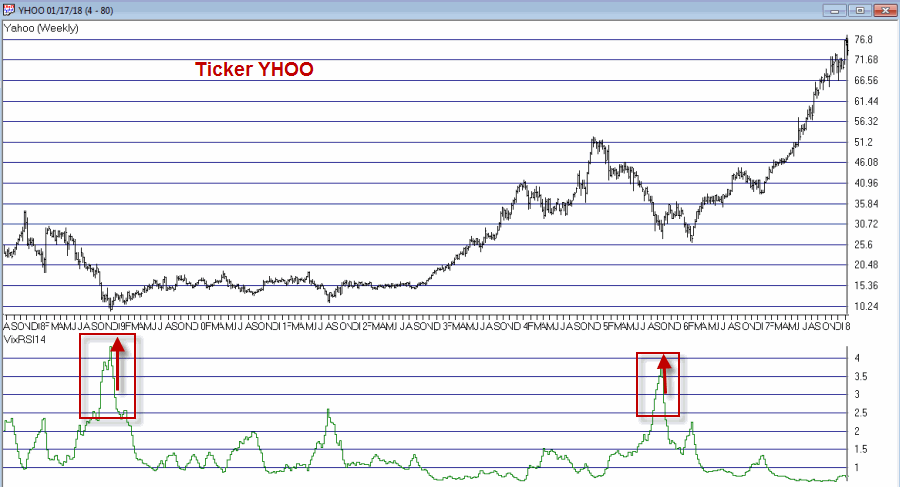
Figures 1 through 4 show several different Dow30 stocks “through the years.
Buy alerts on monthly charts using the criteria I described are obviously very rare. In fact many securities never see the VixRSI14 rise high enough to trigger an alert. Likewise, not every 3.5 then 3 event for every stock will work out as well as those depicted in Figures 1 through 4.
Still, remember that I am just presenting an “idea” and not a finished product.
William’s VixFix is simply the 22-day high price minus today’s low price divided by the 22-day high price (I then multiply by 100 and then add 50). That may sound complicated but it is not.
The code for TradingExpert EDS appears below.
########## VixFix Code #############
hivalclose is hival([close],22).
vixfix is (((hivalclose-[low])/hivalclose)*100)+50.
###############################
####### 14-period RSI Code ###########
U14 is [close]-val([close],1).
D14 is val([close],1)-[close].
AvgU14 is ExpAvg(iff(U14>0,U14,0),periods14).
AvgD14 is ExpAvg(iff(D14>=0,D14,0),periods14).
RSI14 is 100-(100/(1+(AvgU14/AvgD14))).
###############################
VixRSI14 is then calculated by dividing the 3-period exponential average of VixFix by the 3-period exponential average of RSI14
####### VixRSI14 Code ###########
VixRSI14 is expavg(vixfix,3)/expavg(RSI14,3).
#########################
Disclaimer: The data presented herein were obtained from various third-party sources. While I believe the data to be reliable, no representation is made as to, and no responsibility, warranty or liability is accepted for the accuracy or completeness of such information. The information, opinions and ideas expressed herein are for informational and educational purposes only and do not constitute and should not be construed as investment advice, an advertisement or offering of investment advisory services, or an offer to sell or a solicitation to buy any security.
Jan 12, 2018 | EDS, EDS code, educational newsletters, jay kaeppel
First the brutal disclaimers: What follows is NOT a trading “system.” It is merely an “idea.” Even more brutally, I can’t even claim that it “works”. All the testing I have done so far is more anecdotal. Also to an extremely huge degree, the actual entry trigger and exit trigger that trader might choose to use will have – as always – at least as much if not more impact on overall trading results as the actual “alert” signal detailed below.
Got that? OK, then let’s proceed.
The Debate
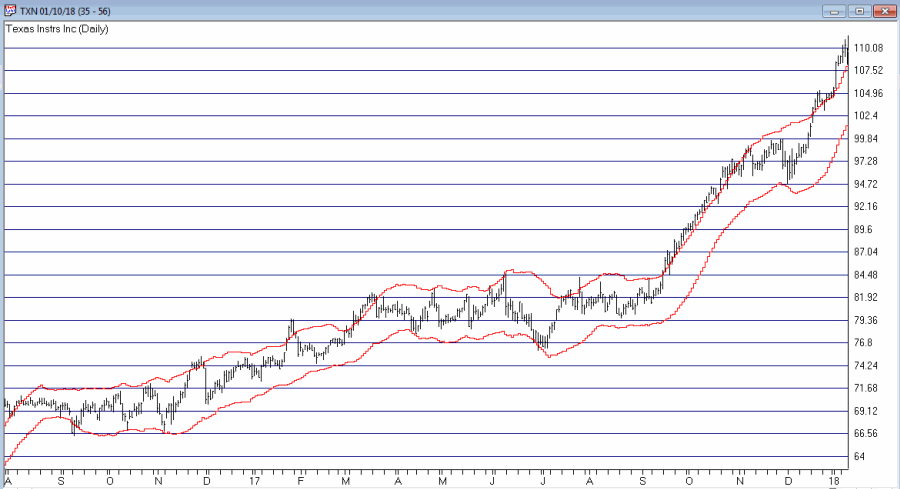
The ongoing debate in trading is always – trend-following or countertrend? Which is the way to go? There are (conservatively) at least a bazillion and one ways to argue one way or the other. Figure 1 displays ticker TXN with upper and lower “Acceleration Bands” (code for TradingExpert Expert Design Studio EDS appears after disclaimer at end of article) drawn.
Want to start a debate? Ask this question: Is it better to buy when price hits the upper band or the lower band? Sometimes price hits the upper band and just keeps going. Sometimes it hits the upper band and the move peters out and reverses fairly quickly.
Going with the trend can lead to some big winning trades along the way, but typically involves a lot of whipsaws as well. Trading countertrend can lead to some great, quick profits – expect of course for when the initial trend never quite reverses and quick losses accrue instead.
What to do, what to do?
So the “idea” I mentioned at the outset generally goes like this:
*In an uptrend (which we will define in a moment)
*Wait for price to hit the Upper Band
*Then wait for a pullback
*Then wait for the uptrend to reassert itself
Got that? OK, me neither exactly. So let’s try to define things a little more clearly.
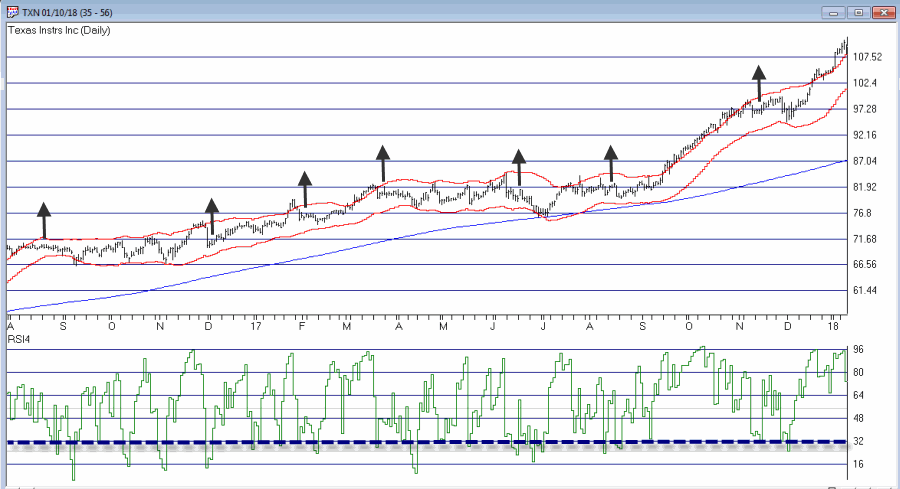
1. As long as the closing price remains above the 200-day moving average, we will call that an “uptrend”
2. Within an uptrend wait for the high of a trading day to reach or exceed the Upper Acceleration Band.
3. Following #2, wait for the 4-day RSI to drop to 32 or lower with the following caveats:
*If price touches the Lower Acceleration Band OR closes below the 200-day moving average
*Then the setup is invalidated
This is the “Setup”. For sake of example I will add an entry trigger as follows:
4. Following a valid #3 Alert Signal, buy when price exceeds the previous day’s high
I am going to purposely NOT add an exit trigger – just so that no one decides to “try it out” without at least giving it some thought on their own.
So Figure 2 shows the “Alerts” and “Entry Triggers” for the chart in Figure 1.
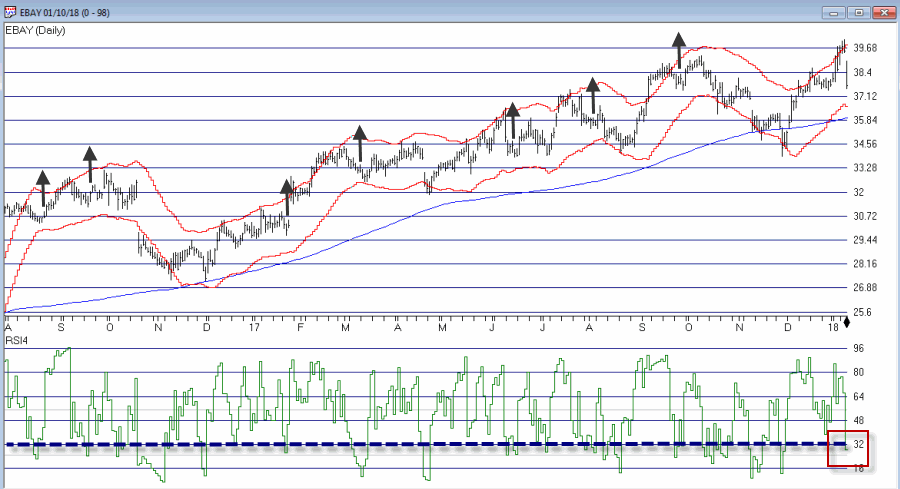
So Figure 3 shows the “Alerts” and “Entry Triggers” for ticker EBAY
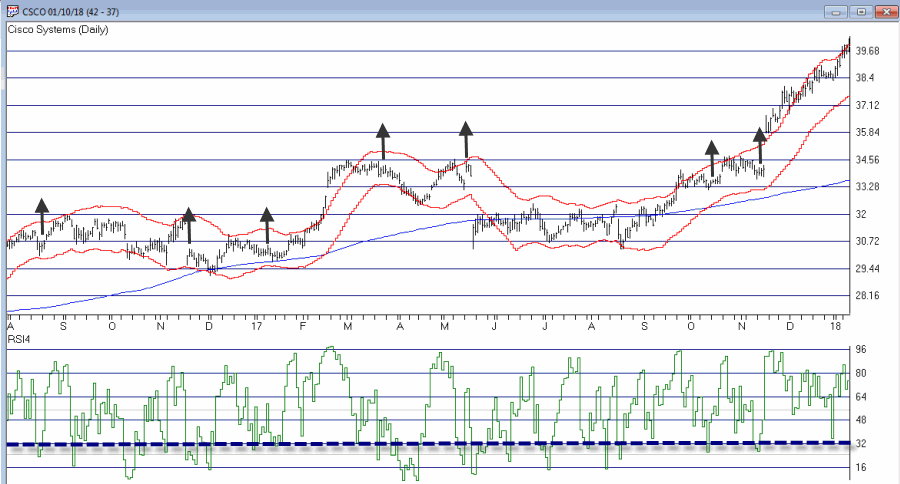
So Figure 4 shows the “Alerts” and “Entry Triggers” for ticker CSCO
So are these signals any good? Well, like a lot of trading methods, some look pretty good and others do not. As I also mentioned earlier, a lot depends on the method or methods you use to exit each trade.
Summary
The reality is that there is a chance that the “idea” contained herein is just no darn good.
But also remember that there are other “trend filters” (besides the 200-day moving average), there are other “bands” (besides Acceleration Bands”), there are other oversold indicators (besides 4-day RSI) and there are other entry and exit triggers.
As such, this piece is essentially for people who are willing to do a little digging on their own and, a) become comfortable (or not) with the idea, and b) develop some position sizing, stop-loss and profit-taking criteria.
Jay Kaeppel
Disclaimer: The data presented herein were obtained from various third-party sources. While I believe the data to be reliable, no representation is made as to, and no responsibility, warranty or liability is accepted for the accuracy or completeness of such information. The information, opinions and ideas expressed herein are for informational and educational purposes only and do not constitute and should not be construed as investment advice, an advertisement or offering of investment advisory services, or an offer to sell or a solicitation to buy any security.
Acceleration Bands Code for AIQ Expert Design Studio EDS
a is ([high]-[low]).
b is ([high]+[low])/2.
c is (a / b).
d is (c*2).
e is (1+d).
f is (1-d).
g is ([high]*e).
h is ([low]*f).
AccelUB is Simpleavg(g, 20).
AccelLB is Simpleavg(h, 20).
Dec 20, 2017 | EDS, EDS code, Stocks & Commodities Traders Tips
The WinWay EDS code based on Vitali Apirine’s article in December 2017 issue of Stocks and Commodities magazine, “Weekly & Daily MACD,” is provided below.
The moving average convergence/divergence oscillator (MACD), developed by Gerald Appel, is one of the more popular technical analysis indicators. The MACD is typically used on a single timeframe, but what if we looked at two timeframes on one chart?
Traders can look for relative daily MACD line crossovers, weekly and daily centerline crossovers, and divergences to generate trading signals.
Figure 5 shows the daily & weekly MACD indicator on a chart of Apple Inc. (AAPL) during 2016 and 2017, when there was a change from a downtrend to an uptrend.
FIGURE 5: AIQ. Here is an example of the daily & weekly MACD on a chart of AAPL.
!WEEKLY & DAILY MACD
!Author: Vitali Apirine, TASC Dec 2017
!Coded by: Richard Denning 10/13/17
!www.TradersEdgeSystems.com

!INPUTS:
S is 12.
L is 25.

EMA1 is expavg([Close],S).
EMA2 is expavg([Close],L).
EMA3 is expavg([Close],S*5).
EMA4 is expavg([Close],L*5).
MACD is EMA1 - EMA2.
MACDW is EMA3 - EMA4.
rdMACD is MACD + MACDW.
Dec 1, 2017 | EDS, EDS code, trading strategies, trading strategy
The Expert Design Studio code for Jerry D’Ambrosio and Barbara Star’s article, “A Candlestick Strategy With Soldiers And Crows,” in Stocks & Commodities October 2018 issue is shown below.”Among the more well-known candlestick reversal patterns are soldiers and crows. These occur in a three-candle pattern such as three white soldiers or three black crows. Recently, on the website Candlesticker.com, we learned of two other candle reversal patterns—a bullish one white soldier and a bearish one black crow—that require fewer candles. ”
!A CANDLESTICK STRATEGY WITH SOLDIERS AND CROWS
!Author: Jerry D'Ambrosio & Barbara Star, TASC Oct 2017
!Coded by: Richard Denning 8/05/2017
!www.TradersEdgeSystems.com

!CODING ABBREVIATIONS:
O is [open].
O1 is valresult(O,1).
C is [close].
C1 is valresult(C,1).
C2 is valresult(C,2).
H is [high].
L is [low].
V is [volume].

!INPUTS:
minPriceBull is 1.
minPriceBear is 10.
minVolume is 1000. !in hundreds
volAvgLen is 50.
dayCount is 5.
longExitBars is 7.
shortExitBars is 1.

okToBuy if simpleavg(C,50) > simpleavg(C,200) or CminPriceBull and simpleavg(V,volAvgLen)>minVolume.
BullWS if C1C1 and C>O1 and O= longExitBars.

okToSell if simpleavg(C,50) < simpleavg(C,200) or C>simpleavg(C,200)*1.1.
okToSellMkt if TickerRule("SPX",okToSell).
PVfilterBear if C>minPriceBear and simpleavg(V,volAvgLen).
BearBC if C1>C2 and C1>O1
     and OO1
     and countof(C1>C2,dayCount)=dayCount
     and PVfilterBear and okToSellMkt.
ExitShort if {position days} >= shortExitBars.
I ran several backtests using the NASDAQ 100 list of stocks over the period from 8/04/2000 to 8/04/2017. I varied the following inputs to find the optimum set of parameters for the candlestick patterns. For longs, the “dayCount” = 5 with an “longExitBars” = 7 produced the best results, which is shown in Figure 5. For shorts, the “dayCount” = 5 with a “shortExitBars” = 1 produced the best results, which is shown in Figure 6. Neither commission nor slippage were subtracted from the results.
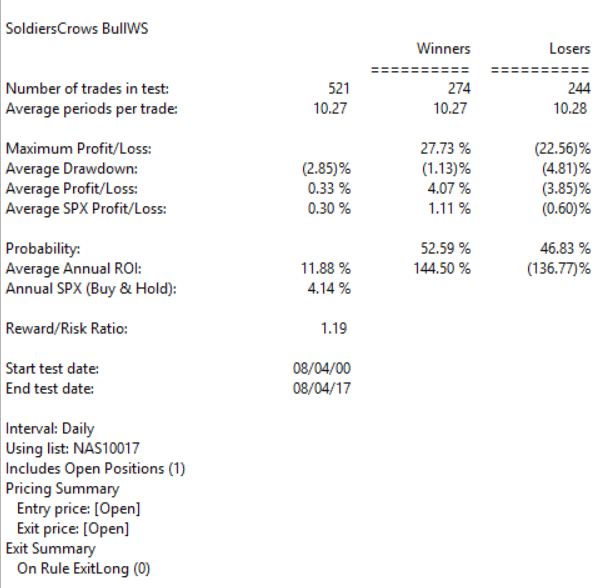
FIGURE 5: WINWAY. EDS summary report for longs only.
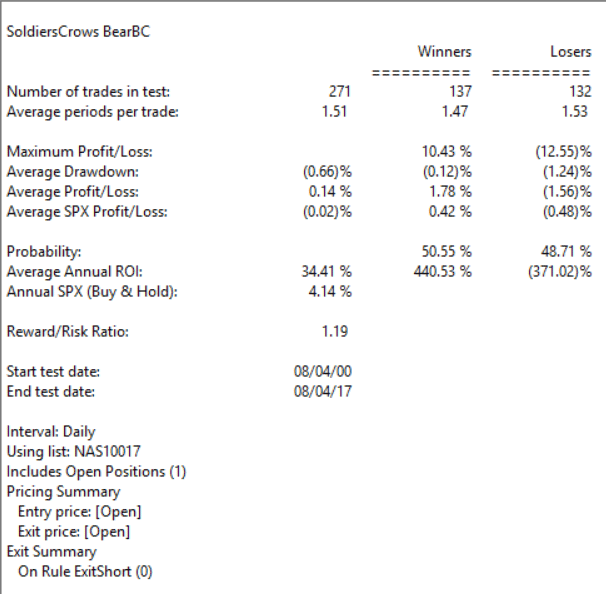
FIGURE 6: WINWAY. EDS summary report for shorts only.
Oct 10, 2017 | Charts, EDS, EDS code, indicators, jay kaeppel
First the Bad News: There are no “magic bullets” when it comes to trading. There are people in this industry who have literally tested somewhere in the range of six bazillion “indicators” – give or take (“Hi. My name is Jay”). Every trend following indicator looks like a gold mine when it latches onto a huge trend and rides it (but not so much when it starts getting whipsawed). And every overbought/oversold indicator looks like a gift from heaven from time to time when it somehow manages to peak (or valley) and then reverses right at a high (or low). And then the next time the thing gets oversold the security in question just keeps plunging and the previously “amazingly accurate” indicator just gets more and more oversold.
Bottom line: what I am about to discuss is likely no better or worse than a lot of other indicators. And it is no holy grail. Still, I kinda like it – or whatever that is worth.
EDITORS NOTE an WinWay EDS file for this indicator with the 3 step rules outlined can be downloaded from here you will need to copy or save this file into your wintes32/eds strategies folder. Alternatively the code is available at the end of this article for copying and pasting into a new EDS file.
UpDays20
I call this indicator UpDays20 and I stole, er, learned it originally from Tom McClellan of McLellan Financial Publications. My calculation may be slightly different because I wanted an indicator that can go both positive and negative.
For a given security look at its trading gains and losses over the latest 20 trading days.
UPDays20 = (Total # of Up days over the last 20 trading days) – 10
So if 10 of the last 20 trading days showed a gain then UpDays20 would read exactly 0.
If only 6 of the last 20 trading days showed a gain then UpDays20 would read -4
You get the idea (and proving once again that it “doesn’t have to be rocket science”). As a “trading method” it is always advised that this indicator – like most all other indicators – NOT be used as a standalone approach to trading. That being said, the way I follow this indicator is as follows.
Step 1) UpDays20 drops to at least -2
Step 2) UpDays20 rises 2 points from a low
Step 3) The security in question then rises above its high for the previous 2 trading days
It is preferable to follow this setup hen the security in question is above its 200-day moving average, but that is up to the trader to decide (the danger to using this with a security below its 200-day moving average is that it might just be in the middle of a freefall. The upside is that counter trend rallies can be fast and furious – even if sometimes short-lived).
Again, there is nothing magic about these particular steps. They are simply designed to do the following:
1) Identify an oversold condition
2) Wait for some of the selling pressure to abate
3) Wait for the security to show some sign of reversing to the upside
Like just about every other indicator/method, sometimes it is uncannily accurate and sometimes it is embarrassingly wrong (hence the reason experienced traders understand that capital allocation and risk management are far more important than the actually method you use to enter trades).
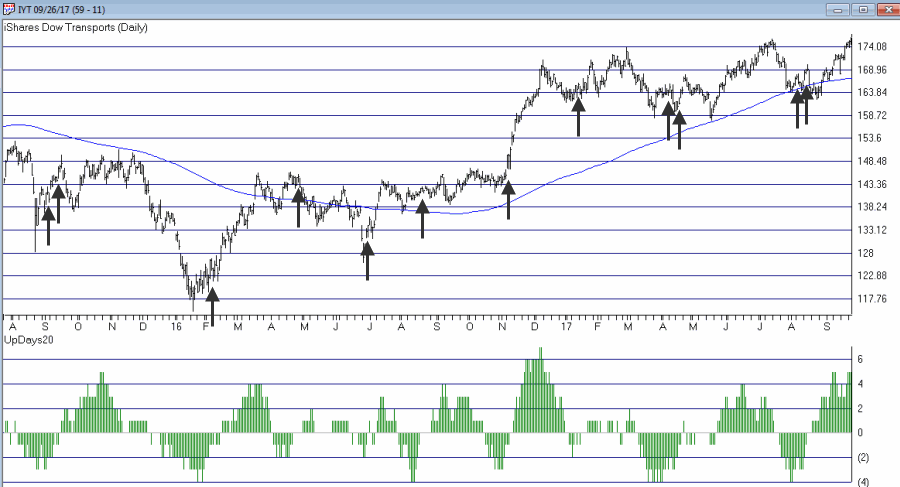
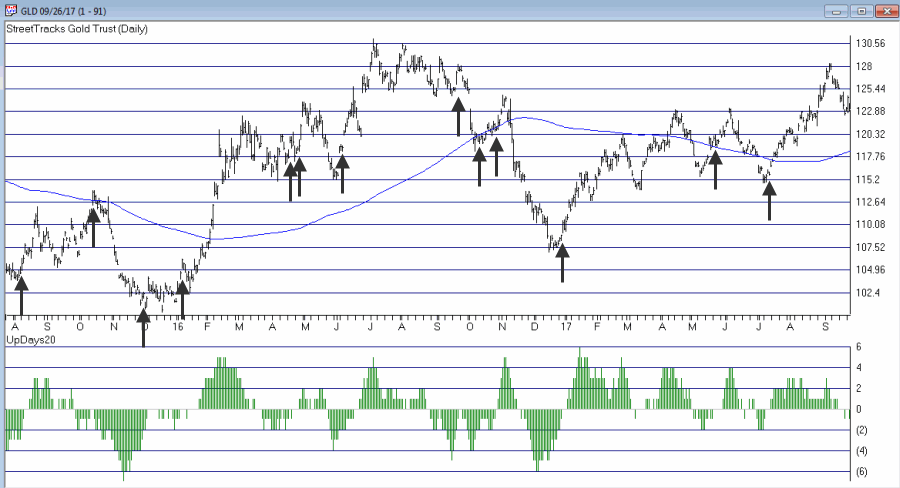
In this previous article (in Figures 3 and 4) I wrote about using this indicator with ticker TLT. Figure 1 and 2 display the “buy” signals generated using the rules above for tickers IYT and GLD.

Figure 1 – UpDays20 “Buy” Alerts for ticker IYT (Courtesy TradingExpert)

Figure 2 – UpDays20 “Buy” Alerts for ticker GLD (Courtesy TradingExpert)
Are these signals good or bad? That is in the eye of the beholder and not for me to say. One big unanswered question is “when do you exit”? That is beyond the scope of this “idea” article – however, “sell some at the first good profit and then use a trailing stop” looks like a decent approach to consider) but would have a profound effect on any actual trading results.
Some of the signals displayed in Figures 1 and 2 are obviously great, others are maybe not so hot. Interestingly, some of the signals in Figure 1 and 2 that don’t look to timely at first blush actually offered a profitable opportunity to a trader who was inclined to take a quick profit. Again, how you allocate capital and when you exit with a profit and when you exit with a loss would likely have as much impact on results as the raw “buy” signals themselves.
Summary
No one should go out and start trying to trade tomorrow based on UpDays20. No claim is being made that the steps detailed herein will result in profits nor even that this is a good way to trade.
But, hey, it’s one way.
Jay Kaeppel Chief Market Analyst at JayOnTheMarkets.com and TradingExpert Pro client.
Disclaimer: The data presented herein were obtained from various third-party sources. While I believe the data to be reliable, no representation is made as to, and no responsibility, warranty or liability is accepted for the accuracy or completeness of such information. The information, opinions and ideas expressed herein are for informational and educational purposes only and do not constitute and should not be construed as investment advice, an advertisement or offering of investment advisory services, or an offer to sell or a solicitation to buy any security.
EDITORS NOTE an WinWay EDS file for this indicator with the 3 step rules outlined can be downloaded from here you will need to copy or save this file into your wintes32/eds strategies folder. Alternatively the code is available at the end of this article for copying and pasting into a new EDS file.
! UpDays20 – I call this indicator UpDays20. For a given security look at its trading gains and losses over the latest 20 trading days.
! UPDays20 = (Total # of Up days over the last 20 trading days) – 10!
So if 10 of the last 20 trading days showed a gain then UpDays20 would read exactly 0.
! If only 6 of the last 20 trading days showed a gain then UpDays20 would read -4
Upday if [close]>val([close],1).
totalupdayslast20days is CountOf(upday,20).
updayindicator is totalupdayslast20days – 10.
! How to follow this indicator
! Step 1) UpDays20 drops to at least -2
! Step 2) UpDays20 rises 2 points from a low
! Step 3) The security in question then rises above its high for the previous 2 trading days
UpDays20rises2points if updayindicator>valresult(updayindicator,1) and valresult(updayindicator,1)>valresult(updayindicator,2).
updays20atminus2orlower if valresult(updayindicator,2)<=-2.
closesabovehighof2priordays if [close]>val([high],1) and [close]>val([high],2).
Upsignal if UpDays20rises2points and updays20atminus2orlower and closesabovehighof2priordays.