Dec 20, 2017 | EDS, EDS code, Stocks & Commodities Traders Tips
The WinWay EDS code based on Vitali Apirine’s article in December 2017 issue of Stocks and Commodities magazine, “Weekly & Daily MACD,” is provided below.
The moving average convergence/divergence oscillator (MACD), developed by Gerald Appel, is one of the more popular technical analysis indicators. The MACD is typically used on a single timeframe, but what if we looked at two timeframes on one chart?
Traders can look for relative daily MACD line crossovers, weekly and daily centerline crossovers, and divergences to generate trading signals.
Figure 5 shows the daily & weekly MACD indicator on a chart of Apple Inc. (AAPL) during 2016 and 2017, when there was a change from a downtrend to an uptrend.
FIGURE 5: AIQ. Here is an example of the daily & weekly MACD on a chart of AAPL.
!WEEKLY & DAILY MACD
!Author: Vitali Apirine, TASC Dec 2017
!Coded by: Richard Denning 10/13/17
!www.TradersEdgeSystems.com

!INPUTS:
S is 12.
L is 25.

EMA1 is expavg([Close],S).
EMA2 is expavg([Close],L).
EMA3 is expavg([Close],S*5).
EMA4 is expavg([Close],L*5).
MACD is EMA1 - EMA2.
MACDW is EMA3 - EMA4.
rdMACD is MACD + MACDW.
Dec 1, 2017 | EDS, EDS code, trading strategies, trading strategy
The Expert Design Studio code for Jerry D’Ambrosio and Barbara Star’s article, “A Candlestick Strategy With Soldiers And Crows,” in Stocks & Commodities October 2018 issue is shown below.”Among the more well-known candlestick reversal patterns are soldiers and crows. These occur in a three-candle pattern such as three white soldiers or three black crows. Recently, on the website Candlesticker.com, we learned of two other candle reversal patterns—a bullish one white soldier and a bearish one black crow—that require fewer candles. ”
!A CANDLESTICK STRATEGY WITH SOLDIERS AND CROWS
!Author: Jerry D'Ambrosio & Barbara Star, TASC Oct 2017
!Coded by: Richard Denning 8/05/2017
!www.TradersEdgeSystems.com

!CODING ABBREVIATIONS:
O is [open].
O1 is valresult(O,1).
C is [close].
C1 is valresult(C,1).
C2 is valresult(C,2).
H is [high].
L is [low].
V is [volume].

!INPUTS:
minPriceBull is 1.
minPriceBear is 10.
minVolume is 1000. !in hundreds
volAvgLen is 50.
dayCount is 5.
longExitBars is 7.
shortExitBars is 1.

okToBuy if simpleavg(C,50) > simpleavg(C,200) or CminPriceBull and simpleavg(V,volAvgLen)>minVolume.
BullWS if C1C1 and C>O1 and O= longExitBars.

okToSell if simpleavg(C,50) < simpleavg(C,200) or C>simpleavg(C,200)*1.1.
okToSellMkt if TickerRule("SPX",okToSell).
PVfilterBear if C>minPriceBear and simpleavg(V,volAvgLen).
BearBC if C1>C2 and C1>O1
     and OO1
     and countof(C1>C2,dayCount)=dayCount
     and PVfilterBear and okToSellMkt.
ExitShort if {position days} >= shortExitBars.
I ran several backtests using the NASDAQ 100 list of stocks over the period from 8/04/2000 to 8/04/2017. I varied the following inputs to find the optimum set of parameters for the candlestick patterns. For longs, the “dayCount” = 5 with an “longExitBars” = 7 produced the best results, which is shown in Figure 5. For shorts, the “dayCount” = 5 with a “shortExitBars” = 1 produced the best results, which is shown in Figure 6. Neither commission nor slippage were subtracted from the results.
FIGURE 5: WINWAY. EDS summary report for longs only.
FIGURE 6: WINWAY. EDS summary report for shorts only.
Oct 10, 2017 | Charts, EDS, EDS code, indicators, jay kaeppel
First the Bad News: There are no “magic bullets” when it comes to trading. There are people in this industry who have literally tested somewhere in the range of six bazillion “indicators” – give or take (“Hi. My name is Jay”). Every trend following indicator looks like a gold mine when it latches onto a huge trend and rides it (but not so much when it starts getting whipsawed). And every overbought/oversold indicator looks like a gift from heaven from time to time when it somehow manages to peak (or valley) and then reverses right at a high (or low). And then the next time the thing gets oversold the security in question just keeps plunging and the previously “amazingly accurate” indicator just gets more and more oversold.
Bottom line: what I am about to discuss is likely no better or worse than a lot of other indicators. And it is no holy grail. Still, I kinda like it – or whatever that is worth.
EDITORS NOTE an WinWay EDS file for this indicator with the 3 step rules outlined can be downloaded from here you will need to copy or save this file into your wintes32/eds strategies folder. Alternatively the code is available at the end of this article for copying and pasting into a new EDS file.
UpDays20
I call this indicator UpDays20 and I stole, er, learned it originally from Tom McClellan of McLellan Financial Publications. My calculation may be slightly different because I wanted an indicator that can go both positive and negative.
For a given security look at its trading gains and losses over the latest 20 trading days.
UPDays20 = (Total # of Up days over the last 20 trading days) – 10
So if 10 of the last 20 trading days showed a gain then UpDays20 would read exactly 0.
If only 6 of the last 20 trading days showed a gain then UpDays20 would read -4
You get the idea (and proving once again that it “doesn’t have to be rocket science”). As a “trading method” it is always advised that this indicator – like most all other indicators – NOT be used as a standalone approach to trading. That being said, the way I follow this indicator is as follows.
Step 1) UpDays20 drops to at least -2
Step 2) UpDays20 rises 2 points from a low
Step 3) The security in question then rises above its high for the previous 2 trading days
It is preferable to follow this setup hen the security in question is above its 200-day moving average, but that is up to the trader to decide (the danger to using this with a security below its 200-day moving average is that it might just be in the middle of a freefall. The upside is that counter trend rallies can be fast and furious – even if sometimes short-lived).
Again, there is nothing magic about these particular steps. They are simply designed to do the following:
1) Identify an oversold condition
2) Wait for some of the selling pressure to abate
3) Wait for the security to show some sign of reversing to the upside
Like just about every other indicator/method, sometimes it is uncannily accurate and sometimes it is embarrassingly wrong (hence the reason experienced traders understand that capital allocation and risk management are far more important than the actually method you use to enter trades).
In this previous article (in Figures 3 and 4) I wrote about using this indicator with ticker TLT. Figure 1 and 2 display the “buy” signals generated using the rules above for tickers IYT and GLD.

Figure 1 – UpDays20 “Buy” Alerts for ticker IYT (Courtesy TradingExpert)

Figure 2 – UpDays20 “Buy” Alerts for ticker GLD (Courtesy TradingExpert)
Are these signals good or bad? That is in the eye of the beholder and not for me to say. One big unanswered question is “when do you exit”? That is beyond the scope of this “idea” article – however, “sell some at the first good profit and then use a trailing stop” looks like a decent approach to consider) but would have a profound effect on any actual trading results.
Some of the signals displayed in Figures 1 and 2 are obviously great, others are maybe not so hot. Interestingly, some of the signals in Figure 1 and 2 that don’t look to timely at first blush actually offered a profitable opportunity to a trader who was inclined to take a quick profit. Again, how you allocate capital and when you exit with a profit and when you exit with a loss would likely have as much impact on results as the raw “buy” signals themselves.
Summary
No one should go out and start trying to trade tomorrow based on UpDays20. No claim is being made that the steps detailed herein will result in profits nor even that this is a good way to trade.
But, hey, it’s one way.
Jay Kaeppel Chief Market Analyst at JayOnTheMarkets.com and TradingExpert Pro client.
Disclaimer: The data presented herein were obtained from various third-party sources. While I believe the data to be reliable, no representation is made as to, and no responsibility, warranty or liability is accepted for the accuracy or completeness of such information. The information, opinions and ideas expressed herein are for informational and educational purposes only and do not constitute and should not be construed as investment advice, an advertisement or offering of investment advisory services, or an offer to sell or a solicitation to buy any security.
EDITORS NOTE an WinWay EDS file for this indicator with the 3 step rules outlined can be downloaded from here you will need to copy or save this file into your wintes32/eds strategies folder. Alternatively the code is available at the end of this article for copying and pasting into a new EDS file.
! UpDays20 – I call this indicator UpDays20. For a given security look at its trading gains and losses over the latest 20 trading days.
! UPDays20 = (Total # of Up days over the last 20 trading days) – 10!
So if 10 of the last 20 trading days showed a gain then UpDays20 would read exactly 0.
! If only 6 of the last 20 trading days showed a gain then UpDays20 would read -4
Upday if [close]>val([close],1).
totalupdayslast20days is CountOf(upday,20).
updayindicator is totalupdayslast20days – 10.
! How to follow this indicator
! Step 1) UpDays20 drops to at least -2
! Step 2) UpDays20 rises 2 points from a low
! Step 3) The security in question then rises above its high for the previous 2 trading days
UpDays20rises2points if updayindicator>valresult(updayindicator,1) and valresult(updayindicator,1)>valresult(updayindicator,2).
updays20atminus2orlower if valresult(updayindicator,2)<=-2.
closesabovehighof2priordays if [close]>val([high],1) and [close]>val([high],2).
Upsignal if UpDays20rises2points and updays20atminus2orlower and closesabovehighof2priordays.
May 8, 2017 | bonds, EDS, EDS code, educational newsletters, ETFs, jay kaeppel
There is great trepidation in the bond market these days. Most investors seem to have the “interest rates are sure to rise” mantra playing on auto loop in their head. And this is not entirely unwarranted. Given the historical tendency for bond yields to move in long, slow trends (20 years or more essentially in one direction is not uncommon), I for one am pretty confident in believing that interest rates will be higher 20 years from now than they are now.
But that is not the fear that is playing in people’s heads. The fear in people’s heads is that rates are rising soon (like immediately) and in a big way. This however, may or may not prove to be the case.
Figure 1 displays a history of 10-year treasury yields through about 2012 (FYI 10-yr. yields are roughly in changed since that time). Note the long-term nature of interest rate trends and that while there are “spikes” here and there, most major moves play out over time and not in “here today, sharply higher tomorrow” fashion.
Also, you can see in Figure 2 – one can make a compelling argument that bond yields are not “officially rising”, at least not yet.
Figure 2 – Yields still “officially” in a downtrend
Bonds are Due to Bounce – But Will They?
One way to identify important turning points in any market is when a market doesn’t do something that it would normally be expected to do. For example, here is a simple thought process:
1) The bond market is oversold
2) In the past 30 years, pretty much anytime it would get oversold a rally ensued
3) Therefore, bonds should rally soon
But will they – that is the question. And in my opinion, the answer is important.
*If bonds rally soon (i.e., over the course of say the next several months) then “the status may still be quo”.
*If bonds do not rally soon, then it may be a sign that “things are changing”
Which Way Bonds?
Figures 3 and 4 below display ticker TLT (an ETF that tracks the long-term treasury bond) with an indicator I call UpDays20. In this case we are looking at weekly bars and not daily bars, but the concept is the same.
UpDays20 is calculated by simply adding up all of the weeks that have showed a weekly gain over the past 20 weeks and then subtracting 10 (the WinWay Charts Expert Design Studio code appears at the end of this article, after the disclaimer).
If 10 of the past 20 weeks have showed a weekly gain then the upDays20 indicator will read 0 (i.e., a total of 10 weeks were up minus 10 = 0). If only 6 weeks showed a gain in the past 20 weeks then the UpDays20 indicator will read -4, etc.
What to look for: Typically (at least in the declining rate environment of recent decades) when UpDays20 rises by a value of 2 from a low of -2 or less, a decent rally in bonds has ensued.
For example, if UpDays20 falls to -4 then a rise to -2 or higher triggers a buy signal. If it falls only as low as -3 then a rise to -1 or higher is required. If it falls only as low as -2 then a rise to 0 or higher is required.
Figures 3 and 4 highlight signals since roughly 2004.
Figure 3 – Ticker TLT with UpDays20 weekly buy signals (2004-2010); (Courtesy
WinWay TradingExpert )
Figure 4 – Ticker TLT with UpDays20 weekly buy signals (2010-2017); (Courtesy
WinWay TradingExpert )
As you can see in Figures 3 and 4, most of the signals highlighted were followed by at least a decent short-term rally.
In 2017, buy signals from the UpDays20 indicator occurred on 1/13 and 4/14. TLT is up +0.3% since the 1/13 signal and down -1.4% since the 4/14 signal.
Summary
Either:
1) This is an excellent time to buy the long-term bond (looking for at least a short to intermediate term rally) as a rally is overdue
OR
2) The “times they may be a changing” for bonds
So keep an eye on TLT over the next several months.
Jay Kaeppel
Disclaimer: The data presented herein were obtained from various third-party sources. While I believe the data to be reliable, no representation is made as to, and no responsibility, warranty or liability is accepted for the accuracy or completeness of such information. The information, opinions and ideas expressed herein are for informational and educational purposes only and do not constitute and should not be construed as investment advice, an advertisement or offering of investment advisory services, or an offer to sell or a solicitation to buy any security.
WinWay TradingExpert Expert Design Studio Code for UpDays20
Up1 if [close] > val([close],1).
Up2 if val([close],1) > val([close],2).
Up3 if val([close],2) > val([close],3).
Up4 if val([close],3) > val([close],4).
Up5 if val([close],4) > val([close],5).
Up6 if val([close],5) > val([close],6).
Up7 if val([close],6) > val([close],7).
Up8 if val([close],7) > val([close],8).
Up9 if val([close],8) > val([close],9).
Up10 if val([close],9) > val([close],10).
Up11 if val([close],10) > val([close],11).
Up12 if val([close],11) > val([close],12).
Up13 if val([close],12) > val([close],13).
Up14 if val([close],13) > val([close],14).
Up15 if val([close],14) > val([close],15).
Up16 if val([close],15) > val([close],16).
Up17 if val([close],16) > val([close],17).
Up18 if val([close],17) > val([close],18).
Up19 if val([close],18) > val([close],19).
Up20 if val([close],19) > val([close],20).
UpCount is (Up1+ Up2+Up3+Up4+Up5+Up6+Up7+Up8+Up9+Up10+Up11+Up12+Up13+Up14+Up15+Up16+Up17+Up18+Up19+Up20)-10.
Mar 21, 2017 | EDS, EDS code, Moving averages, Stock trading
Please note that I tested the author’s system using the NASDAQ 100 list of stocks on daily bars rather than intraday bars from 12/31/2008 thru 2/10/2017. Figure 7 shows the resulting equity curve trading the author’s system with the cross-down exit. Figure 8 shows the ASA report for this test. The annualized return showed about a 17% return with a maximum drawdown of 19%.
FIGURE 7: Here are sample test results from the WinWay Portfolio Manager taking three signals per day and 10 concurrent positions maximum run on NASDAQ 100 stocks (daily bar data) over the period 12/31/08 to 2/10/07.
FIGURE 8: This shows the ASA report for the system, which shows the test metrics and settings.
!Volume-Weighted Moving Average Breakouts
!Author: Ken Calhoun, TASC Apr 2017
!Coded by: Richard Denning 2/11/17
!www.TradersEdgeSystems.com

!INPUTS:
smaLen is 70.
vwmaLen is 50.

SMA is simpleavg([close],smaLen).
VWMA is sum([close]*[volume],vwmaLen)/sum([volume],vwmaLen).
HasData if hasdatafor(max(smaLen,vwmaLen)+10)>max(smaLen,vwmaLen).
Buy if SMA < VWMA and valrule(SMA > VWMA,1) and HasData.
Sell if SMA > VWMA.

rsVWMA is VWMA / valresult(VWMA,vwmaLen)-1.
rsSMA is SMA / valresult(SMA,smaLen)-1.
Feb 16, 2017 | EDS, EDS code, indicators, Stocks & Commodities Traders Tips
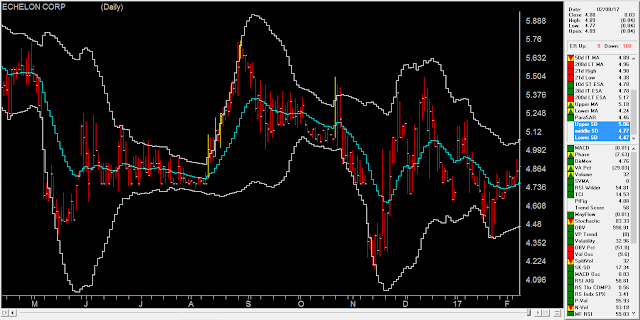
The AIQ code based on Vitali Apirine’s article in the 2017 issue of Stocks & Commodities magazine, “Exponential Standard Deviation Bands”
Editor note: “Author Vitali Apirine presented a method intended to help traders see volatility while a stock is trending. These bands, while similar to Bollinger Bands, are calculated using exponential moving averages rather than simple moving averages.
Like Bollinger Bands, they widen when volatility increases and narrow as volatility decreases. He suggests that the indicator can be used as a confirming indication along with other indicators such as the ADX.
Here’s a WinWay Chart with the Upper, Lower and Middle Exponential SD added as custom indicators.”
To compare the exponential bands to Bollinger Bands, I created a trend-following trading system that trades long only according to the following rules:
- Buy when there is an uptrend and the close crosses over the upper band. An uptrend is in place when the middle band is higher than it was one bar ago.
- Sell when the low is less than the lower band.
Figure 8 shows the summary test results for taking all signals from the Bollinger Band system run on NASDAQ 100 stocks over the period 12/9/2000 to 12/09/2016. Figure 9 shows the summary test results for taking all signals from the exponential band system on NASDAQ 100 stocks over the same period. The exponential band system improved the average profit per trade while reducing the total number of trades.
FIGURE 8: WinWay EDS. Here are summary test results for taking all signals from the Bollinger Band system run on NASDAQ 100 stocks over the period 12/9/2000 to 12/09/2016.

FIGURE 9: WinWay EDS. Here are summary test results for taking all signals from the exponential band system run on NASDAQ 100 stocks over the period 12/9/2000 to 12/09/2016.
!Exponential Standard Deviation Bands
!Author: Vitali Apirine, TASC February 2017
!Coded by: Richard Denning 12/11/2016
!INPUT:
xlen is 20.
numSD is 2.
!INDICATOR CODE:
ExpAvg is expavg([close],xlen).
Dev is [close] – ExpAvg.
DevSqr is Dev*Dev.
SumSqr is sum(DevSqr,xlen).
AvgSumSqr is SumSqr / xlen.
ExpSD is sqrt(AvgSumSqr).
!UPPER EXPONENTIAL SD BAND:
UpExpSD is ExpAvg + numSD*ExpSD. !PLOT ON CHART
!LOWER EXPONENTIAL SD BAND:
DnExpSD is ExpAvg – numSD*ExpSD. !PLOT ON CHART
!MIDDLE EXPONENTIAL SD BAND:
MidExpSD is ExpAvg.
!BOLLINGER BANDS FOR COMPARISON:
DnBB is [Lower BB]. !Lower Bollinger Band
UpBB is [Upper BB]. !Upper Bollinger Band
MidBB is simpleavg([close],xlen). !Middle Bollinger Band
!REPORT RULE TO DISPLAY VALUES:
ShowValures if 1.
!TRADING SYSTEM USING EXPPONENTIAL SD BANDS:
UpTrend if MidExpSD > valresult(MidExpSD,1).
BreakUp if [close] > UpExpSD.
BuyExpSD if UpTrend and BreakUp and valrule(Breakup=0,1).
ExitExpSD if [Low] < DnExpSD. ! or UpTrend=0. !TRADING SYSTEM USING BOLLINGER BANDS: UpTrendBB if MidBB > valresult(MidBB,1).
BreakUpBB if [close] > UpBB.
BuyBB if UpTrendBB and BreakUpBB and valrule(BreakupBB=0,1).
ExitBB if [Low] < DnBB. ! or UpTrend=0.