Dec 21, 2013 | Uncategorized
This article presents another twist to the one I posted a few days ago titled “A Trader’s Guide to Buying the Dips”. This article presents a variation known as “Jay’s Pullback System”
First let’s look at the building blocks:
A = S&P 500 daily close
B = 10-day simple moving average of S&P 500 daily close
C = (A – B)
Buy Signal = Variable C declines for 3 or more consecutive days
In a nutshell, if the difference between the S&P 500 index (SPX) and its own 10-day moving average declines for 3 straight days we consider this to be a “pullback”, and thus a buying opportunity.
Trading Rules for Basic System:
When Variable C declines for 3 straight days, buy and hold the S&P 500 Index for 5 trading days. If the decline in Variable C extends itself one or more days, then extend the holding period for that many trading days.
So for example, if Variable C declined for 5 straight trading days, one would buy at the close of the third trading day and then hold for seven trading days
Day Variable C Action Position
1 Down
2 Down
3 Down Buy at close (hold for 5 days)
4 Down Hold (Var. C down again; hold for 5 days) Long
5 Down Hold (Var. C down again; hold for 5 days) Long
6 Up Hold (for 4 days) Long
7 Down Hold (for 3 days) Long
8 Up Hold (for 2 days) Long
9 Down Hold (for 1 day) Long
10 Up Sell at close Long; Flat at close
Figure 1 displays “bullish days for SPX in green. In the lower clip we see the difference between the close and the 10-day moving average (i.e., Variable C). A “bullish” period is signaled when that value declines for 3 straight days
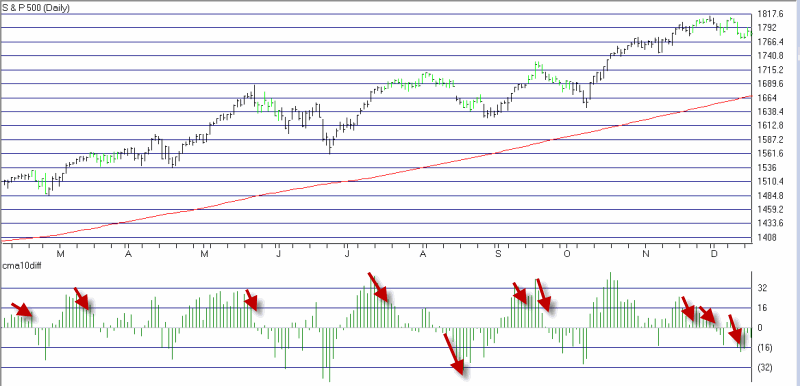 Figure 1 – Basic System bullish days for SPX (Courtesy AIQ TradingExpert)
Results:
This is a very rudimentary “system” and not suitable for many traders (note this raw system includes no stop-loss provision and does not attempt to filter for and trade with the major trend).
In any event, let’s look at what would have happened if one had followed the rules and held the S&P 500 for 5 trading days following every decline in Variable C of 3 days or more, and earned 1% of annual interest while out of the market. Those results are displayed (along with the growth of $1,000 achieved by buying and holding the S&P 500 Index) in Figure 2.
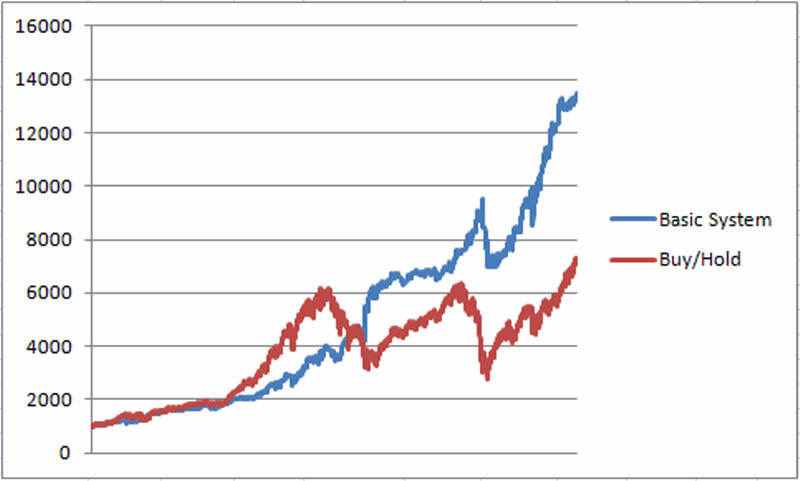 Figure 2 – Simple Pullback Systems (blue line) versus Buy and Hold (red line) Dec 1987 to present
Results:
-$1,000 invested using this system grew to $13,249 (+1,225%)
-$1,000 invested using buy-and-hold grew to $7,208 (+621%)
So we can reasonably state that these results are pretty good. Can they be improved? Let’s see.
Jay’s Pullback System
With this system we will filter for the trend and at times use leverage.
First we will note if the daily close for the S&P 500 Index is above or below its own 250-day moving average.
If Variable C above declines in value 3 straight days:
-If SPX > 250-day moving average we will buy using leverage of 2-to-1
-If SPX < 250-day moving average we will buy using no leverage
-Interest of 1% per year will be assumed when out of the market.
The results of this test appear in Figure 3.
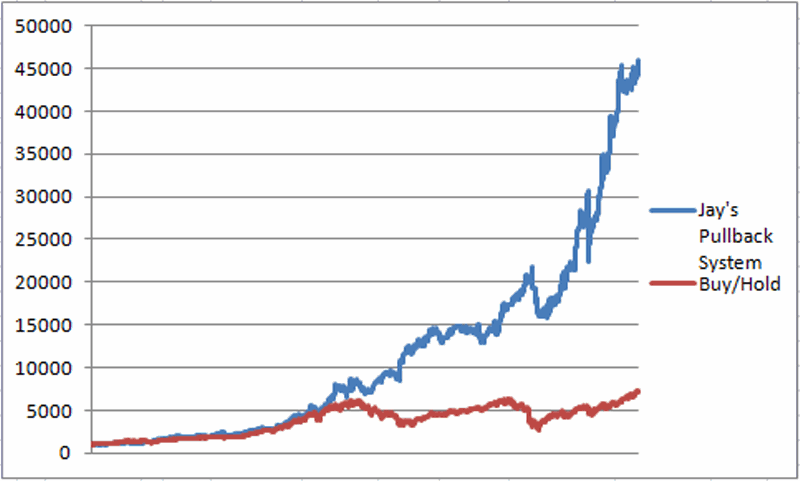 Figure 3 – Jay’s Pullback System: Growth of $1,000 (blue line) versus buy and hold (red line; Dec 1987-present
Results:
-$1,000 invested using Jay’s Pullback System grew to $44,541 (+4.354%)
-$1,000 invested using buy-and-hold grew to $7,208 (+621%)
Funds to Use
Mutual Fund: Profunds ticker BLPIX (S&P x 1)
Mutual Fund: Profunds ticker ULPIX (S&P x 2)
ETF: Ticker SPY (S&P 500 x 1)
ETF: Ticker SSO (S&P 500 x 2)
Summary
While the numbers for the leveraged system look pretty good, it should be noted that there are no stop-loss provisions incorporated. Before you decide to run off and trade any system – particularly one that may use leveraged funds or ETFs, you ought to do some homework and make sure you fully understand and can tolerate the risks involved.
Still, the real point of all of this is simply to note that buying on dips is a valid approach to trade the stocks markets.
Jay Kaeppel
Chief Market Analyst at JayOnTheMarkets.com and AIQ TradingExpert Pro (http://www.aiq.com) client
Jay has published four books on futures, option and stock trading. He was Head Trader for a CTA from 1995 through 2003. As a computer programmer, he co-developed trading software that was voted “Best Option Trading System” six consecutive years by readers of Technical Analysis of Stocks and Commodities magazine. A featured speaker and instructor at live and on-line trading seminars, he has authored over 30 articles in Technical Analysis of Stocks and Commodities magazine, Active Trader magazine, Futures & Options magazine and on-line at www.Investopedia.com.
Dec 21, 2013 | trading strategies
This article presents another twist to the one I posted a few days ago titled “A Trader’s Guide to Buying the Dips”. This article presents a variation known as “Jay’s Pullback System”
First let’s look at the building blocks:
A = S&P 500 daily close
B = 10-day simple moving average of S&P 500 daily close
C = (A – B)
Buy Signal = Variable C declines for 3 or more consecutive days
In a nutshell, if the difference between the S&P 500 index (SPX) and its own 10-day moving average declines for 3 straight days we consider this to be a “pullback”, and thus a buying opportunity.
Trading Rules for Basic System:
When Variable C declines for 3 straight days, buy and hold the S&P 500 Index for 5 trading days. If the decline in Variable C extends itself one or more days, then extend the holding period for that many trading days.
So for example, if Variable C declined for 5 straight trading days, one would buy at the close of the third trading day and then hold for seven trading days
Day Variable C Action Position
1 Down
2 Down
3 Down Buy at close (hold for 5 days)
4 Down Hold (Var. C down again; hold for 5 days) Long
5 Down Hold (Var. C down again; hold for 5 days) Long
6 Up Hold (for 4 days) Long
7 Down Hold (for 3 days) Long
8 Up Hold (for 2 days) Long
9 Down Hold (for 1 day) Long
10 Up Sell at close Long; Flat at close
Figure 1 displays “bullish days for SPX in green. In the lower clip we see the difference between the close and the 10-day moving average (i.e., Variable C). A “bullish” period is signaled when that value declines for 3 straight days
Figure 1 – Basic System bullish days for SPX (Courtesy AIQ TradingExpert)
Results:
This is a very rudimentary “system” and not suitable for many traders (note this raw system includes no stop-loss provision and does not attempt to filter for and trade with the major trend).
In any event, let’s look at what would have happened if one had followed the rules and held the S&P 500 for 5 trading days following every decline in Variable C of 3 days or more, and earned 1% of annual interest while out of the market. Those results are displayed (along with the growth of $1,000 achieved by buying and holding the S&P 500 Index) in Figure 2.
Figure 2 – Simple Pullback Systems (blue line) versus Buy and Hold (red line) Dec 1987 to present
Results:
-$1,000 invested using this system grew to $13,249 (+1,225%)
-$1,000 invested using buy-and-hold grew to $7,208 (+621%)
So we can reasonably state that these results are pretty good. Can they be improved? Let’s see.
Jay’s Pullback System
With this system we will filter for the trend and at times use leverage.
First we will note if the daily close for the S&P 500 Index is above or below its own 250-day moving average.
If Variable C above declines in value 3 straight days:
-If SPX > 250-day moving average we will buy using leverage of 2-to-1
-If SPX < 250-day moving average we will buy using no leverage
-Interest of 1% per year will be assumed when out of the market.
The results of this test appear in Figure 3.
Figure 3 – Jay’s Pullback System: Growth of $1,000 (blue line) versus buy and hold (red line; Dec 1987-present
Results:
-$1,000 invested using Jay’s Pullback System grew to $44,541 (+4.354%)
-$1,000 invested using buy-and-hold grew to $7,208 (+621%)
Funds to Use
Mutual Fund: Profunds ticker BLPIX (S&P x 1)
Mutual Fund: Profunds ticker ULPIX (S&P x 2)
ETF: Ticker SPY (S&P 500 x 1)
ETF: Ticker SSO (S&P 500 x 2)
Summary
While the numbers for the leveraged system look pretty good, it should be noted that there are no stop-loss provisions incorporated. Before you decide to run off and trade any system – particularly one that may use leveraged funds or ETFs, you ought to do some homework and make sure you fully understand and can tolerate the risks involved.
Still, the real point of all of this is simply to note that buying on dips is a valid approach to trade the stocks markets.
Jay Kaeppel
Chief Market Analyst at JayOnTheMarkets.com and AIQ TradingExpert Pro (http://www.aiq.com) client
Jay has published four books on futures, option and stock trading. He was Head Trader for a CTA from 1995 through 2003. As a computer programmer, he co-developed trading software that was voted “Best Option Trading System” six consecutive years by readers of Technical Analysis of Stocks and Commodities magazine. A featured speaker and instructor at live and on-line trading seminars, he has authored over 30 articles in Technical Analysis of Stocks and Commodities magazine, Active Trader magazine, Futures & Options magazine and on-line at www.Investopedia.com.
Dec 19, 2013 | Uncategorized
As of 12/13/2013, the S&P 500 has declined for three consecutive days. Should you care? Well, perhaps. In Figure 1 we see the growth of $1,000 achieved as follows:
-When the S&P 500 registers 3 (or more) consecutive lower closes, buy and hold for the next 5 trading days.
To be clear, the results shown here assume that you buy at the close of the 3rd consecutive down day and plan on holding a long position in the S&P 500 for the at least the next 5 trading days. This holding period is extended one day for each additional day the S&P declines consecutively. In other words of the S&P 500 declines for 5 consecutive days, you would buy at the close of the 3rd consecutive down day and hold for 7 trading days.
Not sure of that explanation helped or made things more confusing but there you have it.
 Figure 1 – Growth of $1,000 invested in S&P 500 after 3 (or more) consecutive down closes (December 1987 to present)
In this test, an initial $1,000 grew to $9,869, or +887% (no slippage, commissions, taxes, dividends, interest, etc., just raw price return), with a maximum drawdown of -19.3%.
Filtering for Trend
One of the dangers of this approach is the “Are You Sure You Want to Try to Catch that Falling Safe?” conundrum. So what happens if we only take the trades that occur when the S&P 500 is in an established uptrend? If we only take the trades that occur when the S&P 500 is above its 250-day moving average we get some Bad News and some Good News.
The Bad News is that $1,000 grows to $3,935, or +293%. So clearly a lot of profit potential left on the table.
The Good News is that the maximum drawdown using this method is only a very manageable -9.8%.
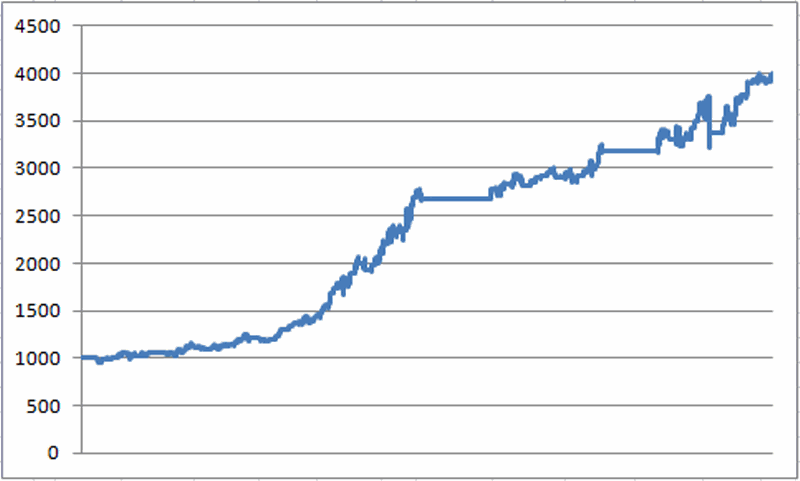 Figure 2 – Growth of $1,000 invested in S&P 500 after 3 (or more) consecutive down closes (December 1987 to present) only when S&P 500 is ABOVE its 250-day moving average
Using Leverage
Figure 3 displays the growth of $1,000 using the following assumptions:
-If the S&P 500 declines 3 or more consecutive days AND the S&P 500 is BELOW its 200-day moving average, buy and hold the S&P 500 index for 5 trading days
-If the S&P 500 declines 3 or more consecutive days AND the S&P 500 is ABOVE its 250-day moving average, buy and hold the S&P 500 index using leverage of 2-to-1 (via a leveraged ETF or mutual fund) for 5 trading days
-For this test we assume that an annualized rate of 1% interest is earned when no position is held.
In a nutshell, if the stock market is in an objectively identified up trend (i.e., close above 200-day moving average) we will attempt to press our advantage by using 2-to-1 leverage. When the S&P 500 is below its 250-day moving average we will eschew the use of leverage.
The results for this test appear in Figure 3.
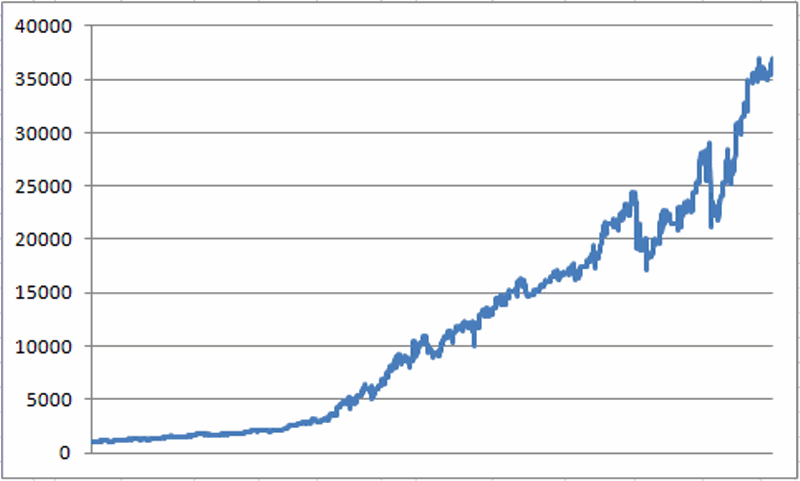 Figure 3 – Growth of $1,000 invested in S&P 500 after 3 (or more) consecutive down closes using 2-to-1 leverage if S&P 500 > 250-day moving average (December 1987 to present)
Using this approach $1,000 grew to $35,868, or +3,469% (albeit with a maximum drawdown of -20.2%).
Funds to Use
Mutual Fund: Profunds ticker BLPIX (S&P x 1)
Mutual Fund: Profunds ticker ULPIX (S&P x 2)
ETF: Ticker SPY (S&P 500 x 1)
ETF: Ticker SSO (S&P 500 x 2)
Summary
Does this simple method represent the “Holy Grail of Trading?” Of course not. Is it even better than whatever system you are using right now? I can’t answer that, only you can. But the main point here is simply to note that dips in the stock market – even in the face of an overall downtrend – tend to be buying opportunities (at least in the short run).
The simple rules presented here represent just one way to exploit this fact.
Jay Kaeppel
Chief Market Analyst at JayOnTheMarkets.com and AIQ TradingExpert Pro (http://www.aiq.com) client
Jay has published four books on futures, option and stock trading. He was Head Trader for a CTA from 1995 through 2003. As a computer programmer, he co-developed trading software that was voted “Best Option Trading System” six consecutive years by readers of Technical Analysis of Stocks and Commodities magazine. A featured speaker and instructor at live and on-line trading seminars, he has authored over 30 articles in Technical Analysis of Stocks and Commodities magazine, Active Trader magazine, Futures & Options magazine and on-line at www.Investopedia.com.
Dec 19, 2013 | trading strategies
As of 12/13/2013, the S&P 500 has declined for three consecutive days. Should you care? Well, perhaps. In Figure 1 we see the growth of $1,000 achieved as follows:
-When the S&P 500 registers 3 (or more) consecutive lower closes, buy and hold for the next 5 trading days.
To be clear, the results shown here assume that you buy at the close of the 3rd consecutive down day and plan on holding a long position in the S&P 500 for the at least the next 5 trading days. This holding period is extended one day for each additional day the S&P declines consecutively. In other words of the S&P 500 declines for 5 consecutive days, you would buy at the close of the 3rd consecutive down day and hold for 7 trading days.
Not sure of that explanation helped or made things more confusing but there you have it.
Figure 1 – Growth of $1,000 invested in S&P 500 after 3 (or more) consecutive down closes (December 1987 to present)
In this test, an initial $1,000 grew to $9,869, or +887% (no slippage, commissions, taxes, dividends, interest, etc., just raw price return), with a maximum drawdown of -19.3%.
Filtering for Trend
One of the dangers of this approach is the “Are You Sure You Want to Try to Catch that Falling Safe?” conundrum. So what happens if we only take the trades that occur when the S&P 500 is in an established uptrend? If we only take the trades that occur when the S&P 500 is above its 250-day moving average we get some Bad News and some Good News.
The Bad News is that $1,000 grows to $3,935, or +293%. So clearly a lot of profit potential left on the table.
The Good News is that the maximum drawdown using this method is only a very manageable -9.8%.
Figure 2 – Growth of $1,000 invested in S&P 500 after 3 (or more) consecutive down closes (December 1987 to present) only when S&P 500 is ABOVE its 250-day moving average
Using Leverage
Figure 3 displays the growth of $1,000 using the following assumptions:
-If the S&P 500 declines 3 or more consecutive days AND the S&P 500 is BELOW its 200-day moving average, buy and hold the S&P 500 index for 5 trading days
-If the S&P 500 declines 3 or more consecutive days AND the S&P 500 is ABOVE its 250-day moving average, buy and hold the S&P 500 index using leverage of 2-to-1 (via a leveraged ETF or mutual fund) for 5 trading days
-For this test we assume that an annualized rate of 1% interest is earned when no position is held.
In a nutshell, if the stock market is in an objectively identified up trend (i.e., close above 200-day moving average) we will attempt to press our advantage by using 2-to-1 leverage. When the S&P 500 is below its 250-day moving average we will eschew the use of leverage.
The results for this test appear in Figure 3.
Figure 3 – Growth of $1,000 invested in S&P 500 after 3 (or more) consecutive down closes using 2-to-1 leverage if S&P 500 > 250-day moving average (December 1987 to present)
Using this approach $1,000 grew to $35,868, or +3,469% (albeit with a maximum drawdown of -20.2%).
Funds to Use
Mutual Fund: Profunds ticker BLPIX (S&P x 1)
Mutual Fund: Profunds ticker ULPIX (S&P x 2)
ETF: Ticker SPY (S&P 500 x 1)
ETF: Ticker SSO (S&P 500 x 2)
Summary
Does this simple method represent the “Holy Grail of Trading?” Of course not. Is it even better than whatever system you are using right now? I can’t answer that, only you can. But the main point here is simply to note that dips in the stock market – even in the face of an overall downtrend – tend to be buying opportunities (at least in the short run).
The simple rules presented here represent just one way to exploit this fact.
Jay Kaeppel
Chief Market Analyst at JayOnTheMarkets.com and AIQ TradingExpert Pro (http://www.aiq.com) client
Jay has published four books on futures, option and stock trading. He was Head Trader for a CTA from 1995 through 2003. As a computer programmer, he co-developed trading software that was voted “Best Option Trading System” six consecutive years by readers of Technical Analysis of Stocks and Commodities magazine. A featured speaker and instructor at live and on-line trading seminars, he has authored over 30 articles in Technical Analysis of Stocks and Commodities magazine, Active Trader magazine, Futures & Options magazine and on-line at www.Investopedia.com.
Dec 12, 2013 | Uncategorized
2013 Market Year in Review
The analysis is actually pretty simple:
Stocks:
Financial, World and Economic News: BAD
Stock Market Performance: GREAT!
Bonds:
Investor A: Hey, have you noticed that t-bond yields have hit a 15 month high? Investor B: What, me worry?
Gold:
Ppppppphhhhhhhhttttttt!
So it is pretty obvious at this point that stocks were the place to be in 2013 (which is maybe why the Investors Intelligence poll registers just 14% bears). Of course, no one is ever content with that kernel of knowledge. We want to know what’s going to happen in the future. In fact the investing public is so hungry for “advance” knowledge that there are now thousands of pundits out there offering all kinds of wildly differing opinions.
So all the investor has to do is decide which opinion they “want to believe”, find a pundit offering that opinion, and “Voila” – they have “expert confirmation” that their opinion is “correct.”
And so it goes, and so it goes.
Meanwhile, back here in reality land, a simple trend-following approach can reap many benefits, especially when the following mantra is true for the stock market:
“If the Fed is pumpin’, the stock market’s jumpin’.” Period. End of analysis.
The Right Way and the Wrong Way to Look at Trend Following Methods
There is a right way and a wrong way to look at trend-following indicators:
The Wrong Way: “Wow, my handy dandy trend following indicator is bullish at the moment, therefore I can extrapolate this out to mean that this bullish trend will continue for some time to come.”
The Right Way: “Well, the trend is up at the moment, but of course this could change at any moment, so while I won’t panic and sell everything as long as the trend is still up, I will check back often and if the trend changes I will change my thinking and actions accordingly.”
The most important thing to remember about trend-following indicators is this:
-There is no “prediction” built into the current reading
In other words, a trend-following method does nothing more than identify the current trend right now. Tomorrow is a different day. While this may not “sound” as useful as some fancy indicator that portends to be able to predict the future, in reality it is actually much more useful.
Likewise, also remember that there is no humanly possible way to eliminate occasional whipsaws when using moving averages. So learn to live with it.
Trend-Following Indicators I Have Known and, er, Followed(?)
None of the indicators or methods that I will discuss next will ever pick a bottom or a top. In fact, they may not even really impress you in any way. At least not until you find yourself on the sidelines while the market is powering higher without you on board. So here are a couple of simple trend-following indicators to keep in mind:
The 200-day Moving Average
OK, this one is so basic and so commonly followed that it gets dismissed by some people. But Figure 1 displays a variety of markets during different time frames. In fact, an investor who simply fought the urge to fight the trend would have enjoyed riding some nice uptrends (particularly in the stock market) and avoided a lot of pain (most notably in bonds and gold).
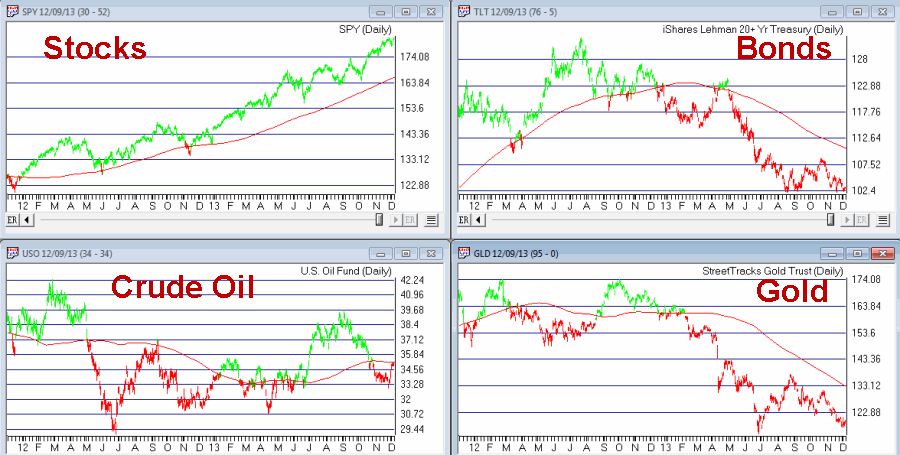 Figure 1 – Four Markets with 200-day simple moving average (Courtesy AIQ TradingExpert)
The Bowtie Pattern
I learned the Bowtie pattern from David Steckler (http://www.etfroundup.com/), who in turn learned it from David Landry (www.davelandry.com). It involves three moving averages:
-10-day simple moving average
-20-day exponential moving average
-30-day exponential moving average
A Bullish signal occurs when the 10-day is above the 20-day and the 20-day is above the 30-day.
A Bearish signal occurs when the 10-day is below the 20-day and the 20-day is below the 30-day.
As usual, different traders use things in different ways. David likes to enter as soon as a new trend emerges, I prefer to look for pullbacks within an established trend. I suggest you explore both possibilities.
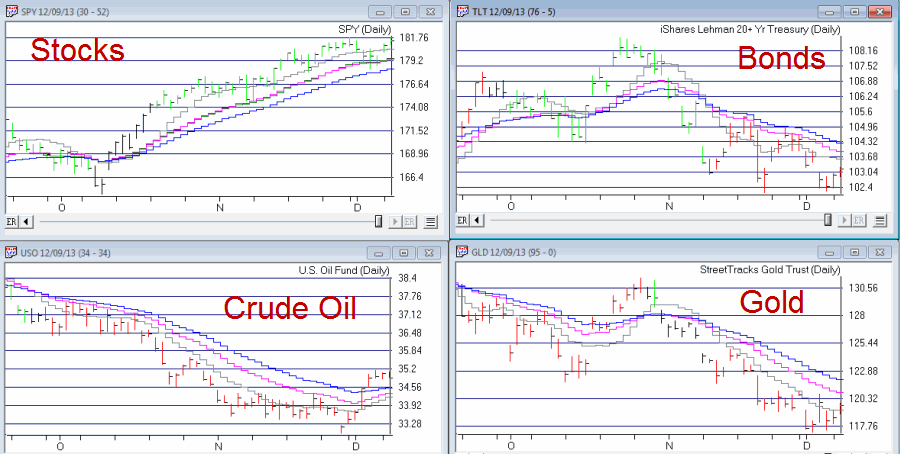 Figure 2 – Four Markets with 10-day simple, and 20 and 30-day exponential averages (Courtesy AIQ TradingExpert)
The 13-55 Exponential Moving Average
OK, at some point one moving average method looks pretty much like every other moving average method. In fact that is actually the case. Linda Bradford Raschke of Market Wizards fame (www.LBRGroup.com) once stated (OK, for the record, I am paraphrasing here) that “there is no one best moving average method, so just pick something and go with it.”
One more combination that I like as an intermediate term guide is the 13-day and 55-day exponential moving average combination as shown in Figure 3.
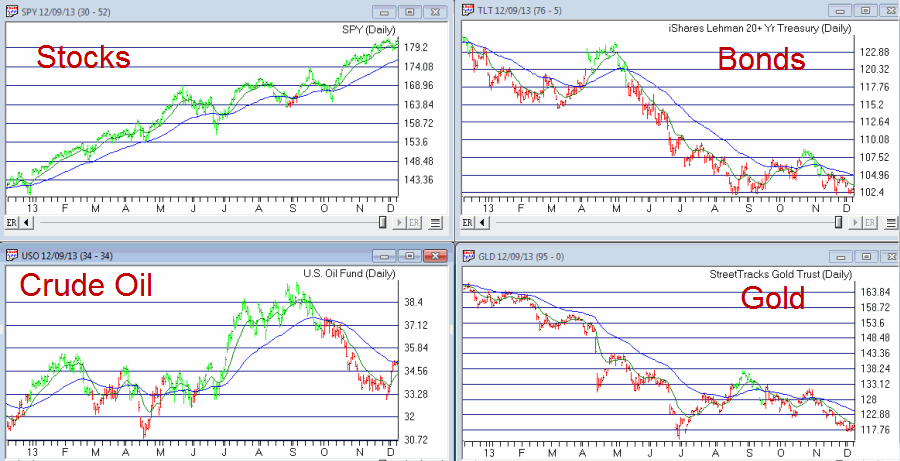 Figure 3 – Four Markets with 13-day and 55-day exponential averages (Courtesy AIQ TradingExpert)
Summary
I encourage you to take a closer look at all of the combinations I’ve mentioned above. Remember two things:
-If you try to use them as Standalone systems (i.e., buying at every bullish signal and selling at every bearish signal) you are likely to be disappointed.
-The real power comes from using methods like the ones I’ve shown to objectively identify the current major trend, and then figuring out ways to trade in line with the major trend.
Jay Kaeppel
Chief Market Analyst at JayOnTheMarkets.com and AIQ TradingExpert Pro (http://www.aiq.com) client
Jay has published four books on futures, option and stock trading. He was Head Trader for a CTA from 1995 through 2003. As a computer programmer, he co-developed trading software that was voted “Best Option Trading System” six consecutive years by readers of Technical Analysis of Stocks and Commodities magazine. A featured speaker and instructor at live and on-line trading seminars, he has authored over 30 articles in Technical Analysis of Stocks and Commodities magazine, Active Trader magazine, Futures & Options magazine and on-line at www.Investopedia.com.
