Jan 28, 2014 | Uncategorized
Hi, my name is Jay and I am a Seasonalaholic.
Now typically when someone confesses to being an “aholic” of some sort or another it because they recognize they have a problem and wish to correct it. That’s not the case here. In fact the “support” group that I belong to is not “Seasonalaholics Anonymous” but rather “Seasonalaholics Unanimous!” (OK, in the interest of full disclosure, so far I am the only member and yes, the monthly meetings aren’t terribly lively, but I digress).
Still I can’t help but think there are others out there who might join someday – especially after they consider things like the seasonal tendencies for retailing stocks. To whit: what would have happened had an investor invested in Fidelity Select Sector Retailing fund (ticker FSRPX):
-During the months of February, March, October and November
-And then earned 1% of annualized interest while out of the market the other 8 months.
The answer is contained in Figure 1 which displays the growth of $1,000 invested as described above.
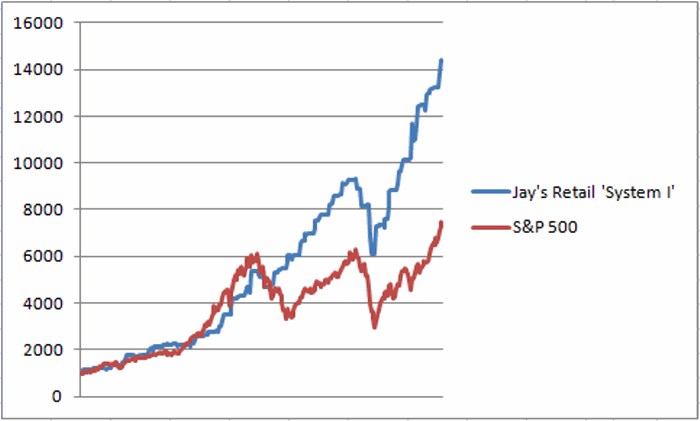 Figure 1 – Growth of $1,000 invested in FSRPX during February, March, October, November (blue line) versus buying and holding the S&P 500 red line) since January 1988.
Now it is pretty impossible to not notice the, ahem, “slight drawdown” experienced during the October, November 2008 period. Still, despite the fact that I have tried very hard scrub that particular time period from my memory bank, I still have some vague recollection that virtually no sector of the stock market was left unscathed during that period. And the rebound has been pretty nice.
So is this really a viable strategy? Well, under the category of “Everything is Relative”, Figure 2 displays the year-by-year performance of this “system” versus buying and holding the SP 500.
|
System |
SP 500 |
|
System |
SP 500 |
|
Annual % |
Annual % |
Difference |
$1,000
|
$1,000
|
|
1988
|
18.6
|
12.4
|
6.2
|
1,186
|
1,124
|
|
1989
|
(1.0)
|
27.3
|
(28.2)
|
1,174
|
1,430
|
|
1990
|
21.3
|
(6.6)
|
27.8
|
1,424
|
1,336
|
|
1991
|
16.2
|
26.3
|
(10.1)
|
1,654
|
1,688
|
|
1992
|
20.4
|
4.5
|
15.9
|
1,992
|
1,763
|
|
1993
|
6.2
|
7.1
|
(0.9)
|
2,115
|
1,888
|
|
1994
|
(1.5)
|
(1.5)
|
0.0
|
2,083
|
1,859
|
|
1995
|
2.3
|
34.1
|
(31.8)
|
2,131
|
2,493
|
|
1996
|
17.4
|
20.3
|
(2.9)
|
2,500
|
2,998
|
|
1997
|
11.9
|
31.0
|
(19.1)
|
2,798
|
3,927
|
|
1998
|
40.1
|
26.7
|
13.4
|
3,919
|
4,975
|
|
1999
|
10.8
|
19.5
|
(8.7)
|
4,344
|
5,946
|
|
2000
|
8.5
|
(10.1)
|
18.7
|
4,714
|
5,343
|
|
2001
|
3.1
|
(13.0)
|
16.1
|
4,859
|
4,646
|
|
2002
|
12.8
|
(23.4)
|
36.2
|
5,480
|
3,561
|
|
2003
|
9.1
|
26.4
|
(17.3)
|
5,977
|
4,500
|
|
2004
|
12.8
|
9.0
|
3.8
|
6,744
|
4,905
|
|
2005
|
8.5
|
3.0
|
5.5
|
7,316
|
5,052
|
|
2006
|
9.2
|
13.6
|
(4.4)
|
7,991
|
5,740
|
|
2007
|
(2.4)
|
3.5
|
(6.0)
|
7,797
|
5,943
|
|
2008
|
(32.0)
|
(38.5)
|
6.5
|
5,303
|
3,656
|
|
2009
|
23.7
|
23.5
|
0.2
|
6,559
|
4,513
|
|
2010
|
26.0
|
12.8
|
13.2
|
8,263
|
5,090
|
|
2011
|
13.2
|
(0.0)
|
13.2
|
9,355
|
5,090
|
|
2012
|
17.3
|
13.4
|
3.9
|
10,976
|
5,772
|
|
2013
|
10.7
|
29.6
|
(18.9)
|
12,155
|
7,481
|
| |
|
|
|
|
|
| Average |
10.9
|
9.6
|
1.3
|
+1,115% |
648% |
| StdDev |
12.8
|
17.9
|
|
|
|
| Ave/SD |
0.849
|
0.540
|
|
|
|
Figure 2 – “System” versus S&P 500 Buy and Hold
Summary
The difference in the average annual return is not large (+10.9% for the system versus +9.6% for the S&P 500). But this difference adds up over time. Since January 1988 the system has gained +1,115% versus + 648% for the S&P 500 (while only being in the market 33% of the time. The true “numbers geeks” will notice that the standard deviation of annual returns for the system is only 2/3rds as large as that for the S&P 500 – i.e., much less volatility).
So I ask again, is this really a viable strategy? Perhaps. But the truth is that it can get a whole lot better – as I will detail the next time I write.
Jay Kaeppel
Chief Market Analyst at JayOnTheMarkets.com and AIQ TradingExpert Pro (http://www.aiq.com) client
Jay has published four books on futures, option and stock trading. He was Head Trader for a CTA from 1995 through 2003. As a computer programmer, he co-developed trading software that was voted “Best Option Trading System” six consecutive years by readers of Technical Analysis of Stocks and Commodities magazine. A featured speaker and instructor at live and on-line trading seminars, he has authored over 30 articles in Technical Analysis of Stocks and Commodities magazine, Active Trader magazine, Futures & Options magazine and on-line at www.Investopedia.com.
Jan 22, 2014 | Uncategorized
To date, Hank Swiencinski aka The Professor, has delivered two sold out premium webinars to traders, his powerful ‘Rifle Trades’ and his widely acclaimed ‘Trading the Turns’.
The demand for these courses exceeded our quota both times, so much so that we had to offer the recording and the seminar book as a product after the events.
The Professor’s next premium event will be on March 13, 2014 and it’s sure to sell out.
So what’s with the title? The Professor, will be presenting another webinar on March 14th that will focus on the techniques he uses to trade the markets on event driven days like the Fed Announcement.
He calls these techniques ‘Going to the Candy Store’. Like all of the techniques in the Professor’s Methodology, they are extremely easy to understand and apply. With the right setup and technical analysis, these special days in the market can be money in the bank. It’s not rocket science, it’s commonsense and simple technique.
This webinar will also include 2 BONUS insights that The Professor uses in his every day trading, including one that predicts moves of 100 points or more, a day or two before the moves actually occur.
SEATS SELL OUT FAST
Jan 21, 2014 | Uncategorized
There are a virtually unlimited number of ways to play the financial markets. This is especially true in the area of options trading, where a bullish trader can pick from at least at a dozen different strategies (buy call, buy a bull call spread, sell a bull put spread, collar, out-of-the-money calendar spread, etc., etc.).
At some point it can all become a bit overwhelming to the quote, unquote, “average investor.” So sometimes the place to start is, well, anywhere, so long as that anywhere has a beginning and an end and a logical progression to it. What does that mean? It means I am going to walk through “one way to play.” I make no claim that it is the “best” way, or even a “great” way. But that’s OK because the purpose here is not for you to rush out and start trading with it, but rather to stimulate your own thinking on the subject. In other words, hopefully in reading this a “light” will go on for you in regards to your own trading. So here goes.
Jay’s “Light” Option Trading Strategy
This strategy involves a set of steps designed to generate a bullish option trade based on a logical set of criteria. For this strategy we will look for a couple of things:
1. A “catalyst” to tell us when to buy call options.
2. Stocks that enjoy good option trading volume and tight bid-ask spread.
3. Stocks that are performing well overall.
4. Stocks that have experienced a recent pullback and may now be due for a bounce.
#1. The “Catalyst”
We will look for ticker SPY to be above its 200-day moving and for the 3-day RSI to drop to 20 or below and then reverse to the upside. Figure 1 displays a number of such signals.
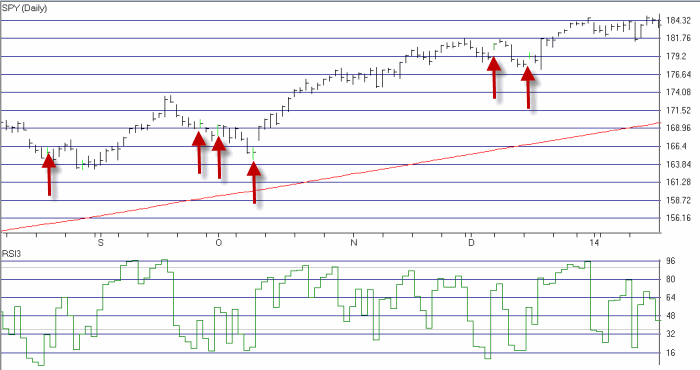 Figure 1 – “Catalyst” Buy Signals (Courtesy AIQ TradingExpert)
#2. Stocks with good option volume and tight bid/ask spreads.
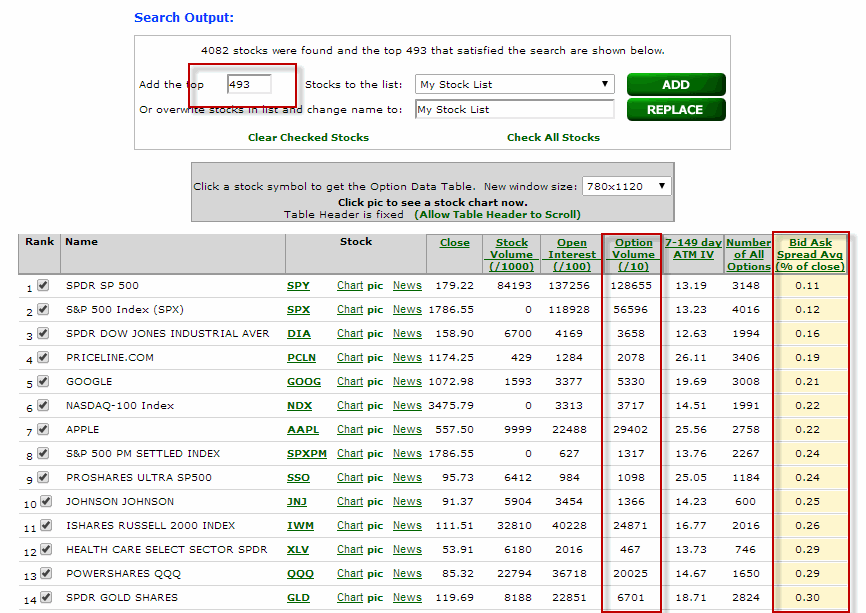
In Figure 2 we see the “Stock List Filter” report from www.OptionsAnalysis.com. This list contains 493 stocks that trade at least 1,000 options a day and those options have an average bid/ask spread of less than 2% (only the top part of the list is visible in Figure 2).
#3. Stocks that are performing well overall
Next we take the stocks shown in Figure 2 and run them through the “Channel Finder” routine in www.OptionsAnalysis.com. We will look for the top 100 stocks based on the strength of their “Up Channel”. We overwrite “My Stock List” with just those 100 stocks. The output list appears in Figure 3.
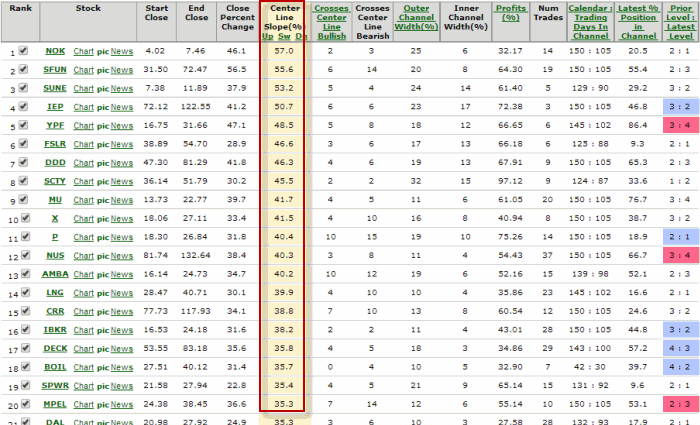
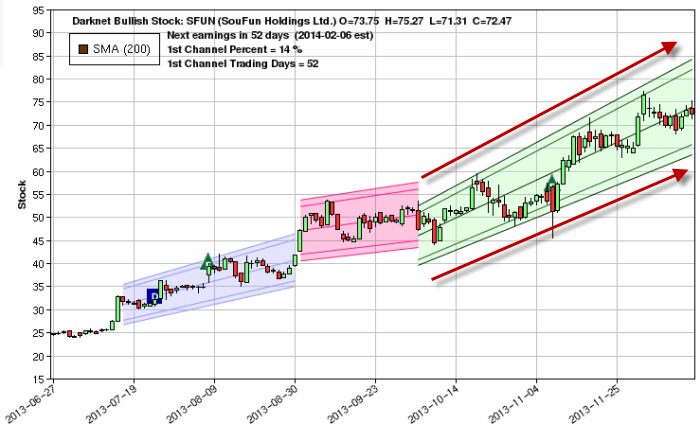
In Figure 4 we see ticker SFUN with a very strong recent Up Channel
#4. Stocks that have experienced a “pullback”
Lastly, we will look through the 100 stocks still on our list for those that have experienced a 3-day RSI of 35 or less within the past 5 trading days. As you can see in Figure 5, only 19 stocks now remain for consideration.
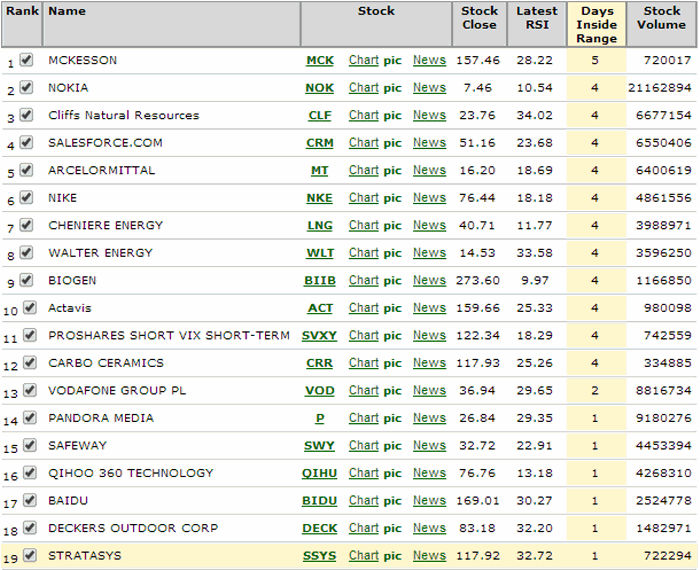 Figure 5 – Stocks that have had a 3-day RSI reading of 35 or less in past 5 days (Courtesy: www.OptionsAnalysis.com)
The Next Step: Finding a Trade
From here a trader can use whatever bullish option strategy they prefer to find a potentially profitable trade among these 19 stocks. For illustrative purposes we will:
-Consider buying calls with 45 to 145 days left until expiration and Open Interest of at least 100 contracts.
-Initially sort the trades by a measure known as “Percent to Double”, as in “what type of percentage move does the underlying stock have to make in order for the option to double in price?”
-Once we get that list e will sort by “Highest Gamma” in an effort to get the most “bang for the buck.”
We see the output list in Figure 6.
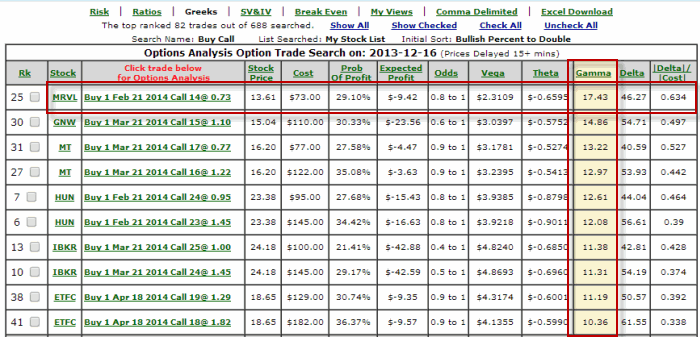
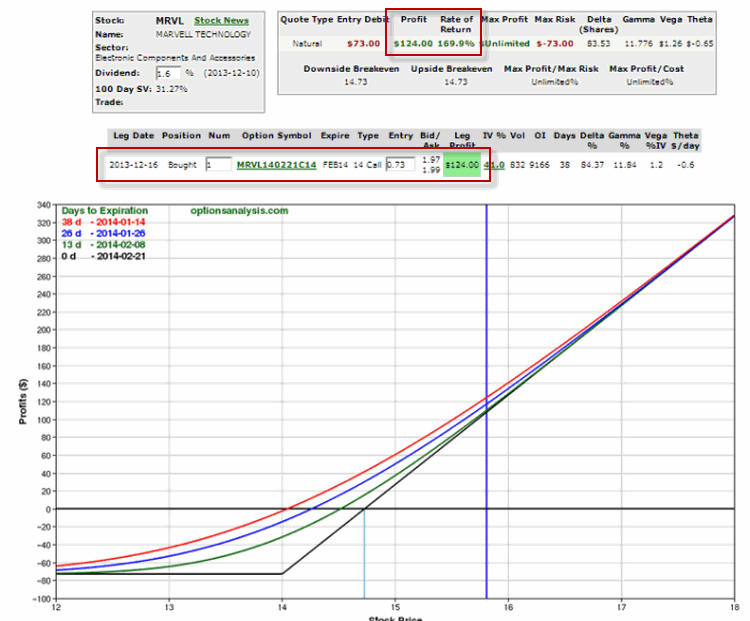
The top trade listed in to buy the MRVL Feb 2014 14 Call @ $0.73 (or $73 per option)
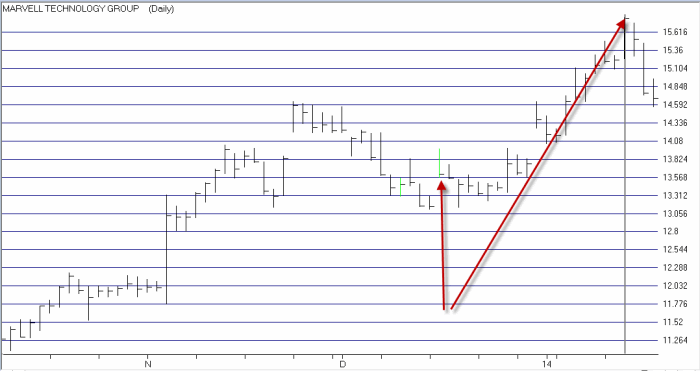
In Figure 7, we see that MRVL rallied nicely within a few weeks from 13.61 to 15.81.
In Figure 8 we see that the Feb 14 call option gained 169.9%.
Of course there is also the whole topic of what to do with this trade: close it, sell some, adjust it, etc. Sorry folks, that’s beyond the scope of this article.
Summary
So does every trade work out this well? That reminds me of a joke. A salesman rings he doorbell of a home and a 12–year old boy answers the door. The boy has a beautiful woman on each side, a drink in one hand and a big cigar in his mouth. Momentarily stunned the salesman finally manages to ask hesitantly, “Um, is your mother home?”
The boy removes the cigar from his mouth, looks straight at the salesman and asks, “What do you think?”
Same answer here. Still, a logical set of steps is a good place to start.
Jay Kaeppel
Chief Market Analyst at JayOnTheMarkets.com and AIQ TradingExpert Pro (http://www.aiq.com) client
Jay has published four books on futures, option and stock trading. He was Head Trader for a CTA from 1995 through 2003. As a computer programmer, he co-developed trading software that was voted “Best Option Trading System” six consecutive years by readers of Technical Analysis of Stocks and Commodities magazine. A featured speaker and instructor at live and on-line trading seminars, he has authored over 30 articles in Technical Analysis of Stocks and Commodities magazine, Active Trader magazine, Futures & Options magazine and on-line at www.Investopedia.com.
Jan 17, 2014 | Uncategorized
The MACD indicator is a useful addition to any stock trading strategy. It is a good measure of momentum, trend direction and can also be a good guide to the relative strength of the market, indicating whet…her the market is overbought or oversold.
However, like all technical indicators there are a number of advantages and disadvantages that any trader should know before incorporating it into their strategy.
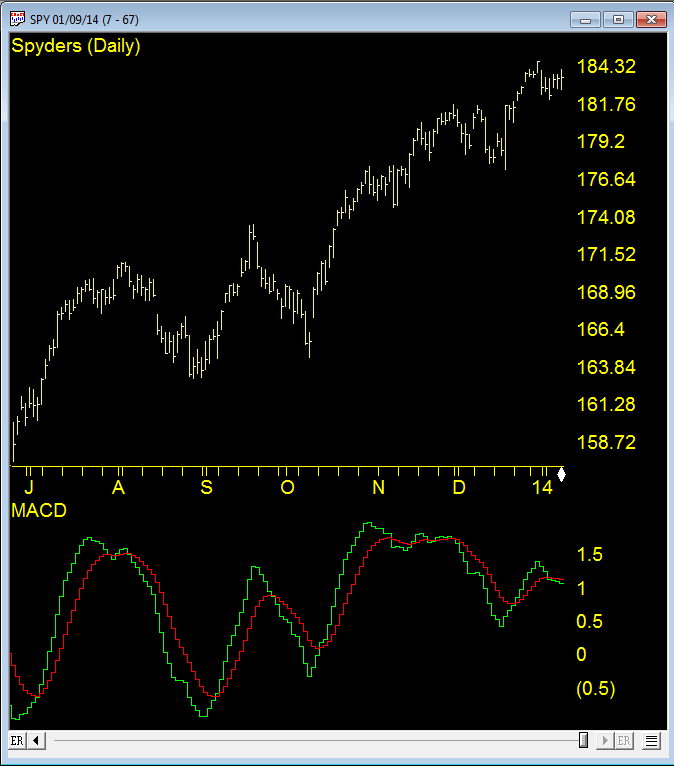
WinWay TradingExpert Pro chart of MACD with default 12, 26, 9 settings on SPY
Disadvantages
The main disadvantage of the MACD indicator is that it is subjective to the user. Like many technical indicators , the MACD has settings that can be changed to give almost limitless numbers of variations which means results will always differ from person to person. A trader must decide for example what moving averages to choose. The suggested settings are the 12 day moving average, 26 day and 9, however, these can easily be changed. Secondly, a trader must know what timeframe the MACD works best on and there are no easy answers, since the MACD will tend to work differently across different markets. Generally, however, the MACD works best when it is confirmed across several different timeframes – especially further out timeframes such as the weekly chart.
Lagging indicator
Unless using the momentum divergence strategy which seeks to pick tops and bottoms before they occur, the MACD has an inherent disadvantage that occurs with all technical indicators that concern price history such as moving averages. Since moving averages are lagging indicators, in that they measure the change in a stock price over a period of time (in the past), they tend to be late at giving signals. Often, when a fast moving average crosses over a slower one, the market will have already turned upwards some days ago. When the MACD crossover finally gives a buy signal, it will have already missed some of the gains, and in the worst case scenario it will get whipsawed when the market turns back the other way. The best way to get around this problem is to use longer term charts such as hourly or daily charts (since these tend to have fewer whipsaws). It is also a good idea to use other indicators or timeframes to confirm the signals.
Early signals
While the crossover strategy has the limitation of being a lagging indicator, the momentum divergence strategy has the opposite problem. Namely, it can signal a reversal too early causing the trader to have a number of small losing traders before hitting the big one. The problem arises since a converging or diverging trend does not always lead to a reversal. Indeed, often a market will converge for just a bar or two catching its breath before it picks up momentum again and continues its trend.
The solution to such limitations, once more, is to combine it with other indicators and use different confirmation techniques. The ultimate test is to set the MACD up in code and test the indicator yourself on historical data. That way you are able to find out when and in which situations and conditions the indicator works best.
The MACD is one of over 100 indicators available in WinWay TradingExpert Pro, Darren Winter’s preferred trading software
Jan 9, 2014 | Uncategorized
Original article by Ajay Pankhania
AIQ Code by Richard Denning
The code for John Ehlers’ article is not provided for AIQ. Instead I substituted an article from the September 2013 Stocks and Commodities issue by Ajay Pankhania, “Muscle Up Those Averages”.
I thought this basic code might be useful to beginning AIQ Expert Design Studio users as it illustrates how to code multiple versions of the simple and the exponential moving averages as well as the MACD indicator. Also the simple moving average crossover system and the MACD crossover systems are coded.
EDS Code:
!MUSCLE UP THOSE AVERAGES
!Author: Ajay Pankhania, TASC Sept 2013
!Coded by: Richard Denning 11/10/2013
!www.TradersEdgeSystems.com
!INPUTS:
price is [close].
smaLen1 is 50.
smaLen2 is 200.
emaLen1 is 12.
emaLen2 is 26.
emaLen3 is 9.
!CODE FOR SIMPLE MOVING AVERAGE OF PRICE:
SMA1 is simpleavg(price,smaLen1).
SMA2 is simpleavg(price,smaLen2).
!CODE FOR CROSSOVER SYSTEM:
BuySMA if SMA1 > SMA2 and valrule(SMA1 < SMA2,1).
SellSMA if SMA1 < SMA2 and valrule(SMA1 > SMA2,1).
!CODE FOR EXPONENTIAL MOVING AVERAGES (FOR MACD):
EMA1 is expavg(price,emaLen1).
EMA2 is expavg(price,emaLen2).
!CODE FOR MACD:
Fast is EMA1 – EMA2.
Signal is expavg(Fast,emaLen3).
!CODE FOR MACD SYSTEM:
BuyMACD if Fast > Signal and valrule(Fast < Signal,1).
SellMACD if Fast < Signal and valrule(Fast > Signal,1).



 English