Jul 27, 2025 | expert rating, expert ratings, expert system
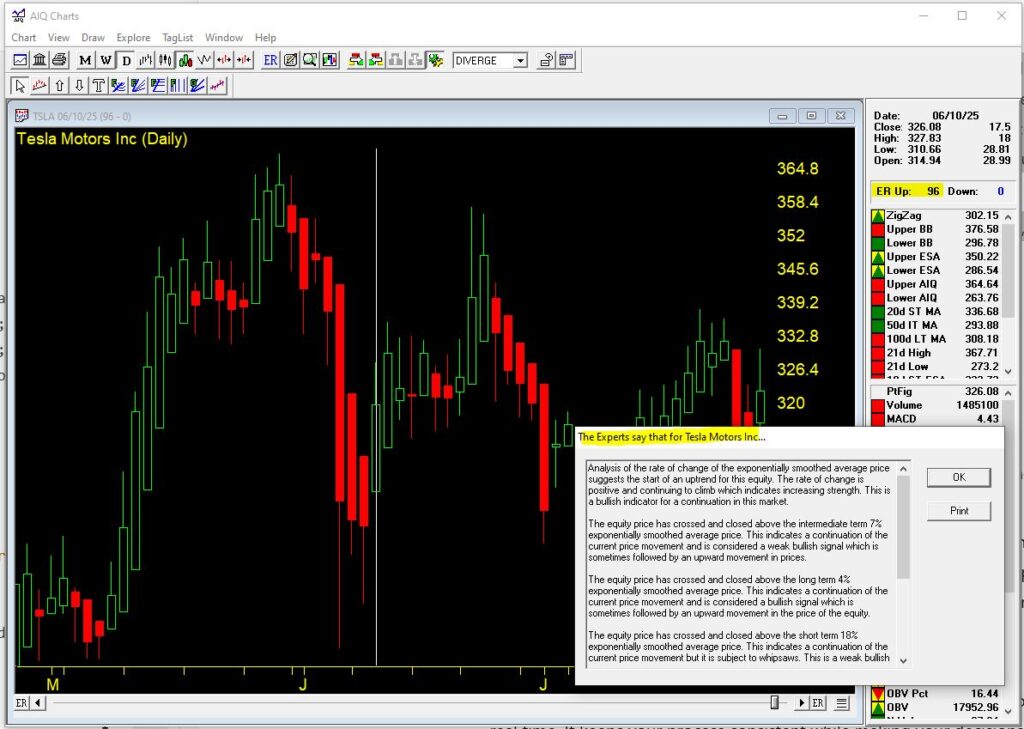
They cut through the noise and reveal high-probability trade setups. That’s where TradingExpert Pro’s AI-based expert ratings come in. With over 400 built-in rule sets, this proprietary system assigns a bullish or bearish score to each stock, ranging from +100 (strong buy) to -100 (strong sell).
These scores are generated from technical rules developed by top traders and analysts, analyzing indicators like RSI, MACD, stochastic, volume, momentum, and dozens more. The AI scans every stock nightly, summarizing complex conditions into one clear rating. Traders use these scores to validate their setups, spot new opportunities, and avoid false breakouts.
In short, it’s a technical signal aggregator that saves time, reduces bias, and adds discipline — everything a serious trader wants.
WinWay’s Expert Rating signals are designed to anticipate changes in the direction of price movement. Some are accurate, while others are not. However, more often than not, the Expert Rating signals are accurate. Of the accurate signals, some are received early, some are received late, and some are accepted at the perfect time. Since traders cannot predict next week’s market prices, they must decide whether to make a trade or to stand aside based on the information available.
In order to help the prudent trader increase the number of profitable trades, WinWay TradingExpert Pro provides a wide array of information that can be used for signal validation. The process of using other information to validate signals is called signal confirmation. Signal confirmation is accomplished in a variety of ways. Inherent in each method is a certain risk vs. reward characteristic; the specific method must be decided by each trader. As the level of confirmation increases, the level of risk is reduced. As risk is reduced, the level of potential reward is also reduced. Traders must balance their levels of risk tolerance against their reward objectives.
The Signal Confirmation rules are: 1. No Confirmation 2. Price Confirmation 3. Price/Volume Confirmation 4. Independent Corroboration by Separate TradingExpert Components Important
Jul 10, 2025 | Charts
Steve Hill from Winway Charts provided an in-depth explanation of technical analysis indicators, focusing on Relative Strength Index (RSI) and Moving Average Convergence Divergence (MACD) divergences.
He discussed how these indicators can signal potential market reversals and help traders make informed decisions, using various stock examples to illustrate his points. Throughout the session, Steve emphasized the importance of identifying divergences between price action and momentum indicators, as well as analyzing volume trends, to predict potential market moves and plan trading strategies.
Next steps
- Review RSI and MACD divergence patterns for identifying potential trend reversals or consolidation zones, especially near overbought/oversold levels and support/resistance areas.
- Consider using divergences for planning exits or hedge points in existing positions.
- Focus on applying divergence analysis to volatile and momentum stocks, particularly in the tech and semiconductor sectors, and
combine divergence signals with volume analysis and support/resistance levels for stronger confirmation of potential trend changes.
Jul 2, 2025 | Charts
As Q2 ended, our WinWayCharts Market Expert System triggered a cluster of bearish warnings, despite the market pushing to new 21-day highs.
These signals highlight a classic divergence: Prices are rising, but internal strength is falling.
Over several days (June 26–30), key indicators such as the Advance/Decline Oscillator and Up/Down Volume Oscillator turned negative — even as the price reached new highs. In AIQ’s history, this pattern often precedes sharp reversals.
The system has not confirmed a phase change yet, but the warnings are stacking up.
Wouldn’t you like to see these signals before the headlines catch up? If you’re not using WinWayCharts yet, start your 30-day trial of TradingExpert Pro — the same software that detected this developing weakness.
Start Your $1 Trial Now
This is your chance to trade with the tools the pros use — system testing, backtesting, and expert ratings included.
Apr 30, 2025 | Charts
Markets Rebound: April 29th’s Fibonacci 50% Retracement on QQQ, DJIA, and NASDAQ
After the last few weeks’ market turbulence triggered by escalating tariff headlines, April 2 -28, 2025, delivered a textbook bounce—one that Fibonacci traders could spot a mile away. The QQQ, DJIA, and NASDAQ all staged strong retracements, each pulling back close to the 50% from their recent swing highs to the dramatic lows set by the tariff-driven selloff.
~ A Closer Look at the 50% Retracement ~
For those who track Fibonacci levels, the 50% retracement is more than just a number—it often signals a crucial moment of decision in market psychology. It’s the point where bulls and bears reassess their convictions. On April 29, all three major indices touched this level in near-perfect unison.
QQQ (Invesco QQQ Trust): After plunging nearly 6% during the tariff turmoil, QQQ bounced back sharply. On 4/29, it retraced exactly 50% of the down move, landing right on the Fibonacci line drawn using WinWayCharts.
DJIA (Dow Jones Industrial Average): The Dow’s recovery was equally telling. It reclaimed 50% of the decline from its January high to the low posted on April 7. Resistance formed precisely at this level, adding credibility to the Fibonacci reading.
NASDAQ Composite: Tech stocks led the rally, and the NASDAQ showed an aggressive bounce. Like the QQQ, it retraced half the loss, with AIQ TradingExpert Pro’s Fibonacci tool providing a clean visual confirmation of market memory at play.
~ Using WinWayCharts to Catch the Move ~
At WinWayCharts we emphasize practical tools that help traders act, not just analyze. The Fibonacci Retracement tool in AIQ TradingExpert Pro offers an intuitive interface for plotting retracement levels from any significant swing high to low, or vice versa. The 38.2%, 50%, and 61.8% levels are automatically calculated and displayed, making it easy to see where the price might hesitate or reverse.
What made April 29 especially notable was how cleanly price respected the 50% level across indices. It wasn’t a vague “zone”—it was a laser line, and those who had it on their charts were better prepared to anticipate resistance and manage risk.
While the 50% retracement is not a guaranteed reversal point, it is often where institutional players test the bounce’s resolve. If price holds below that level, the odds tilt toward a retest of the recent lows. A strong break above it? Then, we could see a move to the 61.8% level or higher.
With markets still on edge from macro headlines, now’s the time to stay sharp. Fibonacci tools like those in WinWayCharts give traders a clear visual framework, especially during volatile, headline-driven price swings.
If you’re not already using Fibonacci levels in your trading, April 29 perfectly demonstrates their relevance. Whether you’re swing trading or managing a portfolio, these retracement zones offer insight into crowd behavior and price structure. It was noteworthy that the SP500 index had progressed further than 50% retracement (55%).
Stay tuned as we monitor whether this 50% level becomes a ceiling or just another stepping stone on the road to recovery.
Apr 13, 2025 | Charts
One of the most powerful, yet underutilized technical indicators in WinWay’sTradingExpert Pro toolkit is the MoneyFlow indicator. Unlike traditional volume-based indicators, the MoneyFlow combines price action with volume to give a more accurate picture of where institutional money may be flowing. It can be beneficial for timing entries—helping traders spot early accumulation phases before price breakouts occur.
At its core, the indicator compares up-volume to down-volume, adjusting for price movement. Important signals occur around trends and trend breaks, and non conformations (highs and lows do not agree) and divergences (trends do not agree) with the price action of the ticker.
Take, for example, the recent action in Nvidia (NVDA). In mid-March 2025, the WinWay Money Flow indicator continued to hold up during the significant downturn in price.

Traders who acted on this early shift, using it as confirmation alongside a breakout pattern, could have caught a strong upside move. Traders can fine-tune this signal to fit a range of strategies, from swing trades to longer-term entries.
The key benefit of using WinWay’s Money Flow indicator for entries is its unique blend of volume and price momentum analysis. It can be combined with group/sector analysis and price momentum indicators as a dynamic tool for identifying stocks where the “smart money” might be stepping in. The Money Flow indicator is a must-watch metric for traders looking to upgrade their entry strategies, especially when markets are volatile and traditional signals are slow
Try WinWay TradingExpert Pro for 30-days for only $1.20 https://winwaycharts.com/wordpress/free-trial/winway-tradingexpert/


