Feb 7, 2014 | options, trading strategies
There are a virtually unlimited number of ways to play the financial markets. This is especially true in the area of options trading, where a bullish trader can pick from at least at a dozen different strategies (buy call, buy a bull call spread, sell a bull put spread, collar, out-of-the-money calendar spread, etc., etc.).
At some point it can all become a bit overwhelming to the quote, unquote, “average investor.” So sometimes the place to start is, well, anywhere, so long as that anywhere has a beginning and an end and a logical progression to it. What does that mean? It means I am going to walk through “one way to play.” I make no claim that it is the “best” way, or even a “great” way. But that’s OK because the purpose here is not for you to rush out and start trading with it, but rather to stimulate your own thinking on the subject. In other words, hopefully in reading this a “light” will go on for you in regards to your own trading. So here goes.
Jay’s “Light” Option Trading Strategy
This strategy involves a set of steps designed to generate a bullish option trade based on a logical set of criteria. For this strategy we will look for a couple of things:
1. A “catalyst” to tell us when to buy call options.
2. Stocks that enjoy good option trading volume and tight bid-ask spread.
3. Stocks that are performing well overall.
4. Stocks that have experienced a recent pullback and may now be due for a bounce.
#1. The “Catalyst”
We will look for ticker SPY to be above its 200-day moving and for the 3-day RSI to drop to 20 or below and then reverse to the upside. Figure 1 displays a number of such signals.
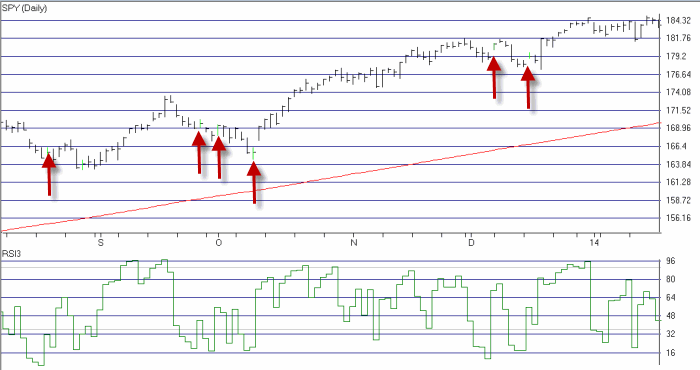 Figure 1 – “Catalyst” Buy Signals (Courtesy AIQ TradingExpert)
#2. Stocks with good option volume and tight bid/ask spreads.
In Figure 2 we see the “Stock List Filter” report from www.OptionsAnalysis.com. This list contains 493 stocks that trade at least 1,000 options a day and those options have an average bid/ask spread of less than 2% (only the top part of the list is visible in Figure 2).
#3. Stocks that are performing well overall
Next we take the stocks shown in Figure 2 and run them through the “Channel Finder” routine in www.OptionsAnalysis.com. We will look for the top 100 stocks based on the strength of their “Up Channel”. We overwrite “My Stock List” with just those 100 stocks. The output list appears in Figure 3.
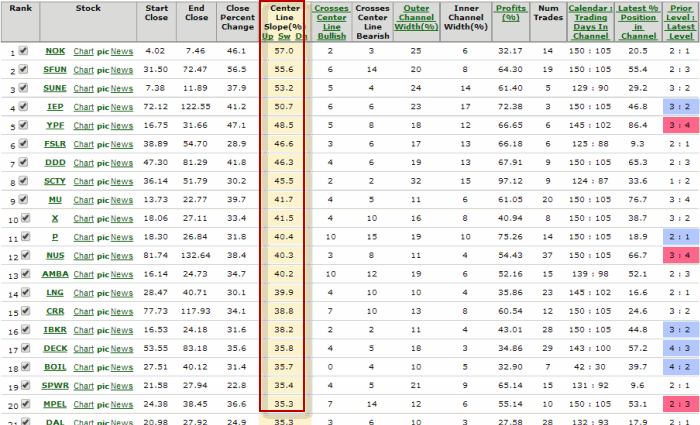
In Figure 4 we see ticker SFUN with a very strong recent Up Channel
#4. Stocks that have experienced a “pullback”
Lastly, we will look through the 100 stocks still on our list for those that have experienced a 3-day RSI of 35 or less within the past 5 trading days. As you can see in Figure 5, only 19 stocks now remain for consideration.
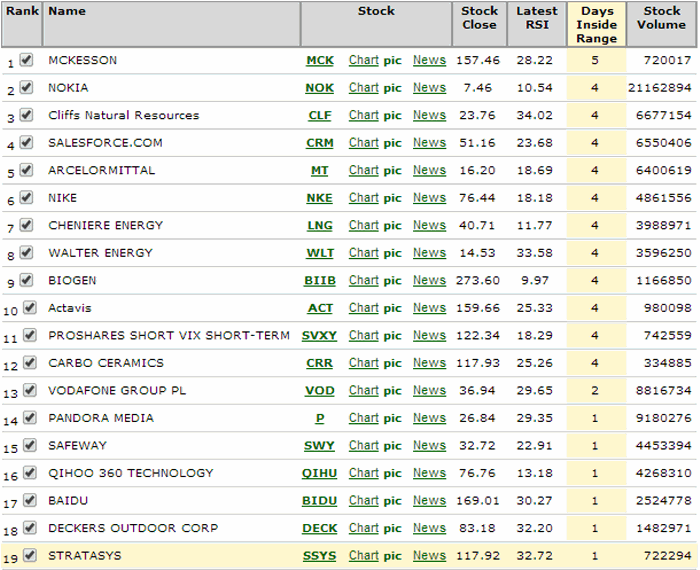 Figure 5 – Stocks that have had a 3-day RSI reading of 35 or less in past 5 days (Courtesy: www.OptionsAnalysis.com)
The Next Step: Finding a Trade
From here a trader can use whatever bullish option strategy they prefer to find a potentially profitable trade among these 19 stocks. For illustrative purposes we will:
-Consider buying calls with 45 to 145 days left until expiration and Open Interest of at least 100 contracts.
-Initially sort the trades by a measure known as “Percent to Double”, as in “what type of percentage move does the underlying stock have to make in order for the option to double in price?”
-Once we get that list e will sort by “Highest Gamma” in an effort to get the most “bang for the buck.”
We see the output list in Figure 6.
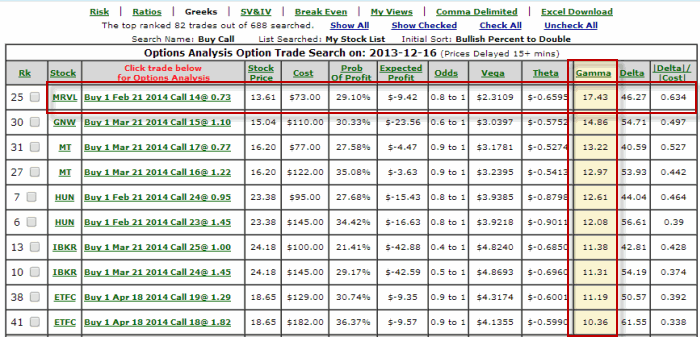
The top trade listed in to buy the MRVL Feb 2014 14 Call @ $0.73 (or $73 per option)
In Figure 7, we see that MRVL rallied nicely within a few weeks from 13.61 to 15.81.
In Figure 8 we see that the Feb 14 call option gained 169.9%.
Of course there is also the whole topic of what to do with this trade: close it, sell some, adjust it, etc. Sorry folks, that’s beyond the scope of this article.
Summary
So does every trade work out this well? That reminds me of a joke. A salesman rings he doorbell of a home and a 12–year old boy answers the door. The boy has a beautiful woman on each side, a drink in one hand and a big cigar in his mouth. Momentarily stunned the salesman finally manages to ask hesitantly, “Um, is your mother home?”
The boy removes the cigar from his mouth, looks straight at the salesman and asks, “What do you think?”
Same answer here. Still, a logical set of steps is a good place to start.
Jay Kaeppel
Chief Market Analyst at JayOnTheMarkets.com and AIQ TradingExpert Pro (http://www.aiq.com) client
Jay has published four books on futures, option and stock trading. He was Head Trader for a CTA from 1995 through 2003. As a computer programmer, he co-developed trading software that was voted “Best Option Trading System” six consecutive years by readers of Technical Analysis of Stocks and Commodities magazine. A featured speaker and instructor at live and on-line trading seminars, he has authored over 30 articles in Technical Analysis of Stocks and Commodities magazine, Active Trader magazine, Futures & Options magazine and on-line at www.Investopedia.com.
Feb 7, 2014 | Portfolio management, Risk management, trading strategies
Risk denotes the probability of an outcome, when an individual places an investment of value in the path of forces outside their control. Straightaway the madness of this practice is revealed, yet the pages of history are littered with those that have brought about the greatest advances mankind has ever made in return for risking something of value.
It may be interesting to note that the volatility of the recent global financial crisis saw the advent of many newcomers onto the BRW Rich List in 2008, and the contention that risk is defined by the market falling is not to the point. Today, due to the very existence of derivatives such as options, swaps and forward rate agreements, an individual can direct risk and return to almost every possible market contingency, regardless of the volatility exhibited.
The Bell Curve represents a distribution of events, with the ‘bell’ representing those events that are most likely; events that are in close proximity to present market price. These resemble at-the-money options.
As we get further away from conditions prevailing at the time, the likelihood of particular events occurring will not only decrease, but will decrease in probability at an increasing rate. These less likely events take their place along the tapering edges of the bell, extending to both extremes. A pricing model attributes time value in this very fashion.
The standard deviation is the unit used to measure the probabilities transgressed from the status quo, to the market price when a particular event occurs. These measured intervals decrease in size, as the two poles of this dimension are approached; the difference between a movement of one standard deviation and two standard deviations will be far greater than that of seven deviations and eight standard deviations.
Primarily, this is due to the fact that there is little difference between probabilities that are small with other probabilities of that class, and similarly, little difference between probabilities that are high with members of that class also. They are described at a high level of abstraction that classifies them broadly as ‘high’ or ‘low’ probability.
However, when events of low probability are compared with those that are of high probability, a happening may be for example, said to be effected by a movement across seven standard deviations. In this event it is a rare occurrence indeed. When volatility is high, it is useful to note that not only are the entire bell and its tapered edges lifted higher on the plane, but the edges of the bell, move closer in gradient to the body. In higher volatility, this is directly due to the indiscriminate application of an increased probability in all possible events. The opposite will be found in low volatility with in this case, the actual bell of the curve becoming much smaller.
Accordingly, a matrix of probabilities is able to be placed in perspective.
Heavily reliant on reason, the contention that price and quality are inexorably attached is well founded in history. Even more so in perfect markets, at very least we can state with confidence that low risk and high risk are not uniformly priced. While the perception of value is a personal value judgment, what is most definite is that markets provide returns that are commensurate with the risk undertaken.
Consideration of the capital needed to fund a position, and also a variety of possible market outcomes must firmly occupy the consciousness of every trader. Insight into one’s own ability to function under the weight of risk is also crucial to profitability, as decision making needs to be carried out as free of subjective influences as possible. At any length, a good rule of thumb will be to allow 25% of risk capital to remain free for unexpected contingencies.
Dec 21, 2013 | trading strategies
This article presents another twist to the one I posted a few days ago titled “A Trader’s Guide to Buying the Dips”. This article presents a variation known as “Jay’s Pullback System”
First let’s look at the building blocks:
A = S&P 500 daily close
B = 10-day simple moving average of S&P 500 daily close
C = (A – B)
Buy Signal = Variable C declines for 3 or more consecutive days
In a nutshell, if the difference between the S&P 500 index (SPX) and its own 10-day moving average declines for 3 straight days we consider this to be a “pullback”, and thus a buying opportunity.
Trading Rules for Basic System:
When Variable C declines for 3 straight days, buy and hold the S&P 500 Index for 5 trading days. If the decline in Variable C extends itself one or more days, then extend the holding period for that many trading days.
So for example, if Variable C declined for 5 straight trading days, one would buy at the close of the third trading day and then hold for seven trading days
Day Variable C Action Position
1 Down
2 Down
3 Down Buy at close (hold for 5 days)
4 Down Hold (Var. C down again; hold for 5 days) Long
5 Down Hold (Var. C down again; hold for 5 days) Long
6 Up Hold (for 4 days) Long
7 Down Hold (for 3 days) Long
8 Up Hold (for 2 days) Long
9 Down Hold (for 1 day) Long
10 Up Sell at close Long; Flat at close
Figure 1 displays “bullish days for SPX in green. In the lower clip we see the difference between the close and the 10-day moving average (i.e., Variable C). A “bullish” period is signaled when that value declines for 3 straight days
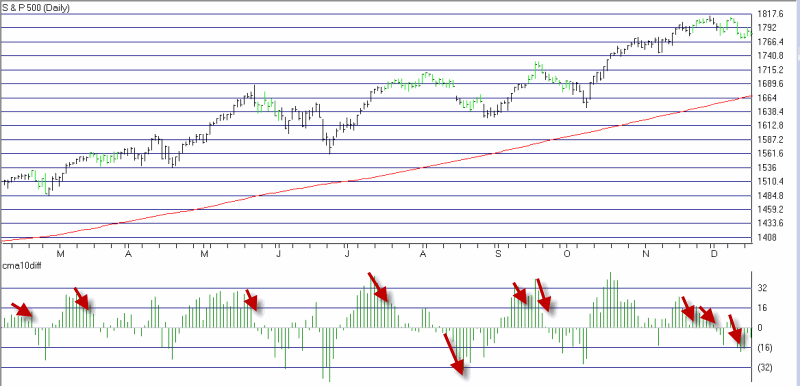 Figure 1 – Basic System bullish days for SPX (Courtesy AIQ TradingExpert)
Results:
This is a very rudimentary “system” and not suitable for many traders (note this raw system includes no stop-loss provision and does not attempt to filter for and trade with the major trend).
In any event, let’s look at what would have happened if one had followed the rules and held the S&P 500 for 5 trading days following every decline in Variable C of 3 days or more, and earned 1% of annual interest while out of the market. Those results are displayed (along with the growth of $1,000 achieved by buying and holding the S&P 500 Index) in Figure 2.
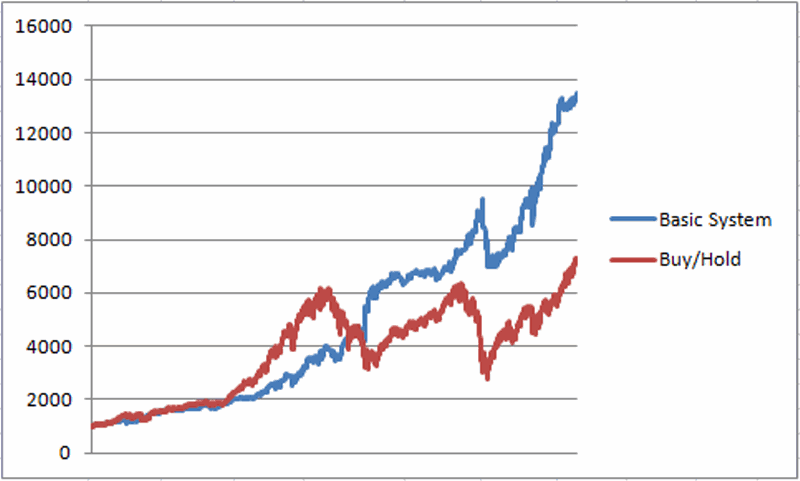 Figure 2 – Simple Pullback Systems (blue line) versus Buy and Hold (red line) Dec 1987 to present
Results:
-$1,000 invested using this system grew to $13,249 (+1,225%)
-$1,000 invested using buy-and-hold grew to $7,208 (+621%)
So we can reasonably state that these results are pretty good. Can they be improved? Let’s see.
Jay’s Pullback System
With this system we will filter for the trend and at times use leverage.
First we will note if the daily close for the S&P 500 Index is above or below its own 250-day moving average.
If Variable C above declines in value 3 straight days:
-If SPX > 250-day moving average we will buy using leverage of 2-to-1
-If SPX < 250-day moving average we will buy using no leverage
-Interest of 1% per year will be assumed when out of the market.
The results of this test appear in Figure 3.
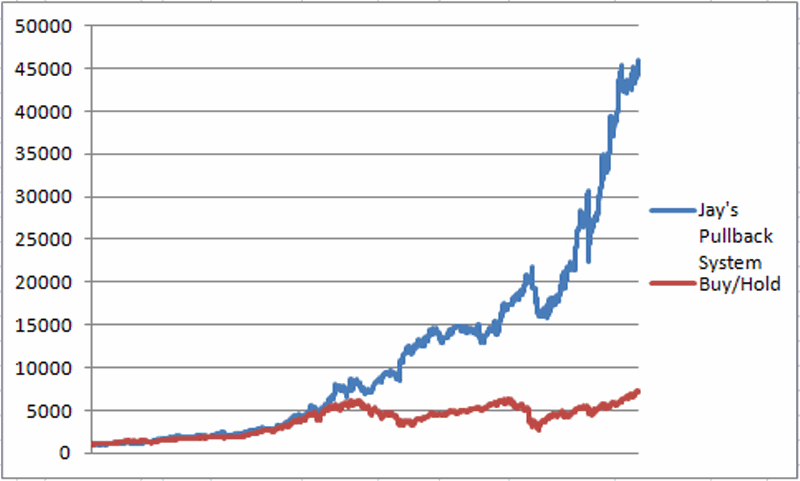 Figure 3 – Jay’s Pullback System: Growth of $1,000 (blue line) versus buy and hold (red line; Dec 1987-present
Results:
-$1,000 invested using Jay’s Pullback System grew to $44,541 (+4.354%)
-$1,000 invested using buy-and-hold grew to $7,208 (+621%)
Funds to Use
Mutual Fund: Profunds ticker BLPIX (S&P x 1)
Mutual Fund: Profunds ticker ULPIX (S&P x 2)
ETF: Ticker SPY (S&P 500 x 1)
ETF: Ticker SSO (S&P 500 x 2)
Summary
While the numbers for the leveraged system look pretty good, it should be noted that there are no stop-loss provisions incorporated. Before you decide to run off and trade any system – particularly one that may use leveraged funds or ETFs, you ought to do some homework and make sure you fully understand and can tolerate the risks involved.
Still, the real point of all of this is simply to note that buying on dips is a valid approach to trade the stocks markets.
Jay Kaeppel
Chief Market Analyst at JayOnTheMarkets.com and AIQ TradingExpert Pro (http://www.aiq.com) client
Jay has published four books on futures, option and stock trading. He was Head Trader for a CTA from 1995 through 2003. As a computer programmer, he co-developed trading software that was voted “Best Option Trading System” six consecutive years by readers of Technical Analysis of Stocks and Commodities magazine. A featured speaker and instructor at live and on-line trading seminars, he has authored over 30 articles in Technical Analysis of Stocks and Commodities magazine, Active Trader magazine, Futures & Options magazine and on-line at www.Investopedia.com.
Dec 19, 2013 | trading strategies
As of 12/13/2013, the S&P 500 has declined for three consecutive days. Should you care? Well, perhaps. In Figure 1 we see the growth of $1,000 achieved as follows:
-When the S&P 500 registers 3 (or more) consecutive lower closes, buy and hold for the next 5 trading days.
To be clear, the results shown here assume that you buy at the close of the 3rd consecutive down day and plan on holding a long position in the S&P 500 for the at least the next 5 trading days. This holding period is extended one day for each additional day the S&P declines consecutively. In other words of the S&P 500 declines for 5 consecutive days, you would buy at the close of the 3rd consecutive down day and hold for 7 trading days.
Not sure of that explanation helped or made things more confusing but there you have it.
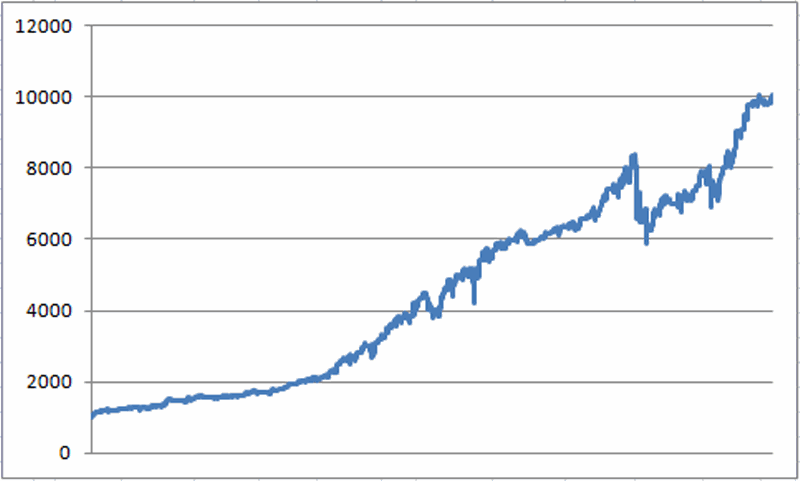 Figure 1 – Growth of $1,000 invested in S&P 500 after 3 (or more) consecutive down closes (December 1987 to present)
In this test, an initial $1,000 grew to $9,869, or +887% (no slippage, commissions, taxes, dividends, interest, etc., just raw price return), with a maximum drawdown of -19.3%.
Filtering for Trend
One of the dangers of this approach is the “Are You Sure You Want to Try to Catch that Falling Safe?” conundrum. So what happens if we only take the trades that occur when the S&P 500 is in an established uptrend? If we only take the trades that occur when the S&P 500 is above its 250-day moving average we get some Bad News and some Good News.
The Bad News is that $1,000 grows to $3,935, or +293%. So clearly a lot of profit potential left on the table.
The Good News is that the maximum drawdown using this method is only a very manageable -9.8%.
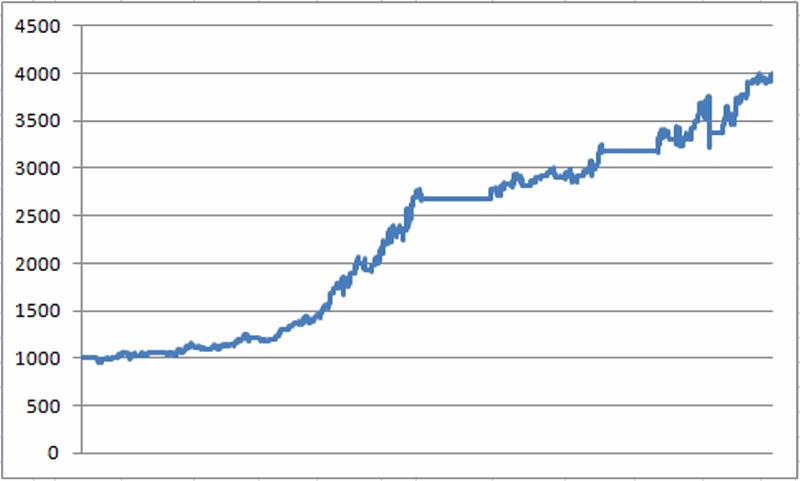 Figure 2 – Growth of $1,000 invested in S&P 500 after 3 (or more) consecutive down closes (December 1987 to present) only when S&P 500 is ABOVE its 250-day moving average
Using Leverage
Figure 3 displays the growth of $1,000 using the following assumptions:
-If the S&P 500 declines 3 or more consecutive days AND the S&P 500 is BELOW its 200-day moving average, buy and hold the S&P 500 index for 5 trading days
-If the S&P 500 declines 3 or more consecutive days AND the S&P 500 is ABOVE its 250-day moving average, buy and hold the S&P 500 index using leverage of 2-to-1 (via a leveraged ETF or mutual fund) for 5 trading days
-For this test we assume that an annualized rate of 1% interest is earned when no position is held.
In a nutshell, if the stock market is in an objectively identified up trend (i.e., close above 200-day moving average) we will attempt to press our advantage by using 2-to-1 leverage. When the S&P 500 is below its 250-day moving average we will eschew the use of leverage.
The results for this test appear in Figure 3.
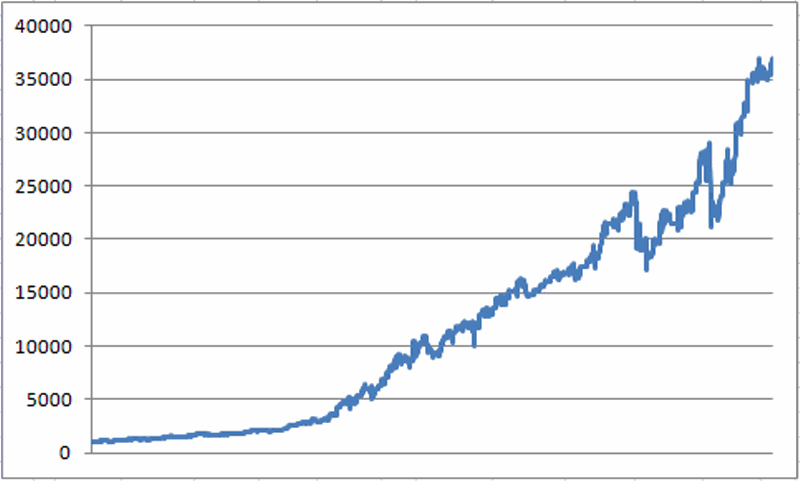 Figure 3 – Growth of $1,000 invested in S&P 500 after 3 (or more) consecutive down closes using 2-to-1 leverage if S&P 500 > 250-day moving average (December 1987 to present)
Using this approach $1,000 grew to $35,868, or +3,469% (albeit with a maximum drawdown of -20.2%).
Funds to Use
Mutual Fund: Profunds ticker BLPIX (S&P x 1)
Mutual Fund: Profunds ticker ULPIX (S&P x 2)
ETF: Ticker SPY (S&P 500 x 1)
ETF: Ticker SSO (S&P 500 x 2)
Summary
Does this simple method represent the “Holy Grail of Trading?” Of course not. Is it even better than whatever system you are using right now? I can’t answer that, only you can. But the main point here is simply to note that dips in the stock market – even in the face of an overall downtrend – tend to be buying opportunities (at least in the short run).
The simple rules presented here represent just one way to exploit this fact.
Jay Kaeppel
Chief Market Analyst at JayOnTheMarkets.com and AIQ TradingExpert Pro (http://www.aiq.com) client
Jay has published four books on futures, option and stock trading. He was Head Trader for a CTA from 1995 through 2003. As a computer programmer, he co-developed trading software that was voted “Best Option Trading System” six consecutive years by readers of Technical Analysis of Stocks and Commodities magazine. A featured speaker and instructor at live and on-line trading seminars, he has authored over 30 articles in Technical Analysis of Stocks and Commodities magazine, Active Trader magazine, Futures & Options magazine and on-line at www.Investopedia.com.
Dec 12, 2013 | trading strategies
2013 Market Year in Review
The analysis is actually pretty simple:
Stocks:
Financial, World and Economic News: BAD
Stock Market Performance: GREAT!
Bonds:
Investor A: Hey, have you noticed that t-bond yields have hit a 15 month high? Investor B: What, me worry?
Gold:
Ppppppphhhhhhhhttttttt!
So it is pretty obvious at this point that stocks were the place to be in 2013 (which is maybe why the Investors Intelligence poll registers just 14% bears). Of course, no one is ever content with that kernel of knowledge. We want to know what’s going to happen in the future. In fact the investing public is so hungry for “advance” knowledge that there are now thousands of pundits out there offering all kinds of wildly differing opinions.
So all the investor has to do is decide which opinion they “want to believe”, find a pundit offering that opinion, and “Voila” – they have “expert confirmation” that their opinion is “correct.”
And so it goes, and so it goes.
Meanwhile, back here in reality land, a simple trend-following approach can reap many benefits, especially when the following mantra is true for the stock market:
“If the Fed is pumpin’, the stock market’s jumpin’.” Period. End of analysis.
The Right Way and the Wrong Way to Look at Trend Following Methods
There is a right way and a wrong way to look at trend-following indicators:
The Wrong Way: “Wow, my handy dandy trend following indicator is bullish at the moment, therefore I can extrapolate this out to mean that this bullish trend will continue for some time to come.”
The Right Way: “Well, the trend is up at the moment, but of course this could change at any moment, so while I won’t panic and sell everything as long as the trend is still up, I will check back often and if the trend changes I will change my thinking and actions accordingly.”
The most important thing to remember about trend-following indicators is this:
-There is no “prediction” built into the current reading
In other words, a trend-following method does nothing more than identify the current trend right now. Tomorrow is a different day. While this may not “sound” as useful as some fancy indicator that portends to be able to predict the future, in reality it is actually much more useful.
Likewise, also remember that there is no humanly possible way to eliminate occasional whipsaws when using moving averages. So learn to live with it.
Trend-Following Indicators I Have Known and, er, Followed(?)
None of the indicators or methods that I will discuss next will ever pick a bottom or a top. In fact, they may not even really impress you in any way. At least not until you find yourself on the sidelines while the market is powering higher without you on board. So here are a couple of simple trend-following indicators to keep in mind:
The 200-day Moving Average
OK, this one is so basic and so commonly followed that it gets dismissed by some people. But Figure 1 displays a variety of markets during different time frames. In fact, an investor who simply fought the urge to fight the trend would have enjoyed riding some nice uptrends (particularly in the stock market) and avoided a lot of pain (most notably in bonds and gold).
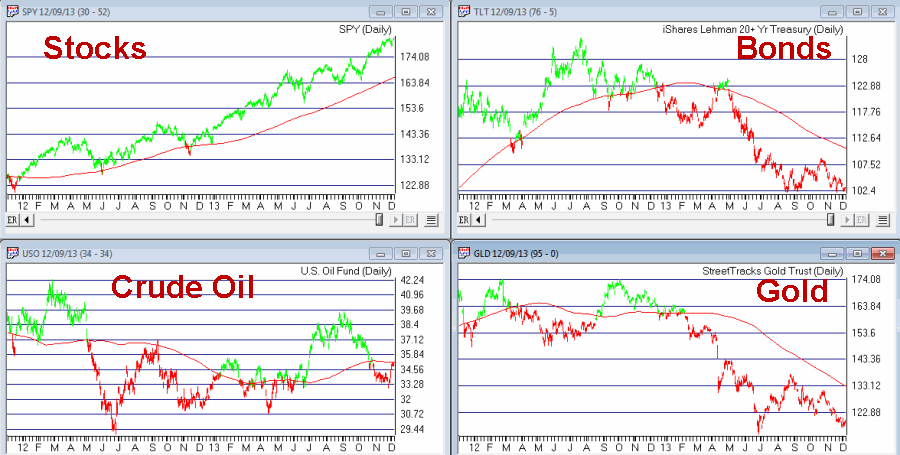 Figure 1 – Four Markets with 200-day simple moving average (Courtesy AIQ TradingExpert)
The Bowtie Pattern
I learned the Bowtie pattern from David Steckler (http://www.etfroundup.com/), who in turn learned it from David Landry (www.davelandry.com). It involves three moving averages:
-10-day simple moving average
-20-day exponential moving average
-30-day exponential moving average
A Bullish signal occurs when the 10-day is above the 20-day and the 20-day is above the 30-day.
A Bearish signal occurs when the 10-day is below the 20-day and the 20-day is below the 30-day.
As usual, different traders use things in different ways. David likes to enter as soon as a new trend emerges, I prefer to look for pullbacks within an established trend. I suggest you explore both possibilities.
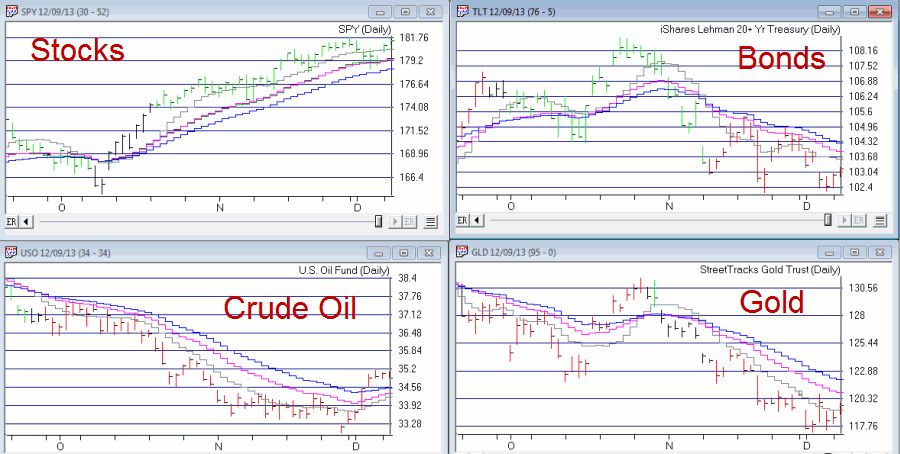 Figure 2 – Four Markets with 10-day simple, and 20 and 30-day exponential averages (Courtesy AIQ TradingExpert)
The 13-55 Exponential Moving Average
OK, at some point one moving average method looks pretty much like every other moving average method. In fact that is actually the case. Linda Bradford Raschke of Market Wizards fame (www.LBRGroup.com) once stated (OK, for the record, I am paraphrasing here) that “there is no one best moving average method, so just pick something and go with it.”
One more combination that I like as an intermediate term guide is the 13-day and 55-day exponential moving average combination as shown in Figure 3.
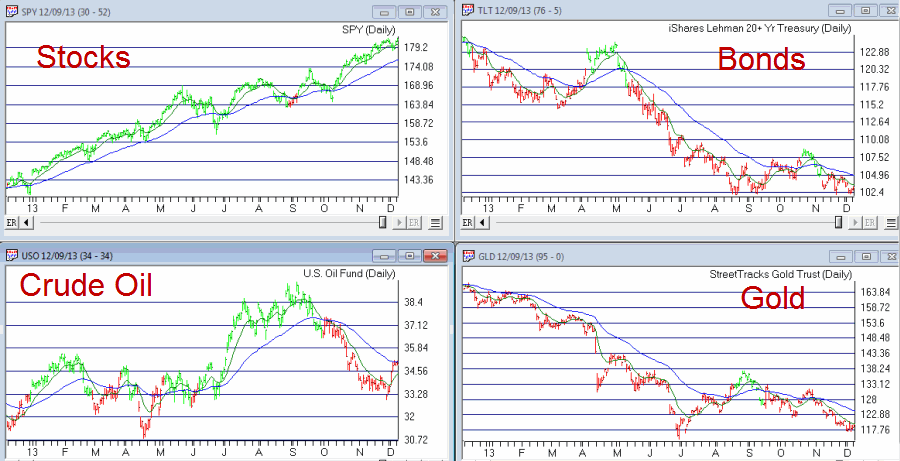 Figure 3 – Four Markets with 13-day and 55-day exponential averages (Courtesy AIQ TradingExpert)
Summary
I encourage you to take a closer look at all of the combinations I’ve mentioned above. Remember two things:
-If you try to use them as Standalone systems (i.e., buying at every bullish signal and selling at every bearish signal) you are likely to be disappointed.
-The real power comes from using methods like the ones I’ve shown to objectively identify the current major trend, and then figuring out ways to trade in line with the major trend.
Jay Kaeppel
Chief Market Analyst at JayOnTheMarkets.com and AIQ TradingExpert Pro (http://www.aiq.com) client
Jay has published four books on futures, option and stock trading. He was Head Trader for a CTA from 1995 through 2003. As a computer programmer, he co-developed trading software that was voted “Best Option Trading System” six consecutive years by readers of Technical Analysis of Stocks and Commodities magazine. A featured speaker and instructor at live and on-line trading seminars, he has authored over 30 articles in Technical Analysis of Stocks and Commodities magazine, Active Trader magazine, Futures & Options magazine and on-line at www.Investopedia.com.
Dec 7, 2013 | chart patterns, Seasonality, trading strategies
Seasonality is always on a traders radar in December. The Santa Claus rally and all.
In this seasonal vein, I ran a scan of a decent database of liquid stocks with the following idea in mind.
1) The percentage return for the last 20 trading days of the year.
2) Look back the last 8 years
3) Only show me stocks that have either all positive or all negative returns in those 8 years
As the Santa Claus rally is a seasonal feature of the markets it made sense to me to find stocks that do the same thing. Might as well get as many odds in my favor as I can.
So here’s what I found.
17 stocks have had positive returns in the last 20 trading days of the year, 8 years in a row.
The top performer was AAR Corp – symbol AIR. It’s average return over the last 8 years was a whopping 13.98%. Pretty impressive for 20 days. More impressive was the consistency. The range of returns was between 7% and 23%, so no 98% wild card distorting the pattern.
Of course there’s never any guarantee this will continue, but it’s impressive to see.
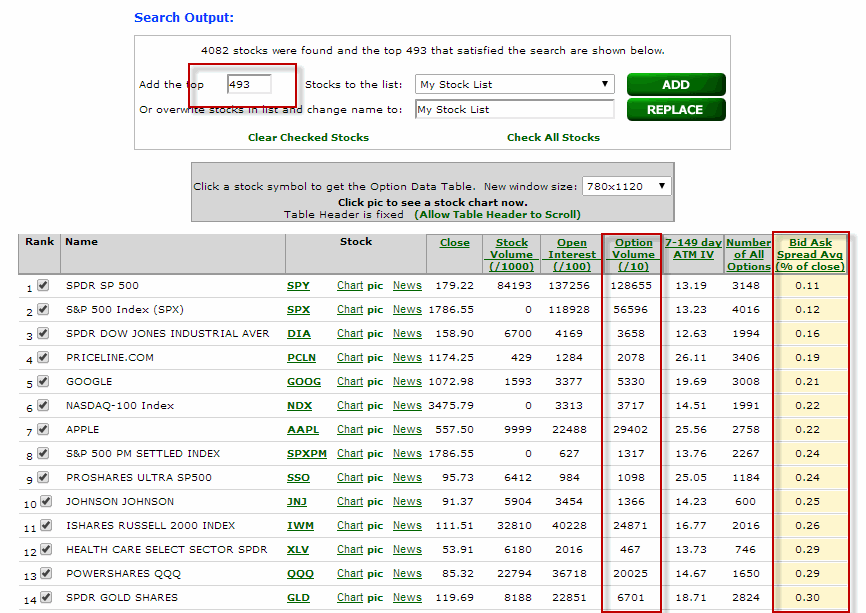 Figure 2 – Stocks with good option volume and tight bid/ask spreads (Courtesy: www.OptionsAnalysis.com)
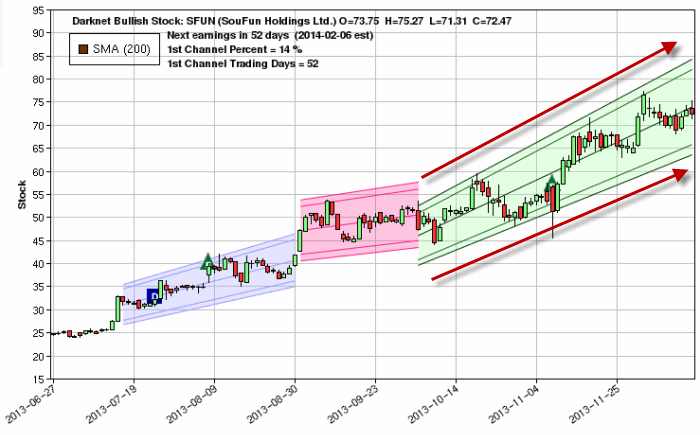 Figure 4 – Ticker SFUN with Up Channel (Courtesy: www.OptionsAnalysis.com)
 Figure 5 – Stocks that have had a 3-day RSI reading of 35 or less in past 5 days (Courtesy: www.OptionsAnalysis.com)
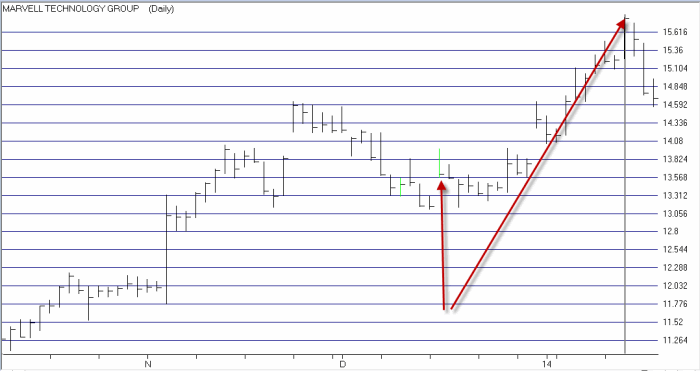 Figure 7 – MRVL rallies (Courtesy: www.OptionsAnalysis.com)
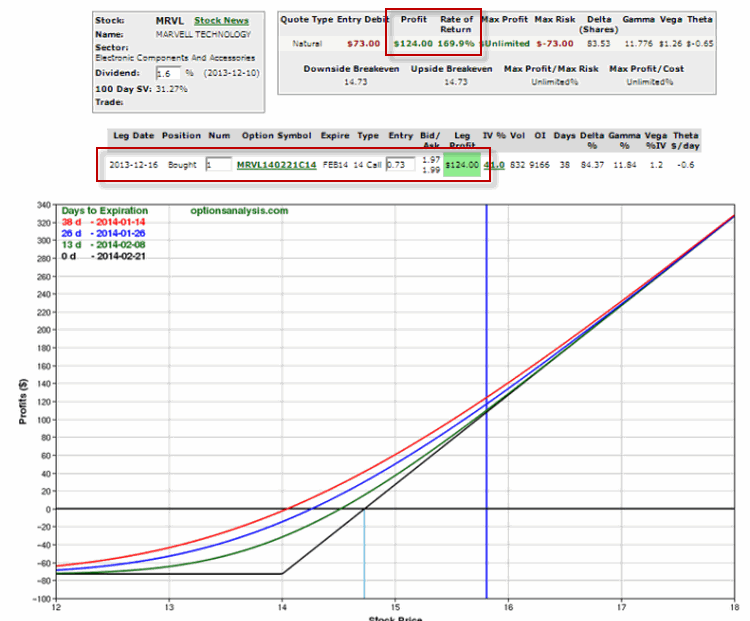 Figure 8 – MRVL 14 call rallies sharply (Courtesy: www.OptionsAnalysis.com)


