Feb 11, 2014 | Alerts, Charts, Quotes and Barometer, Support
The US end of day ticker symbols work with streaming data except for NASDAQ stocks which need the suffix -QB input after the symbol in QUOTES and ALERTS. A list of NASDAQ stocks can be found at http://www.nasdaq.com/screening/companies-by-industry.aspx?exchange=NASDAQ®ion=North+America
Feb 11, 2014 | Alerts, Charts, Quotes and Barometer, Support
Your WinWay TradingExpert Pro service includes access to end of day data on UK and US stocks and streaming data on US stocks only. Streaming data on UK stocks will soon be available for an additional exchange fee charge.
Feb 11, 2014 | Expert Design Studio, Support
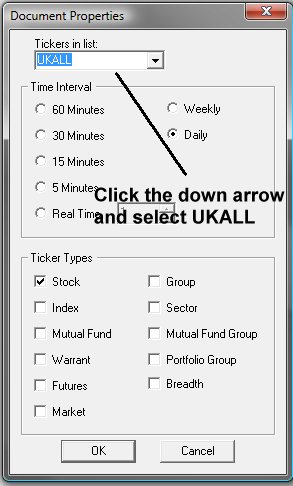
Open EDS from the Charts Tool Bar. Open the EDS scan that you wish to run on UK stocks. Click on File, Properties and in the Tickers in List box select UKALL. click OK. You will need to change these properties on any EDS scan you wish to run on UK stocks.
Feb 11, 2014 | Reports, Support
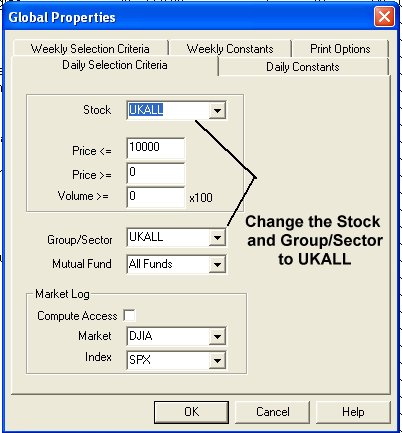
Open the Reports from the Charts Tool Bar. From the Reports menu, select Global Properties. Change the Stock and Group/Sector areas to UKALL in the Daily Selection Criteria tab. Repeat for the Weekly Selection Criteria tab if desired. Click OK. When you next download data and/or generate reports, the reports will reflect the changes.
Feb 4, 2014 | Charts, Expert Design Studio, Support
Copy and paste the code below to a New EDS file. Click on File, Save, name it Bothvolumeandcloseupdown.eds
PosVol if [volume]>val([volume],1).
NegVol if [volume]<val([volume],1).
PosClose if [close]>val([close],1).
NegClose if [close]<val([close],1).
Phasedown if Val([Phase],2)< Val([phase],1) and Val([Phase],1)> [Phase].
Phaseup if Val([Phase],2)> Val([phase],1) and Val([Phase],1)< [Phase].
Go to Charts
Click on the “Define Studies” button (up top)
Where it shows EDS Files up top…click on the button that looks like it has three periods in it (…)
Browse and select the Both Volume and Close UP Down.EDS file
Click on “Create New Color Study”
Select “Price Plot” and click Next
Select “Price Bar” and click Next
Select “NegClose” and click Next
Click on “Change Color” and select RED and click OK
Click Next
Click Finish
Click on “Create New Color Study”, again
Select “Price Plot” and click Next
Select “Price Bar” and click Next
Select “PosClose” and click Next
Click on “Change Color” and select GREEN and click OK
Click Next
Click Finish
Click on “Create New Color Study”
Select “Indicator” and select “VOLUME” then click Next
Select “Volume” and click Next
Select “NegVol” and click Next
Click on “Change Color” and select RED and click OK
Click Next
Click Finish
Click on “Create New Color Study”, again
Select “Indicator” and select “VOLUME” then click Next
Select “Volume” and click Next
Select “PosVol” and click Next
Click on “Change Color” and select GREEN and click OK
Click Next
Click Finish
Click on “Create New Color Study”
Select “Indicator” and select “PHASE” then click Next
Select “HISTOGRAM” and click Next
Select “PHASEDOWN” and click Next
Click on “Change Color” and select RED and click OK
Click Next
Click Finish
Click on “Create New Color Study”, again
Select “Indicator” and select “PHASE” then click Next
Select “HISTOGRAM” and click Next
Select “PHASEUP” and click Next
Click on “Change Color” and select GREEN and click OK
Click Next
Click Finish
Click OK to leave color studies