Aug 12, 2010 | Uncategorized
In the age of the internet, there are lots of sites that give you free stock charts. For many people, a chart is all they need for their trading. Obviously AIQ offers much more than charting, but even if all you need are charts then you’ll love AIQ’s list feature.
This feature allows users to very quickly browse through the stock charts that they are interested in. Every AIQ power user heavily relies on the list feature. Knowing how to create and manage lists allows users to focus on the stocks they want to purchase, to more easily manage a large database, to effortlessly chart their favorite stocks, etc.
TradingExpert Pro comes with the S&P 500 and the AIQALL list. Many other AIQ list files can be downloaded from AIQ’s web page. The web page includes lists of the S&P 1500, Russell 1000, Russell 2000, Nasdaq 100, optionable stocks, etc. The web site is
http:// www.aiqsystems.com/lists.htm
After downloading one of these list files, you can very quickly and easily scroll through charts of the stocks. In AIQ Charts, use the dropdown arrow on the tool bar to highlight a list name. For this example, we’ll choose a list of the Nasdaq 100 stocks. By hitting the Enter key, the Control Panel is replaced by the list of Nasdaq 100 ticker symbols. By clicking on the Explore Right icon on the toolbar (or clicking on the individual ticker symbols), you’ll get a chart of each stock in the list. There is no need to type in the individual ticker symbols. Simply keep clicking the Explore Right icon and you can see every Nasdaq 100 chart in a matter of minutes.
While AIQ places many lists on its web site, some users may have a particular list of stocks that they want to closely track. This might include recommendations from Value Line or a favorite investment newsletter. In this case, users can create their own individual lists. Creating a list is a simple process.
– In Data Manager, click List on the menu bar and then New.
– Enter a name for the list you want to create.
– The list will appear on the left section of the Data Manager window.
– With your list name highlighted, click List again and Insert Tickers. To save time, enter a list of
tickers separated by semicolons.
– Click OK and the list will be created.
If you have a list of ticker symbols in a spreadsheet, TradingExpert Pro can import that list. That means if you subscribe to Investor’s Business Daily’s online service then you can download its top recommendations into a spreadsheet and then import the list into AIQ. To do this, first
save the list to a CSV format. Then go to the Data Manager and create the new list name using the process just described.
– With the list name created, select List and then Import.
– Highlight the CSV file and click OK.
AIQ allows users to merge two lists as well. Some people like to track a list that combines two list files, such as the SP 500 and Nasdaq 100. AIQ’s Advanced List Edit function allows you to merge two lists. You simply open both lists and then drag one list into the other. Be sure to save the new combined list to a new name.
So far we’ve discussed how list files help save time in charting. They are also helpful when you run Reports. When you run reports on your individual list file, only stocks that you are interested in will appear. The noise from other stocks that you’d never buy is eliminated. For instance, you can check for a breakout on AIQ’s Point & Figure Breakout report using your particular list of stocks. There is no need to filter through a bunch of stock symbols looking for the ones of interest to you. To accomplish this, go to Reports
– right-click on Stock Reports. The Global Properties box will appear
– Use the dropdown arrow next to Stock to select the name of the list you want to run and click OK.
We’ll choose to run reports on the Nasdaq 100 stocks. Some reports, however, show many stock choices. To quickly scroll through the list of stocks on a report, you can click the Build Report List icon on the toolbar. This will create a list of the stocks on a report. After naming the list, the first stock on the report will automatically be charted. Click the Explore Right icon to see the other stocks.
Similar to Reports, Expert Design Studio (EDS) scans can be run on individual lists.
– In EDS click the Properties icon and select the appropriate list.
– After the scan is complete, you can chart the stocks by clicking the Chart List icon.
The ability to create and use lists is a basic function of TradingExpert Pro. Although basic, this function is very powerful. It allows you to quickly scroll through charts and enables you to focus on the stocks you are most interested in.
Aug 3, 2010 | Uncategorized
Traditionally, equities have commanded a 5% premium over the bond yield, largely due to bonds remaining the asset class that is routinely ignored, and investors preferring stocks and currencies for reasons yet to enjoy proper justification. Not only has this become entrenched in the psyche of investors everywhere, but significantly, the fundamentalist revolution will tolerate it no more.
As history shows us, other stock markets around the world have suffered a number of catastrophic events, to provide the investor with as much as two opportunities to lose 100% of their investment in the past century. The United States however, remains the exception. It is extraordinary that it has not come to the same grim end as the Japanese or European stock markets, and in that respect ought to be treated discriminately.
Simply, the 5% premium in favor of equities is concomitant to the risk that stocks pose vis a vis bonds. If the risk is not reflective of a 5% premium it cannot be justified. Economic growth is achieved through innovation. If there is no innovation to speak of, there will be no economic growth and neither in this situation can a 5% premium be argued. The premium that equity enjoys over bond yields is dependent on inflation; if inflation is rising, bond prices will be under pressure. Due to the fact that equities are a good hedge against inflation, the premium in this scenario however, may well merit some consideration. The incontrovertible truth however, is that fundamental analysis of the real interest rate achieved is mandatory in the counter-revolution that will emerge.
Currently, inflation is targeted by the Federal Reserve to be 1.8% over the next 10 years. The inflationary component priced into the 5-year bond is 1.8% and that priced into the 10-year bond is 2.1%. In the fullness of time, as the economy builds momentum, the target will appear to be more and more inappropriate. See now, when inflation is at 5% it will still receive the familiar rhetoric of a central bank who will insist that their target is 1.8%, in an effort to coerce the market. On this occasion however, the power of suggestion as fortified by efficient markets theory, will prove ineffective. Regardless, the global economy including Europe will set a course along the path of inflation.
Further, there is ambiguity in the real rate of inflation. Hedonic adjustments have been rife, and while it may assist a Central Bank in the discharging of its duties, the real rate of inflation will be considerably magnified. It is intangible anomalies such as these that efficient markets theory fails to consider, and it is precisely what will be required of sound investments in the coming new environment – fundamental analysis. Again, traditionalists have held the view that stocks will outperform bonds however, in the past 10 years bonds have triumphed, with considerable economic growth resulting despite a return being postponed by equities. Growth stock investors have disregarded the importance of dividends in the past, but now alternatives will be available. The divide between fixed interest markets and equity will be a practice of the past. Comparisons will be made between the yield offered by bonds and the dividend yield on stocks.
Jul 30, 2010 | Uncategorized
Simple moving averages are not rocket science. They provide a benchmark from which any given days price can be measured for it’s degree of deviation from the average. Crossovers of moving averages by price action whether to the upside or downside are not so much buy or sell points as warning signs. Of course it depends on your moving average. Historically a 200-day arithmetic for the NASDAQ has provided a pretty good indication of the long trend. Dramatic breaks through this average often spell a trend change. Now add in a shorter moving average like the 50-day and a little more clarity appears.
Take a look at the NASDAQ going back to early 2006 in the chart below. When the 50-day is above the 200-day and both are rising, this is the time when bulls hold the court.
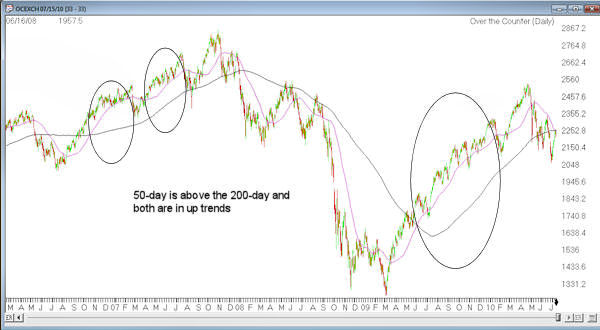
Conversely when the 50-day is blow the 200-day and both are falling, this is the time when bears reign.

This is not a timing mechanism for entering or exiting, merely a confirmation of which direction the market is going when these averages display this pattern.
In other market conditions these moving averages will be trending differently from each other and the picture is mixed.
So to the last few days July 13 – 15, 2010. We are at a confluence of the 50-day moving average and the 200-day moving average. The 50-day is in a down trend and now just crossing the 200-day. Yet the 200-day is barely turning down, and has been moving back up in the last 2 days. Until there is a clear down trend in the 200-day, with the 50-day still below and also down trending the sweet spot for shorts is still not in place.
One interesting point to note. The price is also very close to the moving average confluence. The last time this setup occurred was back in May 2005. Check out the chart below. Notice the similarities between May 9, 2005 and July 15, 2010?


Back in 2005 the confluence resolved to the upside, with the market rebounding more than 10% in 2 1/2 months, eventually meeting resistance at the prior high. July 2010 more time is required for the averages to play out before we have an idea where the market is headed.

Jul 8, 2010 | Uncategorized
The recent OIC implementation of its new option symbology in February of 2010 finally gave AIQ the opportunity to fully chart options symbols. There are two methods of charting. In AIQ Charts, you can now enter an option symbol and receive a real-time chart (not end of day). In AIQ RTalerts you can add any number of option symbols and see both real-time and end of day charts.
AIQ opted for what we considered the easist to use implementation of the OIC recommendations. For example the SPY July 2010 106 calls can be charted by entering the ticker
SPY JUL10 106 C
Note there is a single space between the underlying ticker, the month/year, the strike price and the call(C) or put (P).
Try it for yourself. We recommend using RTalerts for tracking multiple options, as the capability to see end of day and real-time price charts is limited to real-time only in AIQ Charts. Further developments to accommodate the weekly and quarterly options are being investigated.
Jul 3, 2010 | Uncategorized
Trading is about risk management. I manage risk by adjusting position sizes, and the number of positions I am trading. When the market is trending I am willing to have more funds invested, so I use more trading positions and larger position sizes. When the market is not trending, I reduce my exposure by reducing position sizes, and the number of positions I am trading.
When the market is in a narrow base I might only be trading two positions. That does not imply I only make two trades while the market is in the base, because when a position hits its limit or stop I will replace it with another setup that triggers. It is just that I am only holding two positions at a time; most of my account is in cash or ETFs. Only having a few positions at a time, limits my exposure to the market during periods of market uncertainty.
Testing and experience shown that a three day holding period can be an effective exit strategy during trading range markets and that longer holding times can be used during trending markets. In practice I use this as a guideline and not a hard and fast rule. If a position approaches support or resistance I will generally take the profit whether or not it has been three days. The most likely thing for a stock to do at a key support or resistance level is to bounce or retrace. If the stock is going to bounce or retrace from support or resistance most of the time, then…in the short term the run is over and I am better off to be taking profits.
When a stock approaches support or resistance it is either going to break through or retreat from it. If, based on the definition of support/resistance the stock retreats most of the time then by taking profits in the support/resistance area I will maximize my return and not be ‘giving back’ profits as the stock retreats. In the cases where the stock does not retreat, and moves through support/resistance I will still have my profits and can roll them into another position. I do not need to continue making money on a specific stock, I can roll my profits into whatever is working.
When trading I want to be positioned to profit if a stock, or the market, does the usual thing in a given situation. When the stock does not take the usual path I may lose a little, but since by definition stocks do the usual thing most of the time, that is the way to bet. Since downtrending stocks usually bounce from support, I am better off to take my profits before the stock reacts to a support level by bouncing which would reduce profits on short positions. If I have a long position and the stock is moving up toward resistance, then I want to take profits before the resistance area in case the stock follows the normal pattern and retraces from resistance which would then decrease my profits.
Some traders are reluctant to take profits when a short position approaches support because they do not want to ‘be wrong’ and worry that they will ‘miss out’ if the stock keeps going down instead of bouncing. They are trading on emotion and ego, not logic. If the stock is most likely to bounce at support then most of the time you are better off to close the short position before it gets to support. There is no way to know what will happen on any particular trade. There are not magic indicators or super systems that will tell you the outcome on a specific trade. You are not smart if the trade worked and dumb if the trade failed. Traders focus on managing risk and being positioned to profit if the normal thing happens. When something unusual happens they may lose money, but it is by definition better to bet on the normal thing happening rather than the unusual. If the normal thing for declining stocks to do is bounce at support then I want to take advantage of this knowledge and use it to prioritize trades based on risk/reward, and also to take profits when a short position approaches support.
In a trending market I may be holding 8-12 trading positions, and close to fully invested for the swing trading account, and replacing them when they hit their stops or triggers. I will also be taking larger position sizes and holding the positions longer when the market is trending. The clearer the market direction, the more funds I will have invested. When the market is uncertain I reduce exposure to stocks, and increase exposure to ETFs. The ETFs do not have the same bang for the buck as stocks, but there is usually something trending up and trends are good for the account.
Steve Palmquist a full time trader who invests his own money
in the market every day. He has shared trading techniques and
systems at seminars across the country; presented at the Traders
Expo, and published articles in Stocks & Commodities, Traders-
Journal, The Opening Bell, and Working Money.
Steve is the author of,
“Money-Making Candlestick Patterns, Backtested for Proven Results’,
in which he shares backtesting research on popular candlestick
patterns and shows what actually works, and what does not. Steve
is the publisher of the, ‘Timely Trades Letter’ in which he shares
his market analysis and specific trading setups for stocks and ETFs.
To receive a sample of the ‘Timely Trades Letter’ send an email to sample@daisydogger.com. Steve’s website:www.daisydogger.com
provides additional trading information and market adaptive trading
techniques.
Jun 7, 2010 | Uncategorized
A trading log is an important element of a successful trading strategy.This presentation, recorded from last week’s free presentation will take you through the process of developing a trading log and why a trading log is critical to successful trading. Click on this link to view the archive
http://prowebinars.na5.acrobat.com/p10075144/
During the presentation Steve shared his personal trading log with attendees. This log is available for you to download at the following location
http://www.aiqsystems.com/market log 2010.xls
May 21, 2010 | Uncategorized
An Excerpt from the Timely Trades Letter.
The large drop in the market on Thursday was interesting, but the question is always what does it mean, and what is likely to happen next. In order to get some insight into this question I ran a test that looked back over the last three years to see how many times the market was down at least 80 points, and what would happen if I had bought at the opening the next day. The table to the left shows that during the last three years the market was down at least 80 points 16 times. If you bought the market the next day, and sold the following day, you would have been profitable eight times and shown eight losses. Essentially being down more than 80 points has not been predictive of whether or not the market will be up or down in the short run. When the market shows strong down days, like we saw on Thursday, the news media is full of stories about major corrections and the like. The news media’s job is to sell commercials, advertising space, and not necessarily to provide actionable information for traders. The market’s behavior over the last three years indicates that in the short-term it is just as likely to bounce after an 80 point drop as it is to continue going down. Based on this data we need to look elsewhere to determine an effective trading plan.
Extensions below the lower Bollinger band are unusual, as you can quickly verify by just scanning a NASDAQ chart for the last couple of years. The Bollinger bands contain the vast majority of the price action, and movements outside the band rarely last more than two or three days. The market typically moves back inside the lower Bollinger band by either moving sideways for a few days, or bouncing. I ran another test that bought the market every time the NASDAQ closed at least 10 points below the lower Bollinger band. I ran this test over the last 36 months using a one-day holding period to determine whether or not closing below the lower band was predictive of short-term behavior. The results, as shown in the chart to above indicate that during the last three years the market closed at lease 10 points below the lower band 21 times, and buying the open the next day and holding for one day was profitable 12 times and showed losses nine times. 57% of the time the market bounced. This data, along with other extensive testing, is why I take profits on short positions when the market becomes extended below the lower Bollinger band. It’s not a guarantee, but if the market bounces in the short-term 57% of the time then in the long run I am better off to have taken profits on shorts when the market moves below the lower band.
Trading is a statistical business, there are no magic indicators that tell you what is going to happen in a given situation every time. Trading is about knowing how the market, and different stock patterns, usually behave in a given situation; and then being positioned to profit if the market, or the stock set up, do the normal thing. Since by definition they do the normal thing most of the time, over the long run I have a good chance to see profits. On any given trade I do not know what is going to happen, it may be a winner or a loser, but over the long run being positioned to profit when the market or stock position does the normal thing is the way to bet.
Sometimes traders will start trading more aggressively when they are down in an attempt to get back to even. Draw downs are a fact of life in trading. Trading is not like drawing a paycheck. You do not get paid because it is Friday. I research the systems and then use that information when trading. If I have a losing streak I know that is to be expected and just stay focused on using the knowledge and skills that come from fully testing and analyzing trading systems.
Steve Palmquist a full time trader who invests his own money in the market every day. He has shared trading techniques and systems at seminars across the country; presented at the Traders Expo, and published articles in Stocks & Commodities, Traders-Journal, The Opening Bell, and Working Money.
Steve is the author of, “Money-Making Candlestick Patterns, Backtested for Proven Results’, in which he shares backtesting research on popular candlestick
patterns and shows what actually works, and what does not. Steve is the publisher of the, ‘Timely Trades Letter’ in which he shares his market analysis and specific trading setups for stocks and ETFs.
To receive a sample of the ‘Timely Trades Letter’ send an email to sample@daisydogger.com. Steve’s website:www.daisydogger.com provides additional trading information and market adaptive trading techniques.
May 15, 2010 | Uncategorized
An Excerpt from the Timely Trades Letter.
Volume patterns have an important effect on many trading systems. Volume measures the interest in a move, it shows how many people are interested in the current price pattern and how they are voting with real money. Rather than listen to the talking heads on the business channels discuss their opinions of what is going on, it is better to look at the volume patterns and see what people are actually doing with their money.
Serious traders will go through a learning curve as they study market behavior and how their trading systems function. They will have times when they run into situations that have not been experienced or researched and they may be unsure of what to do. This is normal, it is the price of admission to the trading business. My general rule is that when I am unsure I close the position. It is hard to go broke taking profits so my focus is on needing a clear reason to stay in a position, not wondering whether or not I should get out. If there is no clear reason to hold I take profits and move on to another trade.
When trading I am not holding out for the perfect trade, there is no such thing. Trading is about managing risks and I use the current market conditions to determine how many trades to be taking and the appropriate position sizing to use. Setups with more room to run are prioritized above ones with little room to run. Setups triggering on stronger volume compared to the previous days volume are prioritized above ones with lower trigger day volume. Setups with shallower pullbacks are prioritized above ones with deeper pullbacks. I then look at the setups that are triggering andstart from the top of the prioritized list and work down until I run out of setups or fill the number of positions I am interested in.
When I go to a trading conference I often ask how many traders are bullish, a number of hands go up. I then ask how many traders are bearish and more hands go up. I then ask how many traders do not care if the market is bullish or bearish, this usually generates some chuckles and a couple of hands. The serious traders do not care whether the market is going up or down, they know it is out of their control and they have tools to deal with both conditions so it does not matter. The traders laughing at this question usually have interesting stories of significant drawdowns from guessing incorrectly. Try not to be bullish or bearish, just focus on where the markets key trend lines and support/resistance levels are and adapt to what the market is actually doing.
Sometimes I will see traders trading weaker patterns because they have had a good winning streak and are ‘using the house’s money’. Nonsense, profits are yours there is no house. Each trade must stand on it’s own. Do not be tempted to trade weaker patterns after a winning streak. Stick to what works. Dance with the one that brought you.
Sometimes traders will start trading more aggressively when they are down in an attempt to get back to even. Draw downs are a fact of life in trading. Trading is not like drawing a paycheck. You do not get paid because it is Friday. I research the systems and then use that information when trading. If I have a losing streak I know that is to be expected and just stay focused on using the knowledge and skills that come from fully testing and analyzing trading systems.
Steve Palmquist a full time trader who invests his own money
in the market every day. He has shared trading techniques and
systems at seminars across the country; presented at the Traders
Expo, and published articles in Stocks & Commodities, Traders-
Journal, The Opening Bell, and Working Money. Steve is the author of,
“Money-Making Candlestick Patterns, Backtested for Proven Results’,
in which he shares backtesting research on popular candlestick
patterns and shows what actually works, and what does not. Steve
is the publisher of the, ‘Timely Trades Letter’ in which he shares
his market analysis and specific trading setups for stocks and ETFs.
To receive a sample of the ‘Timely Trades Letter’ send an email to sample@daisydogger.com. Steve’s website:www.daisydogger.com
provides additional trading information and market adaptive trading
techniques.
May 12, 2010 | Uncategorized
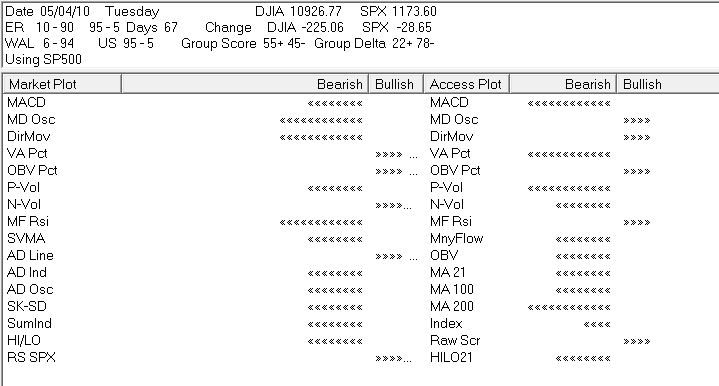
When the market is falling and the charts look terrible, your emotions want you to sell. Conversely, when the market is rallying and the news is good, your emotions want you to buy. Unfortunately, this can lead to selling at the low or buying at the high. One way of controlling your emotions is to set some market timing rules based on AIQ’s US score, a unique indicator that can be found on the Market Log report.
While the Expert Ratings on an individual stock can be suspect, the Expert Ratings taken from a large database of stocks are more effective in classifying the health of the market. That is, when a lot of stocks are giving AIQ Expert Rating buy signals, a market rally may be near. Conversely, when a large number of stocks are giving AIQ sell signals, a market decline may be approaching. Expert Ratings are either confirmed” or “unconfirmed.” A confirmed buy signal occurs when a stock has a recent Expert Rating up signal of 95 or greater along with an increasing Phase indicator. The opposite is true for confirmed sell signals. Unconfirmed signals, however, occur when there is an Expert Rating of 95 or greater but the Phase indicator fails to move in the direction of the signal. It is the unconfirmed signals that you should be interested in.
AIQ’s Market Log report lists the percentage of stocks giving unconfirmed signals (US). The US score is found near the top of the report (Figure 1). The percentage of stocks giving unconfirmed AIQ buy signals appears to the left of the hyphen and the percentage of stocks giving unconfirmed AIQ sell signals appears on the right side of the hyphen. In the image below we see that of the stocks giving unconfirmed signals, 95% are on the buy side and 5% are on the sell side. To open the Market Log report, go to Reports and double-click Summary Reports and then Market Log. I run the Market Log report on the S&P 500 database.
It is important to keep in mind that AIQ Expert Ratings fire against the trend. As the market declines, the percentage of stocks giving unconfirmed AIQ buy signals increases. As the market rallies, few stocks give buy signals and more stocks register sell signals.
The US score serves as an overbought/oversold indicator for the market. That is, when the US score 85% or more on the buy side, then that implies the market has recently experienced a sharp decline, is oversold, and due for a rally. Conversely, when the US score shows 85% or more on the sell side, then the market has rallied and is overbought.
Some AIQ users immediately enter the market when the US score moves to 85% or more on the buy side. They exit anytime the US score is 85% or more on the sell side. I don’t recommend this approach because the market can stay overbought or oversold for quite some time. Instead, it may be best to wait for a trend-following indicator such as the Directional Movement Index to confirm the new trend direction.
Rather than using the US score as a strict market timing model, use it as a simple tool to keep your emotions in check. It helps you avoid buying high or selling low. Here is the rule: Don’t turn bearish on the market and sell positions when the US score shows 85% or more buy signals. Similarly, never turn bullish or add positions when the US score shows 85% or more sell signals. This rule sounds simple but your emotions will tell you otherwise. When the US score has a high percentage of buy signals, the market has fallen and news reports are gloomy. That’s when your emotions tell you to bail. You may be selling right at a low, however. You either should have already sold or you should wait until the market rallies enough to where the US score is no longer giving a bullish reading.
When the market rallies it gets easier to buy. News reports are better and you think you may miss a big rally if you don’t immediately buy. Your emotions tell you to buy more but the US score can counteract your emotions. Don’t buy until the market pulls back enough to bring the US score out of bearish territory. Preferably, wait until the US score turns bullish Monitoring the US score on a daily basis gives you a good indication of the market’s health. It helps to control your emotions because it turns more bullish as the market falls and it turns more bearish as the market rises.
.
May 12, 2010 | Uncategorized
When the market is falling and the charts look terrible, your emotions want you to sell. Conversely, when the market is rallying and the news is good, your emotions want you to buy. Unfortunately, this can lead to selling at the low or buying at the high. One way of controlling your emotions is to set some market timing rules based on AIQ’s US score, a unique indicator that can be found on the Market Log report.
While the Expert Ratings on an individual stock can be suspect, the Expert Ratings taken from a large database of stocks are more effective in classifying the health of the market. That is, when a lot of stocks are giving AIQ Expert Rating buy signals, a market rally may be near. Conversely, when a large number of stocks are giving AIQ sell signals, a market decline may be approaching. Expert Ratings are either confirmed” or “unconfirmed.” A confirmed buy signal occurs when a stock has a recent Expert Rating up signal of 95 or greater along with an increasing Phase indicator. The opposite is true for confirmed sell signals. Unconfirmed signals, however, occur when there is an Expert Rating of 95 or greater but the Phase indicator fails to move in the direction of the signal. It is the unconfirmed signals that you should be interested in.
AIQ’s Market Log report lists the percentage of stocks giving unconfirmed signals (US). The US score is found near the top of the report (Figure 1). The percentage of stocks giving unconfirmed AIQ buy signals appears to the left of the hyphen and the percentage of stocks giving unconfirmed AIQ sell signals appears on the right side of the hyphen. In the image below we see that of the stocks giving unconfirmed signals, 95% are on the buy side and 5% are on the sell side. To open the Market Log report, go to Reports and double-click Summary Reports and then Market Log. I run the Market Log report on the S&P 500 database.
It is important to keep in mind that AIQ Expert Ratings fire against the trend. As the market declines, the percentage of stocks giving unconfirmed AIQ buy signals increases. As the market rallies, few stocks give buy signals and more stocks register sell signals.
The US score serves as an overbought/oversold indicator for the market. That is, when the US score 85% or more on the buy side, then that implies the market has recently experienced a sharp decline, is oversold, and due for a rally. Conversely, when the US score shows 85% or more on the sell side, then the market has rallied and is overbought.
Some AIQ users immediately enter the market when the US score moves to 85% or more on the buy side. They exit anytime the US score is 85% or more on the sell side. I don’t recommend this approach because the market can stay overbought or oversold for quite some time. Instead, it may be best to wait for a trend-following indicator such as the Directional Movement Index to confirm the new trend direction.
Rather than using the US score as a strict market timing model, use it as a simple tool to keep your emotions in check. It helps you avoid buying high or selling low. Here is the rule: Don’t turn bearish on the market and sell positions when the US score shows 85% or more buy signals. Similarly, never turn bullish or add positions when the US score shows 85% or more sell signals. This rule sounds simple but your emotions will tell you otherwise. When the US score has a high percentage of buy signals, the market has fallen and news reports are gloomy. That’s when your emotions tell you to bail. You may be selling right at a low, however. You either should have already sold or you should wait until the market rallies enough to where the US score is no longer giving a bullish reading.
When the market rallies it gets easier to buy. News reports are better and you think you may miss a big rally if you don’t immediately buy. Your emotions tell you to buy more but the US score can counteract your emotions. Don’t buy until the market pulls back enough to bring the US score out of bearish territory. Preferably, wait until the US score turns bullish Monitoring the US score on a daily basis gives you a good indication of the market’s health. It helps to control your emotions because it turns more bullish as the market falls and it turns more bearish as the market rises.
.