Oct 23, 2010 | Uncategorized
Steve Palmquist
Author of ‘The Timely Trades Letter’ and ‘How to Take Money from the Markets’
During 20 years of active trading experience I have researched, tested, and analyzed a number of trading systems and techniques. Some have shown promising results, some do not. I add tools to my trading toolbox based on their effectiveness. Trading systems are not effective because Aunt Millie or uncle Bob told you about them, they are effective because they work. One way to know if a trading technique works is through testing to see how different time periods, market conditions and parameters effect trading pattern results.
Making money in the stock market requires knowledge of what to trade, when to trade, and a variety of trading tools designed for different market conditions. Just as a carpenter will use several different tools when building a house, traders will use different tools to build their account. Using the same trading tool in all situations is like trying to build a house with just a hammer. Carpenters have tools designed for specific jobs, and so should traders.
The successful trader has a tool box with a variety of trading tools for use in different market conditions. The trader, like the carpenter, must go beyond just acquiring the tools. Traders must understand which tool to use for a specific task, and have a clear understanding of how the tool works, and what can and cannot be done with it.
Some tools, like a screwdriver, are fairly easy to learn how to use. Other tools, like a table saw, require a lot more training and experience to get the most out of. Most carpenters serve an apprentice period where they work with, and learn from, someone with years of experience. It is amazing how many people will just start trading their hard earned money without ‘learning the trade’ first. Understanding how to trade requires the ability to recognize basic trading patterns, and also knowledge of the market environments in which they work best.
There are no perfect trading systems, no matter what those slick brochures we all get in the mail say. Trading is a statistical business where it is important to manage risk. Every trading system has a certain percentage of winners and losers. Examples of six complete trading systems and how they perform in different market conditions is covered in ‘How to Take Money from the Markets’
There is no magic to trading. It is about putting the odds on your side and not trading unless they are. This sounds simple, but it takes…
a few years to get good at it. And like most things, while you are learning it is best to work with someone. The learning time is long because traders have to see how things behave in different markets, and learn to trade the odds and not their feelings. See www.daisydogger.com for more information on my trading experiences.
The market will not adapt to us, we must adapt to it. Active trading in a narrow range presents higher than average risk. Traders can compensate for higher risk market conditions by trading fewer positions and using smaller position sizes. Failure to do this can be costly.
I cannot control what the market does, so I have a plan for whichever path it picks and then trade the plan.
Successful trading is not about predicting what the market is going to do. It is about knowing how to react to whatever it does.
Always be thinking about taking and protecting profits.
You do not need to trade every day. Let the setups come to you and take the best ones. When the market is moving there lots of good setups to trade. If there are few setups, or most are failing, then listen to the message of the market.
Never enter a position without a plan for exiting.
Steve Palmquist a full time trader who invests his own money in the market every day. He has shared trading techniques and systems at seminars across the country; presented at the Traders Expo, and published articles in Stocks & Commodities, Traders-Journal, The Opening Bell, and Working Money.
Steve is the author of two trading books: “Money-Making Candlestick Patterns, Backtested for Proven Results’, in which he shares backtesting research on popular candlestick patterns and shows what actually works, and what does not.
“How to Take Money From the Markets, Creating Profitable Trading Strategies” in which he uses the results of extensive backtesting techniques to smash trading myths and get to the truth of what has worked and what has not. The book provides six fully analyzed and tested trading systems and shows how they have performed in different market conditions.
Steve is the publisher of the, ‘Timely Trades Letter’ in which he shares his market analysis and specific trading setups for stocks and ETFs. To receive a sample of the ‘Timely Trades Letter’ send an email to sample@daisydogger.com. Steve’s website:www.daisydogger.com provides additional trading information and market adaptive trading techniques.
Oct 20, 2010 | Uncategorized
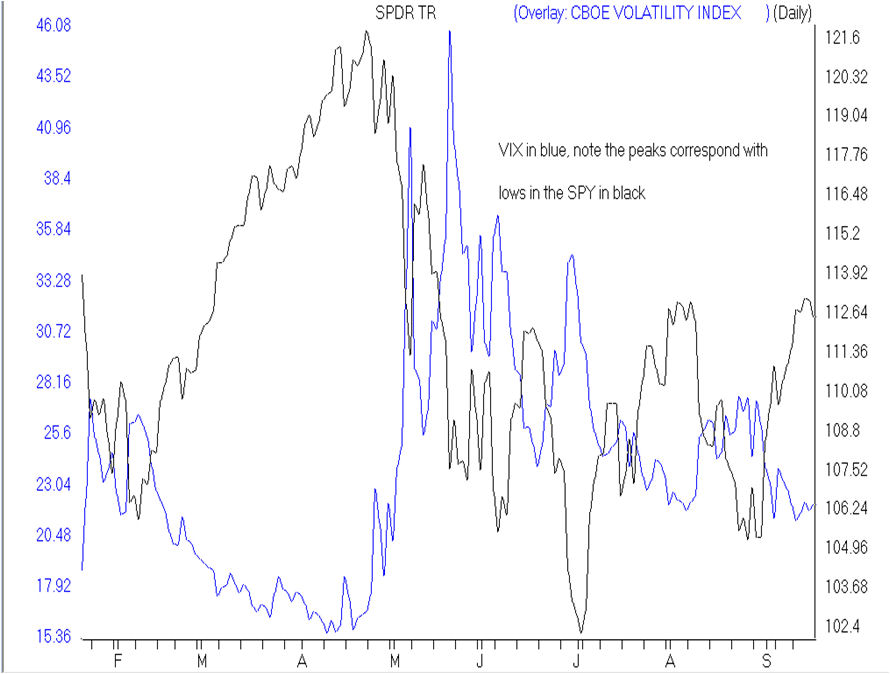
The VIX is the CBOE Volatility index and is a measure of the implied volatility of the SP500 stocks. Much is mentioned in the financial media on high levels of the VIX during steep down turns in the market. Question is can we make this into an indicator.
a quick overlay of the VIX on the SPY reveals some visual correlations with the VIX. Peaks in the VIX often correlate with bottoms in the SPYand vice verse.
To make use of the VIX as an indicator requires building an indicator using the closing price of the VIX. The EDS code to do this can be downloaded from
http://aiqsystems.com/VIXSPY-spread_lasvegas.EDS save this file to c:wintes32EDS Strategies.
To add a custom indicator in AIQ Charts, open Charts and go to Charts, Settings, Indicator Library, EDS Indicators. Clickk on Add, locate the EDS file VIXSPY-spread_lasvegas.EDS in your c:wintes32EDS Strategies folder.
For Plot Type select Histogram with Plotted Line and click next.
For Description I chose VIX with 10-day av.
UDF to Plot is Close_VIX
UDF for line is VIX_10day
Click Finish and then Done.
The indicator VIX with 10-day av will now be available at the bottom of the indicator control panel.
I chose a 10-day average to help smooth out the fluctuations, a 21-day average may also work.
Here’s what it looks like
The arrows on the chart show an interpretation that works well for timing the bottoms of the SPY. I’m looking for theVIX histogram to be 3 or more consecutive spikes above the 10 day average, followed by Change in direction from up to down of the 10 day average. Check it out for yourself and see what you think.
Oct 6, 2010 | Uncategorized
Intermarket analysis – Profitable trading strategies for commodities, stocks, bonds and currencies. Donald Dony
Did you know that; Gold leads the commodities (CRB index)? The US dollar usually trends in the opposite direction of the CRB index and Gold? All markets are interrelated and none move in isolation? Bond prices normally move in the opposite direction to stocks (inflationary environment)? All of these and many more inter market relationships will be revealed in Donald’s session. Best of all their are ETFs to trade all of them.
Learn more
Around the world in 80 mins – Global equity investment opportunities to capitalize on future trends. Richard Muller
During his presentation Richard will reveal where the best markets are to be trading and why, and the best values in each segment based on his extensive global equity research. Richard’s pedigree is unmatched in global equity analysis. Prior to joining Reuters and presenting his own TV show, Richard taught technical analysis to many investors and traders throughout Europe.
Learn more
The relationship between commodities and currencies in the context of the MACDI divergence strategy. Dale Wheatley
Dale has used the special relationship between currencies and commodities to his advantage by trading options on the ETFS. Whether it is the OIl Index, Gold Index, US Dollar index, SPY or others, correlations and leading and lagging factors all play in to finding the right time to be in the right option. Dale uses his unique MACD divergence strategy as the timing mechanism to enter option trades.
Learn more
Sep 28, 2010 | Uncategorized
Richard’s TV show on S&P 500 click here
Don’t miss Richard Muller at the Las Vegas Seminar October 9 – 10, 2010 call 1-800-332-2999 for special pricing, full agenda at http://aiqsystems.com/vegas2010.htm
Richard Muller is a global equities analyst with Thomson Reuters, where he delivers investment ideas on the Reuters Insider financial TV channel. Richard qualified as a Chartered Management Accountant, and holds a Masters of Science degree in investments, MSc ISIB. Richard is also a power user of AIQ TradingExpert Pro.
Sep 20, 2010 | Uncategorized
Don’t miss Richard Muller at the Las Vegas Seminar October 9 – 10, 2010 call 1-800-332-2999 for special pricing, full agenda at http://aiqsystems.com/vegas2010.htm
Richard Muller is a global equities analyst with Thomson Reuters, where he delivers investment ideas on the Reuters Insider financial TV channel. Richard qualified as a Chartered Management Accountant, and holds a Masters of Science degree in investments, MSc ISIB. Richard is also a power user of AIQ TradingExpert Pro.
Richards TV show on Point & Figure analysis on the major markets can be seen by clicking here
Sep 14, 2010 | Uncategorized
Keltner Channels are created by employing a moving average of each bar’s volatility from high to low, and then multiplying that moving average by a constant number to adjust the band distances from he moving average line. The moving average period to compute the average range and the average line. I’ve seen a variety of moving averages used, any where between 5 and 20 periods. With the constant used, I’ve seen between 1.3 and 1.9. Interpretation seems to vary based on moving average used.
When the MA is around 10 and the constant is 1.5 – 1.9 then
– When close is above the upper channel it’s time to get out of longs (or go short)
– When close is below the lower channel it’s time to cover shorts (or go long)
When the MA is around 20 and the constant is 1.3 – 1.9 then
– When close is above the upper channel it’s time to go long
– When close is below the lower channel it’s time to go short
My favorite interpretation
Price has to have touched the moving average but the day range must not be more than 50% of the distance from the average to the band. Bands and Moving Average must be trending up. Enter with intraday reversal in the direction of the trend.
I’ll be covering more of this indicator and more at the 21st Annual AIQ Seminar in Las Vegas, October 9 – 10, 2010. Visit here for more info http://aiqsystems.com/vegas2010.htm
Aug 31, 2010 | Uncategorized
Richard Muller, AIQ TradingExpert Pro power user and Equity Analyst at Reuters Insider uses point and figure to review the major workd markets on his show click here to view the show.
Richard will be one of guest speakers at this years AIQ seminar in Las Vegas October 9 – 10, 2010
Aug 31, 2010 | Uncategorized
by Steve Palmquist
Don’t miss Steve and 5 other speakers at the Las Vegas Traders Seminar October 9-10, 2010
http://aiqsystems.com/vegas2010.htm
The financial press is full of articles about the ‘Hindenburg Omen’ and how it indicates that the market is about to plunge. The Hindenburg Omen is a combination of new 52 week highs and lows, the NYSE’s 10 week moving average, and the McClellan Oscillator. The creator of the Hindenburg Omen compares it to ‘a funnel cloud that precedes a Tornado’ and says it shows there is ‘a high probability that the market is going to crash’. The images of the actual Hindenburg disaster, and a Tornado, are vivid and scary. This plays well in the media, after all their job is to attract viewers for their advertisers, and a lot of financial shows can be; well, boring.
The key issue for any indicator is not the images it brings to mind, but whether or not it has predicted outcomes more often than chance, and hence is a useful trading tool. According to an article on CNBC the Hindenburg Omen has been ‘roughly 25% accurate in predicting big market upheaval since 1987’. That is another way of saying it has been wrong most of the time. Traders need to carefully understand, test, and evaluate every potential tool before considering using it. New indicators come along all the time. Some sound interesting, but the issue is always, ‘how well has it worked, and based on that should I add it to my trading tool box’. The idea of testing and evaluating a tool before using it is a fundamental part of trading. Even a broken clock is right twice a day, being right occasionally proves nothing. Traders need to break through the myths and select tools that have shown some real promise.
There are hundreds of indicators and patterns being used by traders. Many of them provide no more accuracy in predicting market direction than a coin flip. The bigger issue is that many traders do not even know how often the indicators and patterns they use have shown positive results, and how often they have failed. Not knowing this information is like throwing darts in the dark. Effective traders know what percentage of the time their trading techniques work in bullish markets, trading range markets, and bearish markets. Successful traders have multiple tools designed for different market environments and switch between them based on what the market is actually doing, not what the talking heads on TV say it is doing. Are you trading myths or tested results?
The Stochastic indicator is better known and more widely used than the Hindenburg Omen, but traders need to ask the same question before using it. How often does it work, and based on that data is it a valuable tool for trading? I tested the effectiveness of the Stochastic indicator by looking at trades during 2008 when the stochastic was below 20 and then moved above 20. After entry, each position was held for five days and then sold. During 2008 there were more than 26,000 trades in my trading data base of 2,500 stocks and only 41% of them showed a positive outcome.
2008 was a tough year for stocks, and market conditions can effect most trading systems, so I looked at all the Stochastic buy signals during calendar 2007. There were more than twenty thousand stochastic buy signals during calendar 2007, but only half of them were winning trades and the annualized return of all the trades was negative. I also looked at the sixteen thousand stochastic buy signals that occurred during 2006 and found that about fifty one percent of them were winning trades.
I then looked at how the test results for the Stochastic indicator varied based on different holding times and in different market environments. The results of this testing are covered in ‘How to Take Money from the Markets, Creating profitable Strategies’ This book analyzes six ready to use systems and shows how they work, and when they work. Trading systems are not magic, or based on hope. Effective traders use trading techniques that have been fully tested and analyzed. They know exactly how the systems have performed under different conditions and how different filters and variables effect results. When they pull a tool out of the trading tool box they know what to expect, and how to use the tool. This knowledge comes from testing and evaluation, not hopes and dreams.
Effective traders select trading tools based on the markets current environment, and their results of testing trading tools in different market conditions. They know when to trade pullbacks or retracements, whether they should focus on shallow or deep pullbacks, how trading results may be effected by the volume patterns, if the price of the stock or the average volume of the stock effects results, and several other key stock behaviors that can be tested and then used to improve trading results. No one is born with this knowledge, it is gained by testing and evaluating the behavior of stock patterns and trading systems. Traders can do this work themselves using many of the popular software packages that allow writing programs to test different patterns and indicators, or they can review the research presented in ‘How to Take Money from the Markets’. Trading without a clear understanding of how the market and several different trading systems work is like driving blind. Blind drivers usually have a bad outcome. Rather than rely on some new indicator with unknown success rates I will focus on techniques that have been tested and shown to have reasonable success rates. The market may indeed take another leg down, if and when it does there are more reliable indications for traders than the Hindenburg Omen.
Steve Palmquist a full time trader who invests his own money in the market every day. He has shared trading techniques and systems at seminars across the country; presented at the Traders Expo, and published articles in Stocks & Commodities, Traders-Journal, The Opening Bell, and Working Money.
Steve Palmquist a full time trader who invests his own money in the market every day. He has shared trading techniques and systems at seminars across the country; presented at the Traders Expo, and published articles in Stocks & Commodities, Traders-Journal, The Opening Bell, and Working Money.
Steve is the author of two trading books:
“Money-Making Candlestick Patterns, Backtested for Proven Results’, in which he shares backtesting research on popular candlestick patterns and shows what actually works, and what does not.
“How to Take Money From the Markets, Creating Profitable Trading Strategies” in which he uses the results of extensive backtesting techniques to smash trading myths and get to the truth of what has worked and what has not. The book provides six fully analyzed and tested trading systems and shows how they have performed in different market conditions.
Steve is the publisher of the, ‘Timely Trades Letter’ in which he shares his market analysis and specific trading setups for stocks and ETFs. To receive a sample of the ‘Timely Trades Letter’ send an email to sample@daisydogger.com. Steve’s website:www.daisydogger.com
provides additional trading information and market adaptive trading techniques.
Aug 27, 2010 | Uncategorized
Richard Muller is a TradingExpert Pro power user and Thomson Reuters Insider Equity Analyst. His TV shows cover the full range of tecncial analysis and fundamental research. Check out this clip from August 24th. Click here
Richard will be one of the guest speakers at this years 21st annual AIQ Trading seminar in Las Vegas on October 9 – 10, 2010 details at http://aiqsystems.com/vegas2010.htm Seats are filling up fast. Don’t miss out.
Aug 26, 2010 | Uncategorized
Donald W. Dony, FCSI, MFTA
Don’t miss Donald at this year’s Las Vegas seminar click here
Following the August 18 Market Minute titled “S&P participation remains weak”, underlying support for the S&P 500 has deteriorated during the last few days. On August 18, the percentage number of advancing stocks within the broad-based index had fallen to 50%. In contrast, at the peak of the bull advance in April, that percentage number was over 75%.
Market conditions have continued to change to the negative side. Currently, only 34% of the stocks in the index are trading over their 200-day moving average. This means that 66% are trending down (Chart 1). When the majority of an index’s securities are declining, a downward trend develops. Similar conditions occurred in late 2007 and throughout 2008.
Bottom line: Market support has shifted faster than expected to the negative side. Advancing markets require a clear majority (60%-90%) of their underlying stocks to move higher if an index is going to trend up. When the percentage falls below 50%, markets start to decline.
Investment approach: Models indicate that most indexes trade on an approximate 4-month cycle. As the last trough was in late May to early June, the next probable low can be anticipated in late September to mid-October. With the underlying support for both the S&P 500 and TSX quickly eroding, increasing downward pressure can be expected over the next 4-6 weeks.
Investors may wish to take a very defensive stance this month by increasing cash percentages and raising stops. Good value opportunities are anticipated after this correction in Q4.