Dec 28, 2012 | Uncategorized
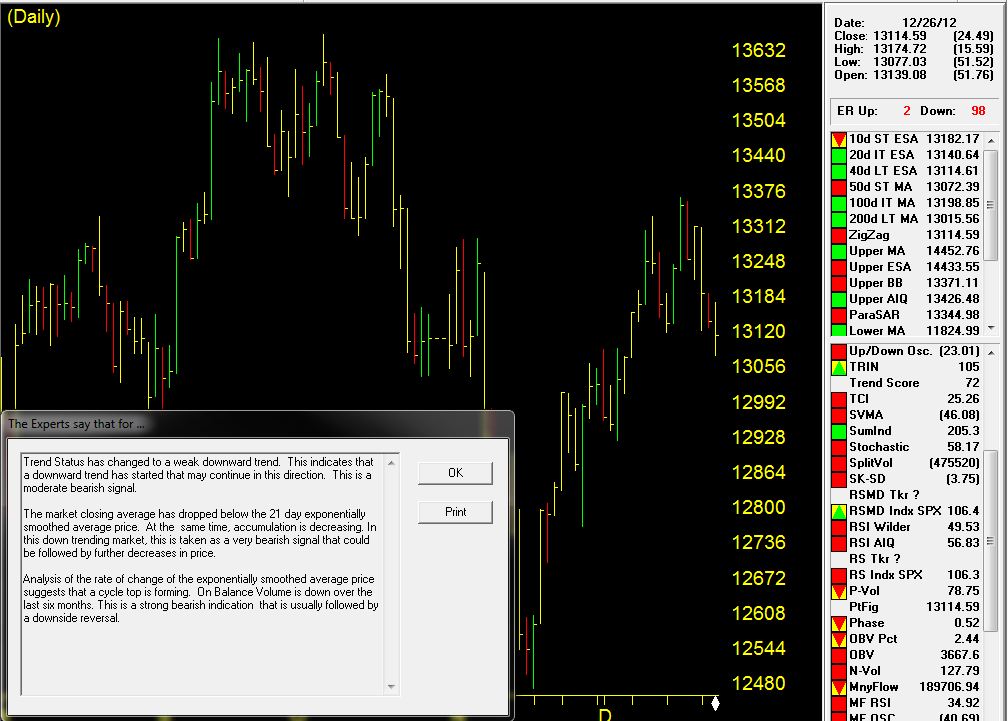
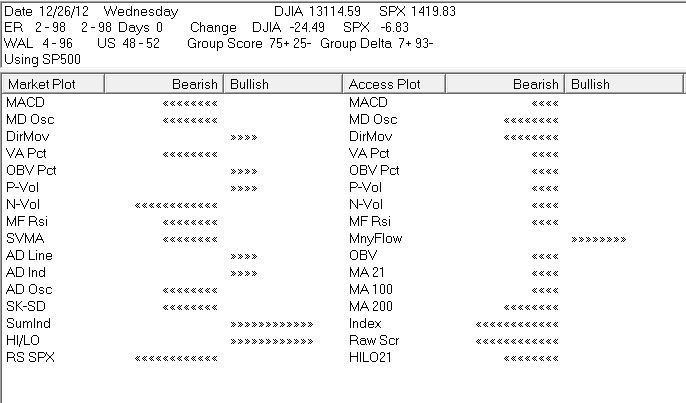
The Weighted Action List (WAL) a measure of tickers in the SP500 receiving confirmed Expert Ratings, is to the downside at 4-96. The Access Plot, a measure of the bullish/bearish for the sum of all SP500 stocks has only Moneyflow indicator in bullish territory.
We do not warrant, endorse or guarantee the completeness, accuracy, integrity or timelines of the information in this post. You must evaluate, and bear all risks associated with, the use of any information provided hereunder, including any reliance on the accuracy, completeness, safety or usefulness of such information. This information is not intended to be used as the primary basis of investment decisions. It should not be construed as financial or other advice or as an offer to sell or the solicitation of an offer to buy any security.
Dec 27, 2012 | Uncategorized
|
UNTIL 12/31/2012
DON’T MISS OUT
AIQ Education Holiday Sale
Prices starting at just $3.95
Dale Wheatley option course on 4 DVDs –
The Secret to Extraordinary Wealth in the Options Market
When Dale spoke to the attendees, everyone’s full undivided attention was set on him. He revealed his system that utilizes the power of the MACD (Moving Average Convergence Divergence) indicator, which is the only indicator he uses and swears by because of its astounding results with less risk. As he cuts right to the chase, he laid out the charts and let the simple rules demonstrate how it works and what it is capable of doing for the traders in the room
$995
$179

New Money-Making Trading Systems: Advanced Results from 6 Simple, Proven Strategies – Steve Palmquist
Long-term trading success is achieved using strategies that provide traders with an edge. But how can you prove that a system will show winning trades more often than random chance? You have to put it to the test. Don’t make costly mistakes by following the latest trading system blindly. Let Steve’s experience and expertise work for you. In this DVD course, he will not only provide you with six new powerful trading strategies, but he will show you exactly how to use each one to maximize profits.
$795
$149
|
Dec 12, 2012 | Uncategorized
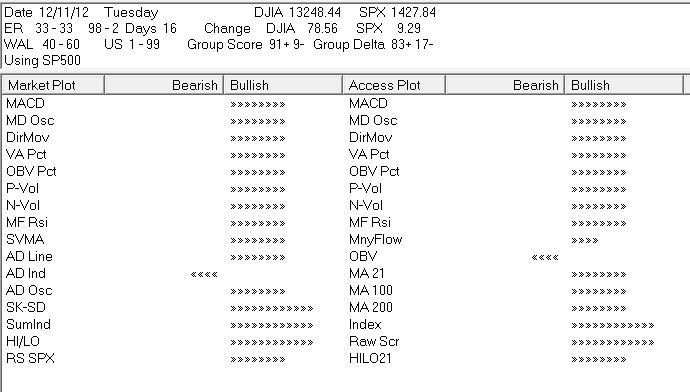
The cluster of Expert Ratings to the upside starting November 16th, right at the cusp of an 8% correction in the Dow 30 Index have born fruit. Almost 2/3rds of the correction has now been erased. Despite warning signs in the AIQ Market Log of a huge inbalance of unconfirmed ratings to the downside (US 1-99, see below), the market continues to drift higher.
Other points to note.
The US 1-99 rating is based on the component stocks of the S and P 500. 99% of the stocks that received an unconfirmed Expert Rating were to the downside.
The group/sector analysis reveals the majority of groups are still trending up and the trend is continuing.
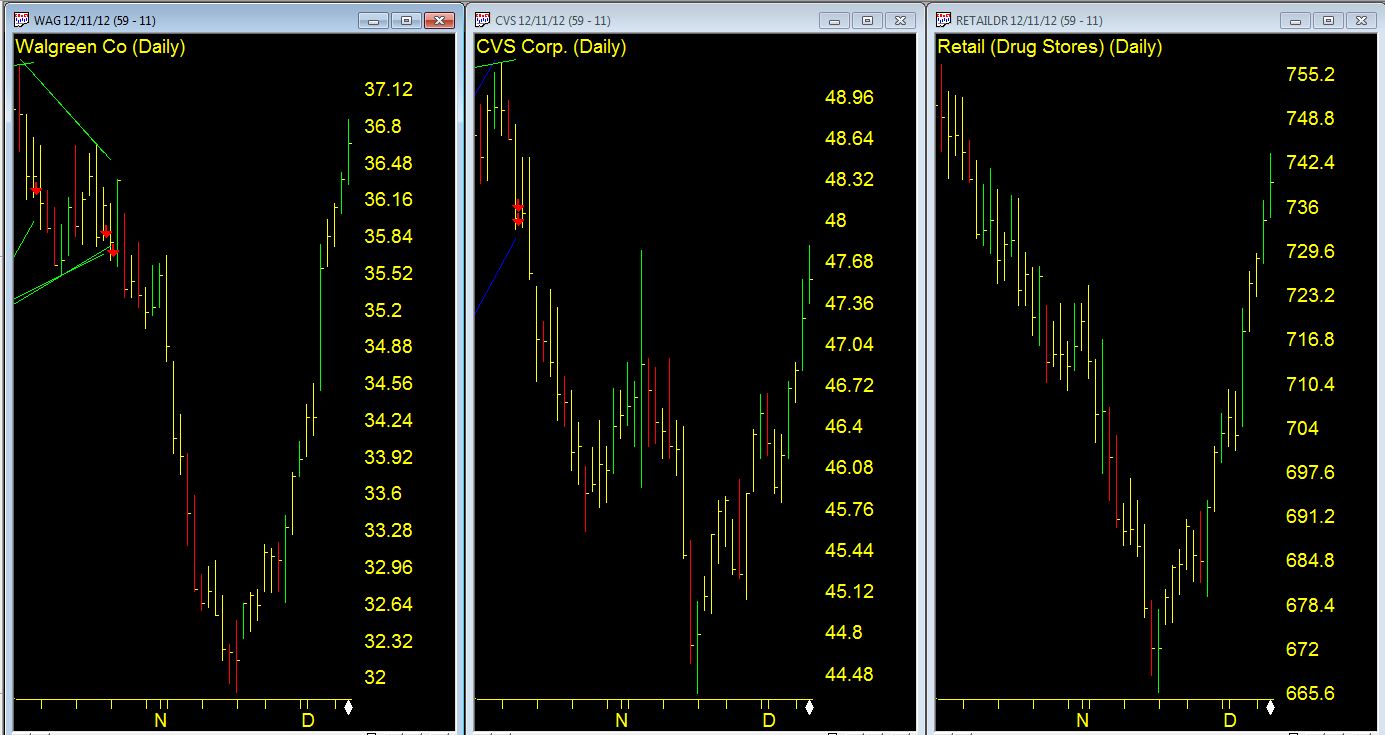
Leading groups like Retail (Drug Stores) are up over 10% from the November low.
We do not warrant, endorse or guarantee the completeness, accuracy, integrity or timelines of the information in this post. You must evaluate, and bear all risks associated with, the use of any information provided hereunder, including any reliance on the accuracy, completeness, safety or usefulness of such information. This information is not intended to be used as the primary basis of investment decisions. It should not be construed as financial or other advice or as an offer to sell or the solicitation of an offer to buy any security.
Nov 27, 2012 | Uncategorized
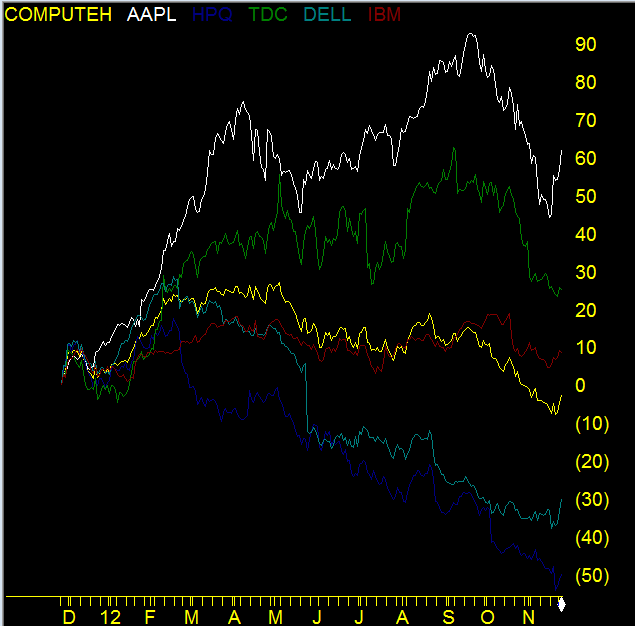
The ever changing landscape in computer technology hardware makes for a rough ride for some tech stocks. Take a look at this one year comparison chart of the S & P 500 Computer Hardware Group (yellow). The display shows the percentage change starting from one year ago. It’s down 3-4 %.
The component stocks tell a mixed tale. Apple (white) despite the recent pullback is still up over 60% from a year ago. Terradata (green) is also fairing well up around 25% and even IBM (red) is up near 10%. IBM and Terradata make a a good deal of profit from non-hardware sources.
The reason the group is down overall is a reflection of the poor performance of the 2 heavyweight PC goliaths, Dell and Hewlett Packard. Dell (light green) is down nearly 30% and HPQ (blue) down 50%. The 2 year comparison chart (not displayed here) shows HPQ down 70%, as the worse performer, with AAPL up 90% as the best performer in the group.
Nov 26, 2012 | Uncategorized
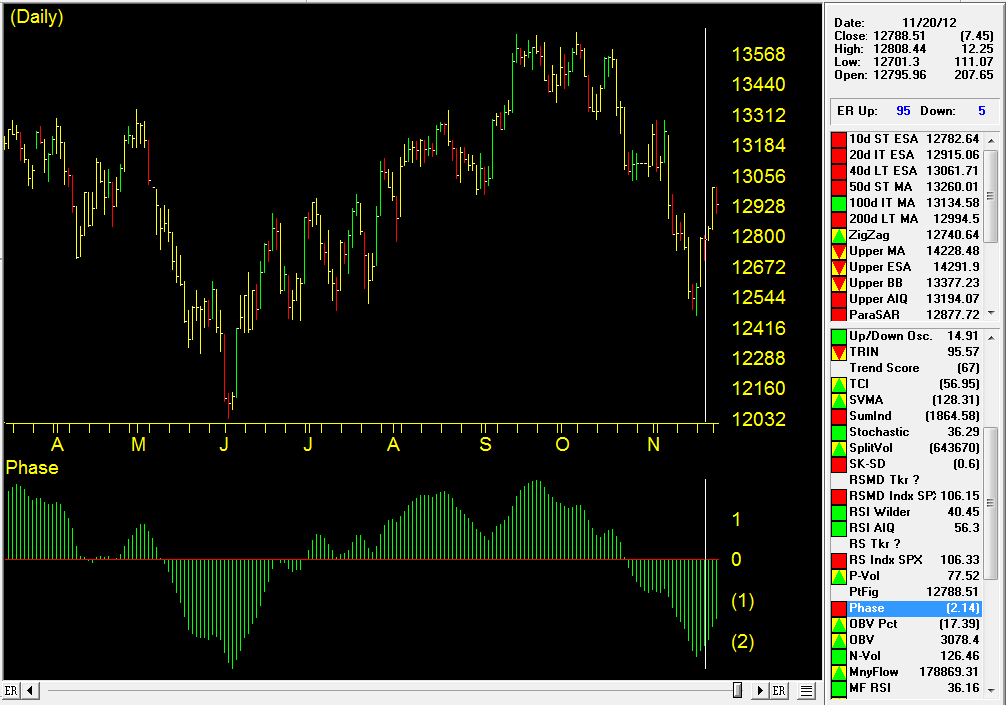
The AIQ Expert rating fired on the Dow Jones on November 20th, it was a confirmed signal as measured by the Phase indicator. So far so good. I would be looking at call options on the index from here into the year end rally. Q1 call options would have enough time value. So far so good.
Richard Muller
Oct 22, 2012 | Uncategorized
The AIQ code based on BC Low’s article in the November issue of Stocks & Commodities, “Identify The Start Of A Trend With DMI,” is provided at the following website: www.TradersEdgeSystems.com/traderstips.htm, and is shown below.
Several of the terms used by the author had to be interpreted to be converted into signal code such as, “cluster drifts down below level 30,” “converging,” “turning up,” and so on. My interpretation may differ from what the author intended, and other interpretations are possible. In addition, I had to come up with exits for the signals as none were given. In testing using the NASDAQ 100 list of stocks, the long-only system was profitable over the test period, whereas I could not get the short-only system to be profitable.
To test the author’s 3x DMI system, I used the NASDAQ 100 list of stocks and AIQ’s Portfolio Manager. A long-only trading simulation was run with the following capitalization, cost, and exit settings:
- Maximum of 10 open positions
- Size each position at 10 % of mark-to-market total capital
- Take no more than three new positions per day
- Compute the mark-to-market capital each day
- Three cents per share was deducted for each round-turn trade
- Select trades based on the highest 14-bar ADX reading
- Exit trades if the end-of-day stop-loss exceeds 3%
- Exit trades by protecting 50% of profits once profit level reaches 10%.
In Figure 8, I show the resulting statistics and long-only equity curve compared to the NASDAQ 100 index. For the period 12/31/1999 to 9/17/2012, the system returned an average internal rate of return of 20.7% with a maximum drawdown of 58.2% on 3/9/2009.
FIGURE 8: AIQ, EQUITY CURVE. This long-only equity curve is compared to the
NASDAQ 100 for the test period 12/31/1999 to 9/17/2012 trading the NASDAQ 100 list of stocks.
!IDENTIFY THE START OF A TREND WITH DMI
!Author: BC Low, TASC Nov 2012
!Coded by: Richard Denning 09/17/12
!www.TradersEdgeSystems.com
!INPUTS:
wLen is 14.
wLen3 is 3.
wLen4 is 4.
wLen5 is 5.
wLen8 is 8.
blvl is 30.
slvl is 70.
!CODING ABREVIATIONS:
H is [high].
L is [low].
C is [close].
C1 is valresult(C,1).
H1 is valresult(H,1).
L1 is valresult(L,1).
!NOTE: Wilder to expontential averaging the formula is:
! Wilder length * 2 – 1 = exponential averaging length
eLen is wLen * 2 – 1.
eLen3 is wLen3 * 2 – 1.
eLen4 is wLen4 * 2 – 1.
eLen5 is wLen5 * 2 – 1.
eLen8 is wLen8 * 2 – 1.
!AVERAGE TRUE RANGE:
TR is Max(H-L,max(abs(C1-L),abs(C1-H))).
ATR is expAvg(TR,eLen).
ATR3 is expAvg(TR,eLen3).
ATR4 is expAvg(TR,eLen4).
ATR5 is expAvg(TR,eLen5).
ATR8 is expAvg(TR,eLen8).
!+DM -DM CODE:
rhigh is (H-H1).
rlow is (L1-L).
DMplus is iff(rhigh > 0 and rhigh > rlow, rhigh, 0).
DMminus is iff(rlow > 0 and rlow >= rhigh, rlow, 0).
AvgPlusDM is expAvg(DMplus,eLen).
AvgPlusDM3 is expAvg(DMplus,eLen3).
AvgPlusDM4 is expAvg(DMplus,eLen4).
AvgPlusDM5 is expAvg(DMplus,eLen5).
AvgPlusDM8 is expAvg(DMplus,eLen8).
AvgMinusDM is expavg(DMminus,eLen).
AvgMinusDM3 is expavg(DMminus,eLen3).
AvgMinusDM4 is expavg(DMminus,eLen4).
AvgMinusDM5 is expavg(DMminus,eLen5).
AvgMinusDM8 is expavg(DMminus,eLen8).
!DMI CODE:
PlusDMI is (AvgPlusDM/ATR)*100.
PlusDMI3 is (AvgPlusDM3/ATR)*100.
PlusDMI4 is (AvgPlusDM4/ATR)*100.
PlusDMI5 is (AvgPlusDM5/ATR)*100.
PlusDMI8 is (AvgPlusDM8/ATR)*100.
MinusDMI is AvgMinusDM/ATR*100.
MinusDMI3 is AvgMinusDM3/ATR*100.
MinusDMI4 is AvgMinusDM4/ATR*100.
MinusDMI5 is AvgMinusDM5/ATR*100.
MinusDMI8 is AvgMinusDM8/ATR*100.
!ADX INDICATOR as defined by Wells Wilder
DIdiff is PlusDMI-MinusDMI.
ZERO if PlusDMI = 0 and MinusDMI =0.
DIsum is PlusDMI+MinusDMI.
DX is iff(ZERO,100,abs(DIdiff)/DIsum*100).
ADX is ExpAvg(DX,eLen).
DIdiff3 is PlusDMI3-MinusDMI3.
ZERO3 if PlusDMI3 = 0 and MinusDMI3 =0.
DIsum3 is PlusDMI3+MinusDMI3.
DX3 is iff(ZERO3,100,abs(DIdiff3)/DIsum3*100).
ADX3 is ExpAvg(DX3,eLen3).
DIdiff4 is PlusDMI4-MinusDMI4.
ZERO4 if PlusDMI4 = 0 and MinusDMI4 =0.
DIsum4 is PlusDMI4+MinusDMI4.
DX4 is iff(ZERO4,100,abs(DIdiff4)/DIsum4*100).
ADX4 is ExpAvg(DX4,eLen4).
DIdiff5 is PlusDMI5-MinusDMI5.
ZERO5 if PlusDMI5 = 0 and MinusDMI5 =0.
DIsum5 is PlusDMI5+MinusDMI5.
DX5 is iff(ZERO5,100,abs(DIdiff5)/DIsum5*100).
ADX5 is ExpAvg(DX5,eLen5).
!TRADING SYSTEM CODE:
Converge if (ADX3 < ADX4 Or ADX3 < ADX5) and ADX4 < ADX5.
Below if ADX3 < blvl And ADX4 < blvl And ADX5 < blvl.
TurnUp if ADX3 > ADX4 And ADX3 > ADX5 And ADX4 > ADX5.
Peak if (ADX3 > ADX4 Or ADX3 > ADX5) And ADX4 > ADX5.
Above if ADX3 > slvl And ADX4 > slvl And ADX5 > slvl.
TurnDn if ADX3 < ADX4 And ADX3 < ADX5 And ADX4 < ADX5.
PlusBottom if PlusDMI5 <= 5 And PlusDMI8 <= 10 And PlusDMI <= 10.
AbovePlus if ADX3 > Min(slvl+20,90).
PlusUp if PlusDMI5 > PlusDMI8 And PlusDMI5 > PlusDMI And PlusDMI8 > PlusDMI.
MinusBottom if MinusDMI5 <= 5 And MinusDMI8 <= 10 And MinusDMI <= 10.
MinusUp if MinusDMI5 > MinusDMI8 And MinusDMI5 > MinusDMI And MinusDMI8 > MinusDMI.
BuySig1 if countof(Below,5,0)>=1 And countof(Converge,5,0)>=1 And TurnUp.
SellSig2 if countof(Above,5,0)>=1 And countof(Peak,5,0)>=1 And TurnDn.
BuySig3 if countof(PlusBottom,5,0)>=1 And countof(AbovePlus,5,0)>=1 And TurnDn And PlusUp.
SellSig4 if countof(MinusBottom,5,0)>=1 And countof(AbovePlus,5,0)>=1 And TurnDn And MinusUp.
Buy if BuySig1 or BuySig3.
Sell if SellSig2 or SellSig4.
Sep 24, 2012 | Uncategorized
The AIQ code and EDS file for Gerald Gardner’s article in October 2012 Stocks and Commodities, “A Seasonal Strategy With Leveraged ETFs,” is provided at the following website: www.TradersEdgeSystems.com/traderstips.htm.
To test Gardner’s seasonal system with the leveraged exchanged traded funds (ETFs) DBC and DDM using AIQ’s Portfolio Manager, a trading simulation was run with the following capitalization and cost settings:
- Maximum of two open positions
- Size each position at 50 % of mark-to-market total capital
- Take no more than two new positions per day
- Compute the mark-to-market capital each day
- Three cents per share was deducted for each round turn trade.
In Figure 7, I show the resulting statistics and equity curve compared to the S&P 500 index (SPX). For the period 9/1/2006 to 8/13/2012, the system returned an average internal rate of return of 13.7% with a maximum drawdown of 32% on 3/5/2009. These statistics differ from the author’s due to my test starting earlier, and also, I picked up three trades that the author did not show in his list of trades with returns of -15.4%, -8.0%, and 1.0%. These differences may be due to differences in our data. In my test, there were only 12 trades and I would like to see more trades before I would rely on this as a trading strategy. This is the problem with testing systems on ETFs — there is not enough data.
FIGURE 7: AIQ, EQUITY CURVE. Here is the equity curve for my test system that uses the seasonal system for the period 9/1/2006 to 8/13/2012. Only the ETFs DBC and DDM were traded on each signal
! SEASONAL STRATEGY WITH LEVERAGED ETFs
! Author: Gerald Gardner
! Coded by: Richard Denning 8/14/12
! www.TradersEdgeSystems.com
! ABBREVIATIONS:
C is [close].
C1 is valresult(C,1).
O is [open].
H is [high].
H1 is valresult(H,1).
L is [low].
L1 is valresult(L,1).
V is [volume].
PEP is {position entry price}.
PD is {position days}.
OSD is offsettodate(month(),day(),year()).
! UDFs AND RULES FOR STRATEGY:
SMA50 is simpleavg(C,50).
OK_BUY if (month() >= 1 and month() <= 4)
or (month() >= 10 and month() <=12).
BUY if OK_BUY and C > SMA50.
SELL if month() = 5.
—Richard Denning
info@TradersEdgeSystems.com This email address is being protected from spambots. You need JavaScript enabled to view it. for AIQ Systems
Sep 19, 2012 | Uncategorized
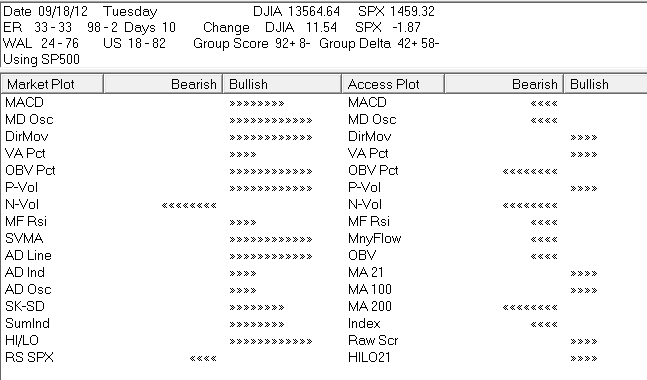
The last market Expert Rating 10 days ago was 98-2. WAL (Weighted Action List) and the US (Unconfirmed SIgnals) show a different picture. The WAL analyzes all the high up and down Expert Ratings on the S&P500 that have been confirmed by an independent indicator, in this case the Phase (MACD based). For the 500 stocks analyzed, 24% have ratings to the upside and 76% to downside.
Interstingly the US shows a similar picture 18% have ratings to the upside and 82% to downside. The US is a raw picture of the percenatge of stocks in S&P500 with unconfirmed up vs down high Expert Ratings. Past analysis has shown this US balance is an early indication of a possible change when the balance reaches 15-85 or 85-15.
Sep 19, 2012 | Uncategorized
The last market Expert Rating 10 days ago was 98-2. WAL (Weighted Action List) and the US (Unconfirmed SIgnals) show a different picture. The WAL analyzes all the high up and down Expert Ratings on the S&P500 that have been confirmed by an independent indicator, in this case the Phase (MACD based). For the 500 stocks analyzed, 24% have ratings to the upside and 76% to downside.
Interstingly the US shows a similar picture 18% have ratings to the upside and 82% to downside. The US is a raw picture of the percenatge of stocks in S&P500 with unconfirmed up vs down high Expert Ratings. Past analysis has shown this US balance is an early indication of a possible change when the balance reaches 15-85 or 85-15.