Market update 03/13/2013 and kudos

by Hank Swiencinski, AIQ TradingExpert Pro client for over 20 years, founder of ‘The Professor’s One Minute Guide to Stock Management’
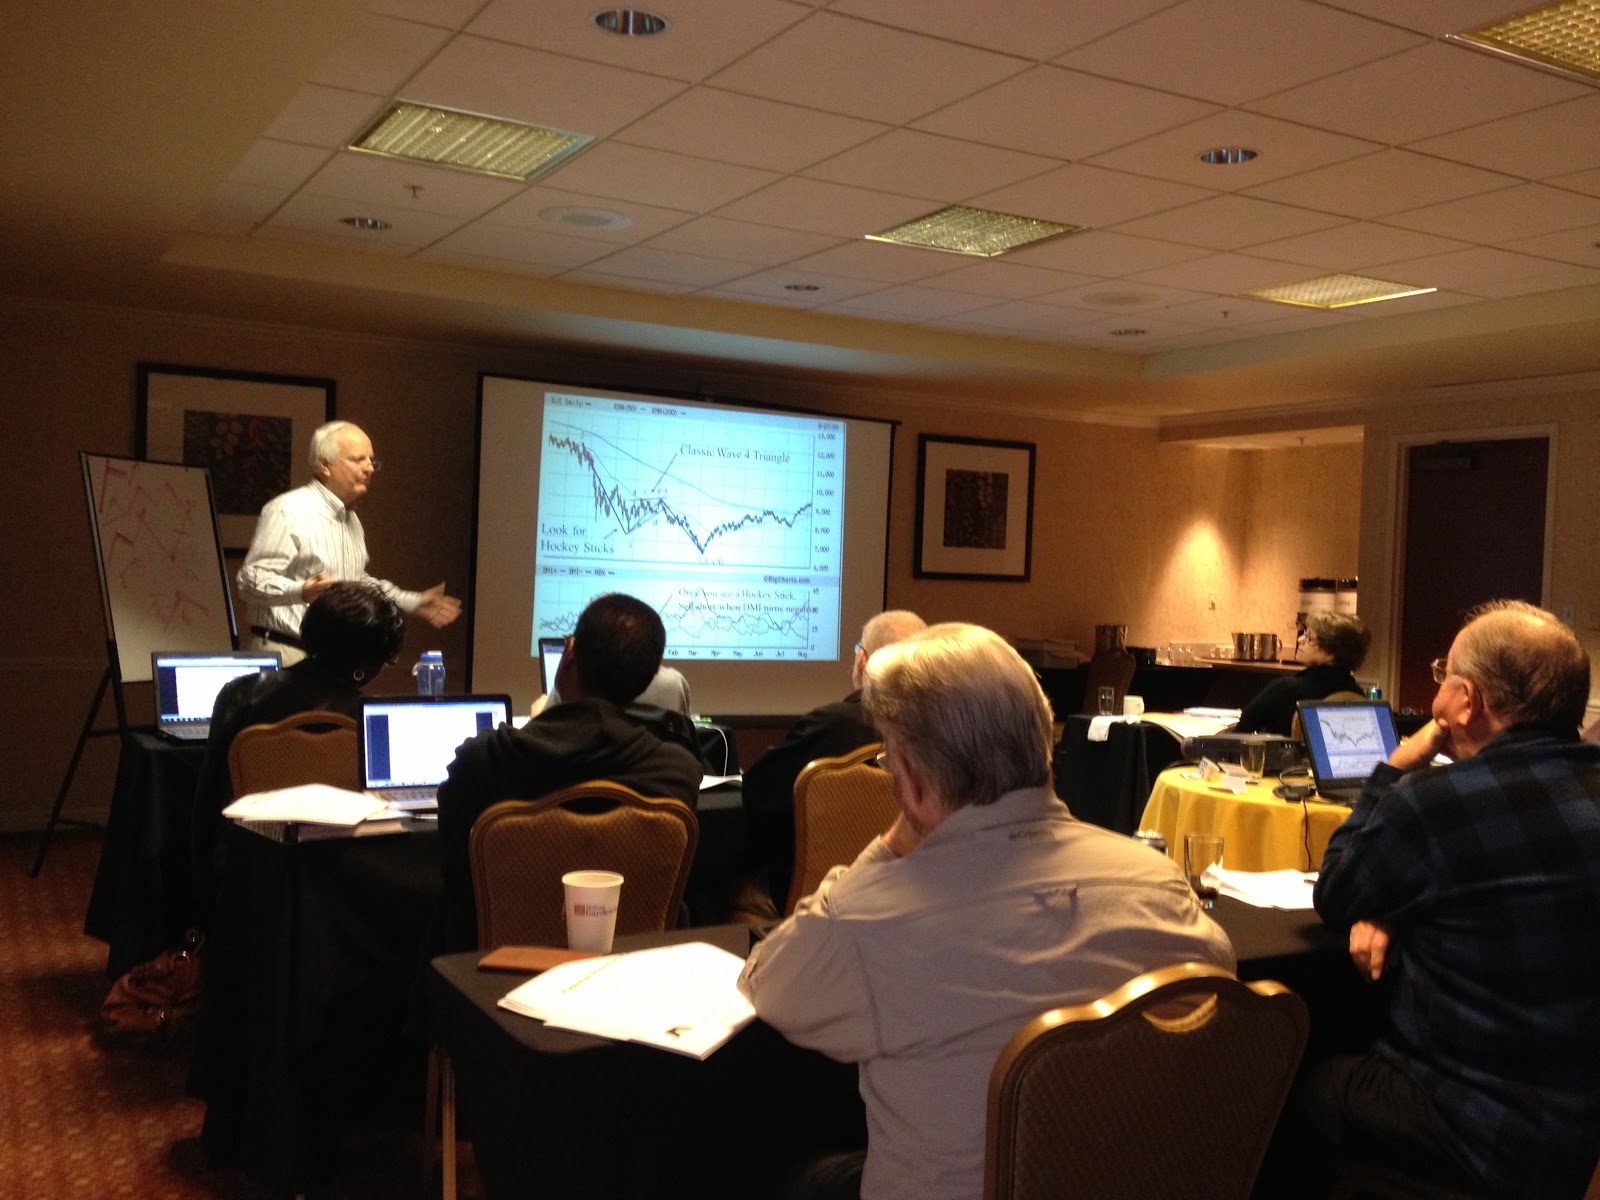
AIQ extends its congratulations to Hank for presenting a really excellent seminar on Saturday March 9, 2013. if you attended and have some additional feedback please e-mail Steve Hill
 
The Dow rose 2 points, closing at 14,450. The Dow got as high as 14,478 before pulling back. Volume was low again, coming in at 90 percent of its 10 day average. There were 244 new highs and only 17 new lows.
The A-D oscillator fell to 14.9 during yesterday’s trading. If we get a down day today, it’s likely that the oscillator will turn negative, meaning that most stocks on the NYSE are starting down trends. Coming at this point in the pattern, there is a good chance that wave ‘b’ down could be starting.
There is also a possibility that a pullback today could be part of a small corrective wave before one final push higher completes the ‘a’wave. At this point it’s hard to tell. And that’s why we will need to keep an eye on the Dean’s List. A small pullback today could turn out to be a false alarm. I don’t want to get too negative until I see a few of those positive ETFs start moving down or dropping off the Dean’s List.
The List remains very strong and the indicators on the cockpit remain positive. However the P-volume, which is one of our three PT indicators remains negative. It has been diverging from price ever since this leg of the current rally started on 25 February. It’s warning us not to get to comfortable.
If you get a chance today, take a look at the P-volume on the DIA, and while you’re at it check it on the Nasdaq (QQQ) as well. It’s actually pretty scary. This negative divergence is also evident on all of the indicators I use to measure market breadth, like the Summation Index, Hi/Lo Oscillator, Advance Decline Indicator, and VA Percent Indicator. They’re all diverging negatively, which is a warning. The Hi/Lo oscillator is actually lower now than it was on 1 February, when the Dow was at 14,009. It’s telling us that fewer and fewer stocks are participating in this rally. Always be careful when the Generals lead and the troops don’t follow.
We still have a ‘relatively’ small change (13.78 points) from the A-D oscillator on the board from two days ago. And because of this we’ll need to pay attention to any decline. There is still a possibility of a Big Move.
Emeritus was pretty quiet again last night, with only one stock being highlighted, and that was a short. This is the second day in a row that he hasn’t had much to say. I would expect that IF the market starts to turn negative, he will start to highlight a few more shorts for the Honor Roll. But right now, he’s silent…both on the long and short side.
Once again, with weak internals, I’m just watching for the markets to start to roll over. I believe the upside potential is limited at this point, so I’m not initiating any new long positions now. If we start out negative today, I will be looking to scalp a few shorts as I’m waiting. I will also be posting the Dean’s List after 1pm today to see if there are any changes. And if the market starts to trade lower, I will also be running Emeritus to see what he has to say as well. If he kicks out 1-2 shorts, I’ll continue to watch. But IF he starts to highlight 6 or more shorts, that will get my attention.
I’m on the sidelines.
That’s what I’m doing,
h
PT Class at UNF tonight.
All of the commentary expressed in this site and any attachments are opinions of the author, subject to change, and provided for educational purposes only. Nothing in this commentary or any attachments should be considered as trading advice. Trading any financial instrument is RISKY and may result in loss of capital including loss of principal. Past performance is not indicative of future results. Always understand the RISK before you trade.

Market Update March 1, 2013

by Hank Swiencinski, AIQ TradingExpert Pro client for over 20 years, founder of ‘The Professor’s One Minute Guide to Stock Management’. AIQ will be hosting a full day seminar with ‘The Professor’, March 9, 2013 in Orlando, FL. More info CLICK HERE
The Dow rallied up to 14,149, then fell into the close, finishing down 20 points at 14,054. Volume was low again, coming in at 92 percent of its 10 day average. There were 214 new highs and 28 new lows.
The combination of low volume and a late day sell-off is not something you want to see if you’re short term Bullish. Institutions are usually the ones that trade late the day, and when the market sells-off in the last hour, it’s usually because the smart money knows something. If the market starts moving higher in the weeks ahead, watch how the market trades during the last hour. If we start to see more late day sell offs, it will be another warning sign that a we could be approaching a top.
There was a small change in the A-D oscillator yesterday, so we need to be on the lookout for a Big Move in price within the next 1-2 days.
It appears that yesterday’s early rally was the completion of wave 1 up of 5 up. If this is the case, then yesterday’s late day decline was the start of wave 2 down. This wave should have an a-b-c pattern to it, and it should complete within the next few days. After that, I would expect the markets to put together enough strength to test the June 07 high of 14,198.
I posted the Dean’s List two times yesterday to show how the List was changing by dropping QID and RWM, the two inverse ETFs that were on the List. But yesterday’s late day decline change all that, and both ETFs stayed on the List, producing mixed signals. So once again, I would call the List a cautionary yellow. The Dean is likely telling us that a wave 2 down is starting.
Yesterday I mentioned that I was only going to scalp trade, and that’s what I did during the rally. Five of the six stocks highlighted by Emeritus produced winning trades on the 5s. HAL and HP were both up over a point intra day.
The DMI on the Dow(DIA) and Nasdaq (QQQ) remains positive. However the Coach, my main Money Flow indicator, remains negative. The P-volume is also negative and diverging on both indexes. So we have mixed signals from the cockpit. In other words, we need to be cautious again with any trades we make today. BTW, after the wave 2 completes, we will need to watch the volume indicators during the wave 3 rally. If they don’t turn positive, it will be another major sign that the rally will be met with stiff resistance.
If you get a chance today, you might want to look at the P-volume on a Daily Chart of the DIA. Note how during the past year, as the Dow (DIA) made each successive rally high, the P-volume did not. Look at the rally going into last March, then into October, and finally how the indicator continues to diverge into the current rally. The P-volume is warning us that each new high is being supported by less and less volume. It’s warning us that the tank could be getting close to empty. It’s not a major problem now, but it could be in the future.
I won’t be doing a lot today. I really want to see how this likely wave 2 develops. If I see something that I want to scalp, I’ll post it during the day,. But otherwise I’ll be on the sidelines.
One thing we need to remember is that we have a small change in the A-D oscillator on the Board. So we could see a move of 100+ points within the next 1-2 days. I don’t believe we will see the Big Move today. But IF we do, I don’t want to be holding a lot of stock IF that move is down. On the other hand, IF the market does move a bit lower today, in preparation for a Big move up early next week, I want to have a few candidate stocks at the ready so I can get into them IF the market starts to move up. Remember, the next move up should be an impulse wave. And if the wave has enough strength to push through 14,198, we could easily see 14,500. on the Dow, possibly higher.
So today, I will be trying to identifying stocks for the next rally leg. Remember, when we see a retracement wave coming, we always plan so we can take advantage of the next move higher.
That’s what I’m doing,
h
All of the commentary expressed in this site and any attachments are opinions of the author, subject to change, and provided for educational purposes only. Nothing in this commentary or any attachments should be considered as trading advice. Trading any financial instrument is RISKY and may result in loss of capital including loss of principal. Past performance is not indicative of future results. Always understand the RISK before you trade.

Weekend Strategy Review Part II – Feb 16th, 2013

by Hank Swiencinski, AIQ TradingExpert Pro client for over 20 years, founder of ‘The Professor’s One Minute Guide to Stock Management’.
AIQ will be hosting a full day seminar with ‘The Professor’, March 9, 2013 in Orlando, FL. More info CLICK HERE

 
The Dow started the week at 13,992. On Friday, it closed at 13,981 for a weekly gain of 11 points. Three weeks ago, the Dow was trading at 13,895. So for the past three weeks, the Dow has been in a trading range of about 100 points. This won’t last!
 
Trading ranges are consolidation areas, where the market takes a breather. When the market breaks out of a trading range, it usually does so in the direction it enters the trading range. And in this case, the direction was up. Trading ranges form the Blades of our Hockey Stick Pattern and act as compressed springs to propel prices higher. They give stocks the energy to hit their targets.
 
During its three-week consolidation, the Dow has remained in an Up trend. All of the PT indicators remain positive.
 
The Dean’s List remains long, strong and positive. And the Coach (Money Flow) was especially strong on Friday.
 
But there is one thing that happened on Friday that should be noted. The 2-period RSI Wilder on the Dow (DIA) finally became oversold. It finished the day with a reading of 14.91. Hmmm?
 
As you learned in Class, whenever a stock is in an Up trend, with all of the PT indicators positive, and the 2-period RSI Wilder pulls back into oversold territory (below 30) it’s time to get out the rifle and go hunting. In this case, because it’s the Dow (DIA) it’s more like time to bring out the shotgun…or a cannon!. There could be lots of things to shoot!
The same conditions exist on the Nasdaq, where the 2-period RSI Wilder on the QQQ finished the week with an oversold reading of 26.28. The SPY did not finish oversold as it remains in a strong up trend.
 
So what to do?
 
Assuming that what we have been seeing for the past 3 weeks is the development of a wave 4 consolidation Blade, there is a good chance that the market will start to move higher next week. And given that both the Dow and Nasdaq are currently oversold, they might be the best places to look for bargains. So that’s where I’m gonna start with my shopping list.
 
One obvious place to look is the indexes themselves, with DIA (hand grenade) and DDM (atom bomb). If the Dow starts to move higher, both should do nicely. Same for the QQQ and QLD if the Nasdaq comes to life.
 
Right now, Emeritus is only highlighting two stocks for the Honor Roll, PFE and AGN. From the feedback I received during the week, some of his stocks were very good to many of you. However as we have seen in the past, Honor Roll stocks not only tend to give us an initial pop, especially when they have tight Bands, but they tend to perform well even after being triggered. Remember, CNI caught my eye back in early January by being an Honor Roll stock. So all of the stocks that were listed this past week remain in play. Stocks like GE and HPQ are Dow components. CVX and XOM are the two energy components of the Dow. PFE, one of the stocks currently being highlighted by Emeritus, is also a Dow component.
 
IBM is another Dow component with an interesting Pattern. The stock popped 8.6 points reaching a high of 208.58 on 20 January, and has been pulling back ever since. The January pop was a ‘rope jump’, meaning that the current pullback could be a wave 2. IBM is currently RED on the 60s. It should be watched IF it turns GREEN, especially if it starts to move above 202.09.
 
Many of you had a lot of fun with SLB on Thursday, but as expected, the stock pulled back on Friday. It’s not a rifle trade yet, because the 2-period RSI is still not oversold. But IF SLB continues to pull back early next week; you know what I’m doing.
 
Anyhow, I’m seeing a lot of stocks with attractive patterns. And now, the major indexes appear to be finishing their three-week corrective pattern and have now become oversold.
Big Picture Strategy: It’s time to go hunting. If I’m right, wave 5 up should be starting very soon. If one of your favorite stocks on the MWL has pulled back during the past week or so, you might want to think about adding a few shares. Or IF your favorite stock has moved up during the rally, and you decided to take some or all of your position off the table, this might be a time to re-establish a new position.
 
The Dean’s List is telling us that a lot of sectors are very strong now. But the energy sector appears to be the strongest. Energy related ETFs currently represent 4 out of the top 7 on the List. So I need to be thinking about energy. But I’m not interested in all energy stocks now. Just the ones with nice Blades. I’m looking for stocks that have risen with the market, and have taken a breather. Stocks with low RSIs like HERO (29.09), MRO (31.94) and ATW (34.18).
 
All are rifle trades on the 60s.
 
On a different energy tack, you might consider something like uranium miner, CCJ, which has a beautiful HS Pattern in place. China alone has 16 nuclear power reactors in operation, with 30 more under construction. They currently plan a 5-6-fold increase in nuclear capacity by 2020. And even though construction of new plants in the US has been on a 30-year hold, 45 new countries are either constructing or have plans to construct nuclear power plants in the near future. They are going to have to get their uranium from somewhere. CCJ is on MWL, and has quietly started an Up trend three days ago when the 50 moved above the 200. It has a recent Blade high of 22.05. On Friday, it closed at 21.61. If it moves above 22.05, I’m a buyer.
 
Have a great weekend and remember to polish up that rifle.
 
That’s what I’m doing,
h
All of the commentary expressed in this site and any attachments are opinions of the author, subject to change, and provided for educational purposes only. Nothing in this commentary or any attachments should be considered as trading advice. Trading any financial instrument is RISKY and may result in loss of capital including loss of principal. Past performance is not indicative of future results. Always understand the RISK before you trade.

Weekend Strategy Review Part II – Sun, Feb 10th, 2013

by Hank Swiencinski, AIQ TradingExpert Pro client for over 20 years, founder of ‘The Professor’s One Minute Guide to Stock Management’.
AIQ will be hosting a full day seminar with ‘The Professor’, March 9, 2013 in Orlando, FL. More info CLICK HERE

Earlier this morning, I had some time to run a few algorithms that I don’t ordinarily check on a daily basis. With the Dow looking like it wants to test the all-time high this week, I was searching for clues that might tell me how high it could go IF the October 2007 highs were broken.

That’s pretty tough to tell at the moment, but I did notice something that could shed some light on the issue.
The past two weeks of sideways trading has served to develop all sorts of Blades on most of the stocks I watch. As a matter of fact, most of the stocks on the Member’s Watch List have this Pattern. But there’s something missing from most of them: Narrow Bollinger Bands.

There’s no toothpaste to squeeze out of the tube. As you recall from Class, one of the things that I like to see when I buy a stock is a Band Squeeze. When I see a stock pull back and develop the Blade of a Hockey Stick, I always look for a nice tight set of Bollinger Bands to form around the Blade.

Right now, I’m seeing a lot of positive Hockey Stick Patterns, but the Bands are anything but tight.

To give you an example of what I mean about ‘tight bands’, take a look at Wyndham Worldwide, WYN, last week’s Big winner. Notice how the Bollinger Bands tightened for 4 days just before the earnings announcement. That squeeze enabled the stock to pop 4 points. It was an easy trade if you placed a Buy Stop just above the recent high.

Same for CNI in early January. Look at the Band Squeeze. This is what enabled the stock pop and propel it to its target of 97.

But now, although I’m seeing a lot of stocks with HS Patterns, the Bands are a lot wider. This doesn’t mean that stock prices can’t push higher …they can, and most likely will. But they probably won’t pop higher. And pops are always a good sign for even higher prices.

Last week I told you how I plan to trade during the next few weeks as the market tests its old highs. I’m doing it mostly with stocks from the Honor Roll that have developed nice HS Patterns with tight bands.

On Friday, I highlighted a few of them for you. They included HERO, VALE, VRTX and SLV. I also added HPQ this weekend. On Friday, HERO moved past its recent high of 7 and triggered an entry.

The Bands on VALE, VRTX and HPQ remain tight as the HS Pattern continues to develop. If any of these stocks start to move above their recent ‘Blade Highs’,they could see a nice moves.

Same for the silver stocks and ETFs. This week, I will be watching SLV for a move above 31.41. IF SLV starts to pop, I’ll look to see if my favorite silver rabbit, Silver Wheaton, SLW, trades above 37.58. IF it does, I’ll do some initial buying, to be followed with additional Buy stops on the rest of the colony. Remember, we need to see silver pop here. With a BANG, not a whimper. If I’m correct about the wave count, silver should be ready to start a Major Wave 3 up. Wave 3s are impulse waves. They start with a BANG!!! And the tight Bollinger Bands could certainly help produce that initial BANG.

That’s what I’m doing,
h

All of the commentary expressed in this site and any attachments are opinions of the author, subject to change, and provided for educational purposes only. Nothing in this commentary or any attachments should be considered as trading advice. Trading any financial instrument is RISKY and may result in loss of capital including loss of principal. Past performance is not indicative of future results. Always understand the RISK before you trade.

IF a correction has started, I know that it should have multiple legs – The Professor’s perspective

by Hank Swiencinski, AIQ TradingExpert Pro client for over 20 years, founder of ‘The Professor’s One Minute Guide to Stock Management’.
AIQ will be hosting a full day seminar with ‘The Professor’, March 9, 2013 in Orlando, FL. More info CLICK HERE
The Dow fell 129 points, closing at 13,880. Volume on the NYSE was relatively low on the decline, coming in at only 94 percent of its 10 day average. There were 128 new highs and 11 new lows.
So now we wait. Yesterday’s decline was expected, but now we need to be patient to see how the correction will develop. Chances are that the markets will rally today, forming some type of retracement wave. I wouldn’t get too excited about trying to figure out which wave this is in the wave count. That’s because there is no way to tell.
All we know for sure is that the Dean’s List remains positive and all of the PT indicators are positive. The only cockpit indicator that is negative now is the Coach, our Money Flow indicator.
Also, all four of our breadth indicators are currently negative. The A-D oscillator came in with a reading of -73 last night, telling us that most stocks on the NYSE have started short term declines. In addition, the Summation Index, Hi-Lo Oscillator and the Up-Down oscillator are also negative. So some type of correction is underway. Once these indicators start to turn positive again, they will get my attention.
The question of where the correction will stop and where to re-enter a few trades is now on the table. Hmmm? What to do, what to do?
OK, here’s what I’m looking at. First of all, as I said before, I’m not worried about wave count at this point. That will come later. Right now there is only one wave to count. Yesterday’s decline.
My breadth indicators are telling me that the Dow has started to correct. But the Dean’s List and all of the PT indicators remain positive. Also, the 2-period RSI Wilder is not in oversold territory yet (only -35) so I can’t be looking for Eating Cake.
And IF a correction has started, I know that it should have multiple legs. As a minimum, a wave 2 needs to have three legs. So it’s likely that yesterday’s decline was only the first leg down of any corrective sequence. There needs to be at least one more down wave if it’s a wave 2, and several more if it’s a wave 4.
The other thing I know is that each one of the corrective waves should take the shape of an a-b-c pattern. Yesterday’s decline was almost straight down. So IF we retrace today, the move could be a small ‘b’ wave to be followed by another decline for wave ‘c’. If this happened, I would label it Wave A.
If you’re confused, don’t be. My point in discussing the above is not to confuse, but to help you understand that we will likely see all sorts of choppy trading during the next 1-2 weeks as the market forms the small a-b-c waves. Just be patient and realize that the market needs to do this to move higher. BTW, IF a wave 4 is forming, we’ll see even more a-b-c corrections develop, because we know that most of the time, wave 4s form triangles. And triangles have 5 waves.
Anyhow, be patient. I’m going to watch to see IF we rally today. IF we do, I will be looking at my volume and breadth indicators to measure the strength of the rally. If they lag, chances are the rally is a small ‘b’ wave that would set-up another decline later this week.
That will be the first place where I will look to re-enter a few trades…on the second decline, especially if volume dries up.
BTW, speaking of volume, it was a good sign that yesterday’s decline took place on relatively light volume. Low volume declines after the market hits a target are always nice to see. They tell me that the rally is not over, and to expect more upside once the market takes a breather.
I should also mention that there is a small possibility that the rally from early January is not over, and yesterday’s decline was the wave 4 correction of the first wave up. I don’t believe that it was, but there is a very small possibility that it could be. If this is the case, then the rally that I expect today should exceed Friday’s highs. But don’t get too excited…IF this happens it would only increase the odds that we’ll see another downside correction start next week.
Watching.
That’s what I’m doing,
h
All of the commentary expressed in this site and any attachments are opinions of the author, subject to change, and provided for educational purposes only. Nothing in this commentary or any attachments should be considered as trading advice. Trading any financial instrument is RISKY and may result in loss of capital including loss of principal. Past performance is not indicative of future results. Always understand the RISK before you trade.

The DMI Stochastic

The AIQ code based on Barbara Star’s article in January issue of Stocks & Commodities, “The DMI Stochastic,” is provided at www.TradersEdgeSystems.com/traderstips.htm.

To test the author’s DMI stochastic indicator, I used the NASDAQ 100 list of stocks and AIQ’s Portfolio Manager. A long-only trading simulation was run with the following capitalization, cost, and exit settings:

  • Maximum of 10 open positions
  • Size each position at 10 % of mark-to-market total capital
  • Take no more than three new positions per day
  • Compute the mark-to-market capital each day
  • Three cents per share was deducted for each round-turn trade
  • Select trades based on the highest ADX reading
  • Exit trades only with a system exit; no loss-stop or profit target stop used.

I coded three similar test systems. The first is the basic system that uses the author’s parameters of 10 (buy signal) and 90 (sell signal) on the DMI stochastic indicator. A stock has a buy signal when it has both a positive DMI oscillator and the DMI stochastic is below the buy level.
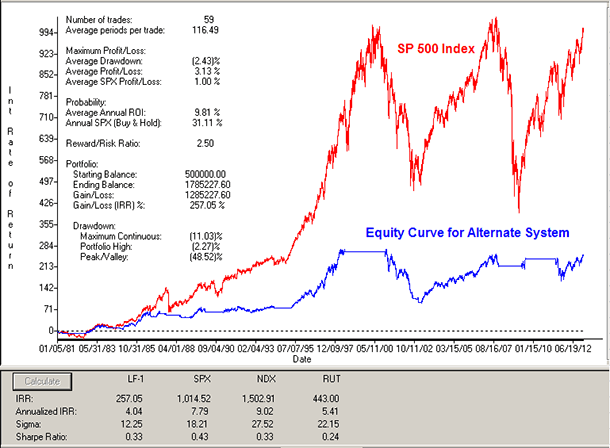
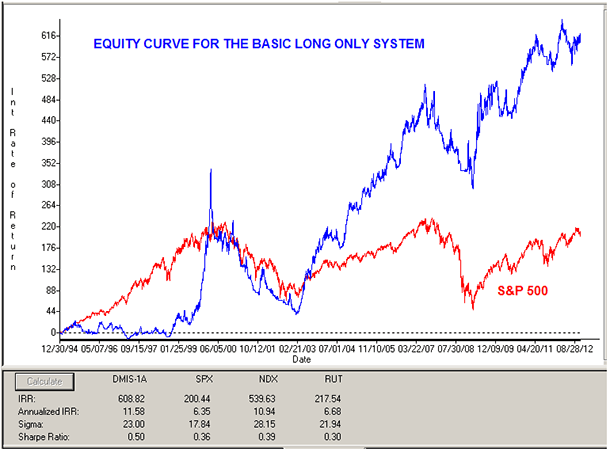
In Figure 6, I show the resulting long-only equity curve compared to the S&P 500 index for the basic system with the 10 buy-level parameter. For the period 12/30/1994 to 11/9/2012, the system returned an average internal rate of return of 11.6% with a maximum drawdown of 68.7% on 2/6/2003 and a Sharpe ratio of 0.50.

FIGURE 6: AIQ, BASIC SYSTEM VS. S&P 500. Here is the long-only equity curve (blue) for the basic system compared to the S&P 500 (red) for the test period 12/30/1994 to 11/9/2012 trading the NASDAQ 100 list of stocks.

I also tried increasing the buy-level parameter up to 70, which improved the return somewhat. I added a trend filter using the 50-bar moving average of the S&P 500 index, but it resulted in a reduced return without improving the maximum drawdown very much. The equity curve for this test is not shown. For the period 12/30/1994 to 11/9/2012, this system returned an average internal rate of return of 8.5% with a maximum drawdown of 46.1% on 10/2/1998 and a Sharpe ratio of 0.46.
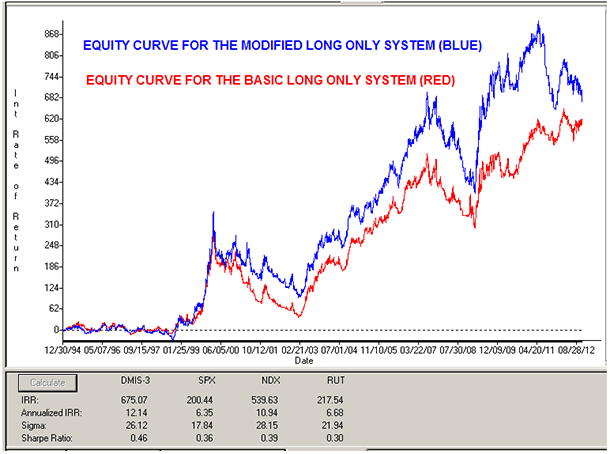
Finally, I tried adding an ADX filter such that the ADX level had to be above 30 to allow a signal. However, I also left the buy level at the high value of 70. In Figure 7, I show the resulting long-only equity curve for the basic system versus this modified ADX system. For the period 12/30/1994 to 11/9/2012, the system returned an average internal rate of return of 12.1% with a maximum drawdown of 56.1% on 2/6/2003 and a Sharpe ratio of 0.46.

FIGURE 7: AIQ, BASIC SYSTEM VS. MODIFIED SYSTEM. Here, the long-only equity curves are compared for the modified ADX system (blue) versus the basic system (red) for the test period 12/30/1994 to 11/9/2012 trading the NASDAQ 100 list of stocks.

The code and EDS file can be downloaded from www.TradersEdgeSystems.com/traderstips.htm, and is shown below.

!THE DMI STOCHASTIC
!Author: Barbara Star, TASC January 2013
!Coded by: Richard Denning 11/05/12
!www.TradersEdgeSystems.com
!INPUTS:
wLen is 10.
sLen is 3.
buyLvl is 70.
exitBuyLvl is 0.
sellLvl is 55.
exitSellLvl is 0.
!CODING ABREVIATIONS:
H is [high].
L is [low].
C is [close].
C1 is valresult(C,1).
H1 is valresult(H,1).
L1 is valresult(L,1).
! NOTE: Wilder to expontential averaging the formula is:
! Wilder length * 2 - 1 = exponential averaging length
eLen is wLen * 2 - 1.
!AVERAGE TRUE RANGE:
TR is Max(H-L,max(abs(C1-L),abs(C1-H))).
ATR is expAvg(TR,eLen).
!+DM -DM CODE:
rhigh is (H-H1).
rlow is (L1-L).
DMplus is iff(rhigh > 0 and rhigh > rlow, rhigh, 0).
DMminus is iff(rlow > 0 and rlow >= rhigh, rlow, 0).
AvgPlusDM is expAvg(DMplus,eLen).
AvgMinusDM is expavg(DMminus,eLen).
!DMI CODE:
PlusDMI is (AvgPlusDM/ATR)*100.
MinusDMI is AvgMinusDM/ATR*100.
!DMI OSCILATOR:
DMIosc is PlusDMI - MinusDMI. !Plot as historigram
!STOCHASTIC OF DMI:
HH is highresult(DMIosc,wLen).
LL is lowresult(DMIosc,wLen).
DMI_STOCH is (DMIosc - LL) / (HH - LL) * 100.
DMI_STO_SK is simpleavg(DMI_STOCH,sLen).
DMI_STO_SD is simpleavg(DMI_STO_SK,sLen). !Plot with 90/10 lines
!SYSTEM TO TEST INDICATOR:
!BASIC SYSTEM WITH AUTHOR'S SUGGESTED PARAMETERS:
Buy if DMIosc > 0 and DMI_STO_SD <= 10.
ExitBuy if DMIosc < 0.
Sell if DMIosc < 0 and DMI_STO_SD <= 90.
ExitSell if DMIosc > 0.
!SYSTEM WITH TREND FILTER AND MODIFIED PARAMETERS (LONG ONLY):
SPXc is tickerUDF("SPX",C).
SPXma is simpleavg(SPXc,50).
BuyT if DMIosc > exitBuyLvl
and DMI_STO_SD <= buyLvl
and SPXma > valresult(SPXma,10).
ExitBuyT if DMIosc < exitBuyLvl or SPXma < valresult(SPXma,10).
!SYSTEM WITH TREND STRENGTH FILTER AND MODIFIED PARAMETERS (LONG ONLY):
BuyADX if DMIosc > exitBuyLvl
and DMI_STO_SD <= buyLvl
and ADX > 30.
ExitBuyADX if DMIosc < exitBuyLvl.
!SIGNAL RANKING( use ADX):
ZERO if PlusDMI = 0 and MinusDMI = 0.
DIsum is PlusDMI + MinusDMI.
DX is iff(ZERO,100,abs(DMIosc)/DIsum*100).
ADX is expavg(DX,eLen).
List if C > 0.
 
—Richard Denning
info@TradersEdgeSystems.com
for AIQ Systems

The DMI Stochastic

The AIQ code based on Barbara Star’s article in January issue of Stocks & Commodities, “The DMI Stochastic,” is provided at www.TradersEdgeSystems.com/traderstips.htm.

To test the author’s DMI stochastic indicator, I used the NASDAQ 100 list of stocks and AIQ’s Portfolio Manager. A long-only trading simulation was run with the following capitalization, cost, and exit settings:

  • Maximum of 10 open positions
  • Size each position at 10 % of mark-to-market total capital
  • Take no more than three new positions per day
  • Compute the mark-to-market capital each day
  • Three cents per share was deducted for each round-turn trade
  • Select trades based on the highest ADX reading
  • Exit trades only with a system exit; no loss-stop or profit target stop used.

I coded three similar test systems. The first is the basic system that uses the author’s parameters of 10 (buy signal) and 90 (sell signal) on the DMI stochastic indicator. A stock has a buy signal when it has both a positive DMI oscillator and the DMI stochastic is below the buy level.
In Figure 6, I show the resulting long-only equity curve compared to the S&P 500 index for the basic system with the 10 buy-level parameter. For the period 12/30/1994 to 11/9/2012, the system returned an average internal rate of return of 11.6% with a maximum drawdown of 68.7% on 2/6/2003 and a Sharpe ratio of 0.50.

FIGURE 6: AIQ, BASIC SYSTEM VS. S&P 500. Here is the long-only equity curve (blue) for the basic system compared to the S&P 500 (red) for the test period 12/30/1994 to 11/9/2012 trading the NASDAQ 100 list of stocks.

I also tried increasing the buy-level parameter up to 70, which improved the return somewhat. I added a trend filter using the 50-bar moving average of the S&P 500 index, but it resulted in a reduced return without improving the maximum drawdown very much. The equity curve for this test is not shown. For the period 12/30/1994 to 11/9/2012, this system returned an average internal rate of return of 8.5% with a maximum drawdown of 46.1% on 10/2/1998 and a Sharpe ratio of 0.46.
Finally, I tried adding an ADX filter such that the ADX level had to be above 30 to allow a signal. However, I also left the buy level at the high value of 70. In Figure 7, I show the resulting long-only equity curve for the basic system versus this modified ADX system. For the period 12/30/1994 to 11/9/2012, the system returned an average internal rate of return of 12.1% with a maximum drawdown of 56.1% on 2/6/2003 and a Sharpe ratio of 0.46.

FIGURE 7: AIQ, BASIC SYSTEM VS. MODIFIED SYSTEM. Here, the long-only equity curves are compared for the modified ADX system (blue) versus the basic system (red) for the test period 12/30/1994 to 11/9/2012 trading the NASDAQ 100 list of stocks.

The code and EDS file can be downloaded from www.TradersEdgeSystems.com/traderstips.htm, and is shown below.

!THE DMI STOCHASTIC
!Author: Barbara Star, TASC January 2013
!Coded by: Richard Denning 11/05/12
!www.TradersEdgeSystems.com
!INPUTS:
wLen is 10.
sLen is 3.
buyLvl is 70.
exitBuyLvl is 0.
sellLvl is 55.
exitSellLvl is 0.
!CODING ABREVIATIONS:
H is [high].
L is [low].
C is [close].
C1 is valresult(C,1).
H1 is valresult(H,1).
L1 is valresult(L,1).
! NOTE: Wilder to expontential averaging the formula is:
! Wilder length * 2 - 1 = exponential averaging length
eLen is wLen * 2 - 1.
!AVERAGE TRUE RANGE:
TR is Max(H-L,max(abs(C1-L),abs(C1-H))).
ATR is expAvg(TR,eLen).
!+DM -DM CODE:
rhigh is (H-H1).
rlow is (L1-L).
DMplus is iff(rhigh > 0 and rhigh > rlow, rhigh, 0).
DMminus is iff(rlow > 0 and rlow >= rhigh, rlow, 0).
AvgPlusDM is expAvg(DMplus,eLen).
AvgMinusDM is expavg(DMminus,eLen).
!DMI CODE:
PlusDMI is (AvgPlusDM/ATR)*100.
MinusDMI is AvgMinusDM/ATR*100.
!DMI OSCILATOR:
DMIosc is PlusDMI - MinusDMI. !Plot as historigram
!STOCHASTIC OF DMI:
HH is highresult(DMIosc,wLen).
LL is lowresult(DMIosc,wLen).
DMI_STOCH is (DMIosc - LL) / (HH - LL) * 100.
DMI_STO_SK is simpleavg(DMI_STOCH,sLen).
DMI_STO_SD is simpleavg(DMI_STO_SK,sLen). !Plot with 90/10 lines
!SYSTEM TO TEST INDICATOR:
!BASIC SYSTEM WITH AUTHOR'S SUGGESTED PARAMETERS:
Buy if DMIosc > 0 and DMI_STO_SD <= 10.
ExitBuy if DMIosc < 0.
Sell if DMIosc < 0 and DMI_STO_SD <= 90.
ExitSell if DMIosc > 0.
!SYSTEM WITH TREND FILTER AND MODIFIED PARAMETERS (LONG ONLY):
SPXc is tickerUDF("SPX",C).
SPXma is simpleavg(SPXc,50).
BuyT if DMIosc > exitBuyLvl
and DMI_STO_SD <= buyLvl
and SPXma > valresult(SPXma,10).
ExitBuyT if DMIosc < exitBuyLvl or SPXma < valresult(SPXma,10).
!SYSTEM WITH TREND STRENGTH FILTER AND MODIFIED PARAMETERS (LONG ONLY):
BuyADX if DMIosc > exitBuyLvl
and DMI_STO_SD <= buyLvl
and ADX > 30.
ExitBuyADX if DMIosc < exitBuyLvl.
!SIGNAL RANKING( use ADX):
ZERO if PlusDMI = 0 and MinusDMI = 0.
DIsum is PlusDMI + MinusDMI.
DX is iff(ZERO,100,abs(DMIosc)/DIsum*100).
ADX is expavg(DX,eLen).
List if C > 0.
 
—Richard Denning
info@TradersEdgeSystems.com
for AIQ Systems

‘The Professors’ weekend update 1/27/2013

by Hank Swiencinski, AIQ TradingExpert Pro client for over 20 years, founder of ‘The Professor’s One Minute Guide to Stock Management’. AIQ will be hosting a full day seminar with ‘The Professor’,  March 9, 2013 in Orlando, FL. More info CLICK HERE
_____________________________________________________________________________________
The Dow rose another 70 points on Friday, closing at 13,896. The Dow was up 246 points for the week. The Nasdaq was up 19 points on Friday, and the rise kept the index in the Green for the week, closing up 15 points at 3,150. Volume was right at its 10 day average. There were 347 new highs and only 12 new lows.
Big Picture Strategy: So where are we now? Hmmm? Back in the beginning of January, when all the worrywarts on CNBC were talking about falling off the ‘fiscal cliff’, we talked about how ridiculous this was. I said that it was not gonna happen. On the last trading day of the year, we saw the Dow dip down to the 12,884 level and I mentioned that the Dean’s List was still positive. I said not to worry. That was over 1,000 Dow points ago.
Back then I was talking about a rally that would take the Dow back up to the 14,000 level. And now we’re just about 100 points from that target. How did I get so close to the target? By watching a Hockey Stick develop. By NOT listening to the talking heads.
We saw the rise from the November lows, and then the pullback towards the end of December, when everybody in Washington was ‘cliffing’it. We didn’t care about the ‘cliff’. What we were interested in was the Hockey Stick Pattern that was developing and the Dean’s List. That’s all that mattered to us.
We saw that the November to early December rise was just shy of 900 points, and that if we added it to the low on 31 December, it projected a target just under the 13, 800 level. And that’s where we were on last Thursday. Friday’s 70 point pop was a bonus.
Anyhow, that’s how we got to where we are now. But that’s ancient history. You guys are always interested in what’s next. You always want to know we do we go form here?
But before we talk about this, we need to understand a few things. Remember, this is a teaching web site. I’m not like Lou. I don’t just give you a bunck of stocks on a list, and tell you to buy them. That’s NOT what I do. I try to help you understand why they might go up (or down). I give you my reasons. I try to walk you through a few scenarios, and help you understand why your stocks are performing like they are. And IF you make mistakes along the way, or didn’t sell something when the indicators turned against you, perhaps you’ll learn the next time. Trading is a learning process. It takes time and requires discipline.
You just can’t go to the Lists and buy things. Not from my Lists, not from Lou’s, not from any one’s list. If you just use Lists, you’re gonna lose! You need to pay attention to the SIGN: .The SIGN consists of three things; Lists, Patterns and Indicators. So if I’m going to buy something, it needs to either be on the Dean’s List or the Member’s Watch List. Then I need to see a pattern. No pattern, no trade. We need to see a pattern so it can propel the stock higher. And then finally, we need to see the indicators turn positive. We need all three conditions. You all know the drill.
And IF we’re buying something from the Lists that is pulling back with an overslod 2-period RSI Wilder, we need to know where it is in the original Pattern. That way we’re NOT buying something at the top of the pattern. Like with CNI that I’ll talk more about below. The reason I’m buying CNI on pullbacks now is because I have higher targets. Many of the stocks on the Lists now are getting very close to their projected targets. We’re NOT interested in stocks that are near their projected targets now. If a stock is near its target and completing its HS Pattern, It could be ready to start a decline.
OK, now let’s get back to what we could see happen in the markets next week.
Firstly, there was a small change in the A-D oscillator on Friday. The small change was less than 7 points, so we should see a Big Move within the next 1-2 days.
Also, the rise of the last few weeks has driven all of my oscillators into EXTREME overbought conditions. Can they remain this way? Sure. But odds are high that they will not. The odds favor a pullback now. At least on the Dow. At 13,900, we’re about 100 points above the projected target from the HS pattern. And we know that stocks do not go straight up. They go up in waves. So now that we have reached our target, it would be perfectly normal to see a pullback.
If the Dow does start to pullback next week, it would tell me that current wave is likely the first wave up of the 5 wave sequence for Major Wave ‘E’ up. Next would be a wave 2 down. On the other hand, iF we continue to push higher, then we’re likely in the impulse wave or wave 3 up in the sequence. A Big Move to the upside early next week would confirm the wave 3 scenario.
While the Dow has been steadily making new highs, the forgotten Nasdaq has not. Held down by the ’crash’ in Apple, the Nasdaq100 has basically traded sideways for the past month. BTW, did any of you see that Apple traded down to EXACTLY 435 on Friday? EXACTLY!!! I hear that some old geezer with a Hockey Stick pattern was saying 435 several weeks ago. Hmmm?
Anyhow, with Apple likely to bounce from its lows, and the Nasdaq having traded sideways for the past month, it sets up a rather favorable condition for that market. I don’t see money leaving the market now, but with the end of January approaching, the institutions might be looking to shift out of some of the overbought big cap stocks into the smaller sisters. The NDX closed the week at 2737. If the NDX starts to move higher early next week and breaks 2760+, it could lead to a nice rally.in the small caps. The rally could see the index approach the 2850+ level. So watch the small caps and technology next week.
As long as the Dean’ List remains positive, I will remain positive. If we start to pullback, I will view the pullback as a buying opportunity.
The kinds of stocks that I want to be trading now are stocks in well defined Up trends, where the 50 is above the 200, and forming railroad tracks. Stocks that are in the Free Willy Mode. Not the ones ‘In Jail’ being held captive by their moving averages. If the market pulls back, I will be looking to buy these stocks when their 2 period RSI Wilder becomes oversold on the Daily Charts. Once I see this condition, I’ll look to buy them using the shorter term bars. Jut like we did two days ago with CNI. Two days ago, CNI was sitting there at 93.40 with it’s two period RSI Wilder buried in oversold territory. One day later it was trading over 2 points higher. CNI is a Free Willy stock. Just about everybody in the stock has a profit!
BTW, during CNI’s recent pullback, it formed a small ‘Blade’. The low of that Blade was 93.3, so if the 6 point ‘Stick’is added to that low, the stock now projects a target near the 99 level. About a month ago, I mentioned that the transports appeared ready for a breakout, and that the way I planned to play the move was with CNI. So far the move is right on track. So now, the HS patterns on CNI have three targets: 97, 99 and 105. The stock closed at 95.41 on Friday..
Now I’m just using CNI as an example here. There are many stocks in the Free Willy Mode now that should be looked at on pullbacks. Just take a look at the Member’s Watch List.
American Express, AXP, is another example of a Free Willy Stock. Two weeks ago, the stock hit an new high of 61.97. The previous high of 61.42 was made in May of last year. So now almost everyone who owns AXP is a happy camper. In the past week, the stock pulled back to the 59 level, where its 2 period RSI Wilder became oversold. The stock is currently trading less than a point from that oversold condition..
Also at some point last week, I think I mentioned how Green Mountain Coffee Roasters, GMCR, had a nice HS pattern, with narrow Bands. The stock was trading close to 40. Now its 46 and moving higher. Take a look a the ‘stick’ on GMCR and make your own projections.
So basically I’m doing two things now. As I mentioned above, I’m looking to buy stocks in up trends when they pullback, stocks like CNI and AXP. And I’m looking for stocks or ETFs from the Lists that have nice HS Patterns. Stocks like GMCR.
I am NOT looking to buy stocks that are ‘In Jail’. This is NOT the time for ‘Hope’ stocks, project stocks, turn around candidates, or junk. Junk like Apple. No matter how you slice AAPL, right now it’s still JUNK! The 50 is below the 200, and the PT indicators are negative. That’s how I define JUNK!
Have a wonderful weekend.
That’s what I’m doing,
h
All of the commentary expressed in this site and any attachments are opinions of the author, subject to change, and provided for educational purposes only. Nothing in this commentary or any attachments should be considered as trading advice. Trading any financial instrument is RISKY and may result in loss of capital including loss of principal. Past performance is not indicative of future results. Always understand the RISK before you trade.

The Webinar Room opens in 60 minutes for Hank Swiencinski and AIQ session

DON’T MISS OUT

The Webinar Room opens in 60 minutes for Hank Swiencinski and AIQ
to bring you

“The Professor’s One Minute Guide to Stock Management: The Basics”

We will be starting in less than 90 minutes, at 4:30pm ET

So make sure to reserve your seat now.

Click here to register for the webinar

Today at 4:30pm ET:

The Professor will reveal some of his hallmark strategies that have helped create many successful traders and investors.

“Hank has been an AIQ client for over 25 years. We met over lunch late last year, and I was immediately struck by his erudite approach to trading and investing.

His knowledge of technical analysis and the practical application of wave theory, moving averages, and DMI is impressive.”

Stephen Hill,
President
AIQ Systems


Weekend Strategy Review 01-20-13

by Hank Swiencinski, AIQ TradingExpert Pro client fro over 20 years, founder of ‘The Professor’s One Minute Guide to Stock Management’. Later this month Hank will be presenting an AIQ webinar covering some of the techniques he teaches, like cycles and stick patterns.
Hank will be presenting this free AIQ webinar entitled The Professor’s One Minute Guide: The Basics, January 24th, 2013, 4:30 – 5:15pm eastern,
Click on this link to register. Here’s a sample of his Weekend Strategy Review 01-20-13
The Dow rose 53 points on Friday, closing at 13,650. It was up 161 points for the week. The Nasdaq was down 1 point on Friday, but was up 9 points for the week. The Nasdaq is having a tough go of it lately, mostly because of Apple. The characteristics of the company have changed radically in the past month. Apple went into a sustained up trend almost four years ago, on 11 May 2009, at a price of 129.49. During that time, the 50 NEVER once fell below the 200. Pretty amazing! But that is no longer the case. On 2 October of last year, the PT indicators turned negative and then on 19 December, the 50 dropped below the 200. So now, any rally in Apple must be viewed with suspicion. That’s because any rally could be the development of the Blade of a negative Hockey Stick pattern, which could lead to significantly lower prices. And it’s not often that you see a stock that has a potential ‘Stick” of over 200 points, so we need to be careful. Remember, Apple represents a significant portion of the Nasdaq100. And IF Apple continues its downtrend; the Nasdaq will likely continue to experience problems. But let’s not focus on Apple for now. Let’s look at the Big Picture instead.
Big Picture Strategy: The Dean’s List remains strong and the cockpit indicators are positive. I will remain Bullish as long as my Lists and indicators stay positive. The strategy is very simple now. Once we get closer to the 14,000 level, I will re-evaluate the strategy. Not now.
OK, we’re at 13,650, just 450 points from our target of 14,000+. What now? Just a few weeks ago, we were trading under 12,900 and some of the folks on CNBC thought the world was coming to an end. We didn’t. We saw that the Dean’s List was much too strong for Armageddon. We also saw that the decline that occurred since the middle of December looked more like the Blade of a Hockey Stick Pattern than the beginning of any end of the world scenario. Pullbacks after rallies are normal. They are positive, not negative, no matter how the world looks to the folks on CNBC. We also saw that the 50 was still comfortably above the 200, and that the pullback only caused the price to drop back to the 200. The Dow was taking a break. It was resting.
So why am I writing about this today? Well, I want you to take a quick look at the Dow. I want you to once become familiar with the pattern. Get it burned into memory. Specifically, I want you to look at the stick that started on 15 November and completed on 18 December. Note that the November low was 12,472, and the high was 13,366. or a rally of 894 points. So if we add 894 to low of the Blade that completed on 31 December, 12,884, when Congress was trying to keep us from falling off the ‘fiscal cliff’, we get 13,778. Only 222 points from 14,000.
In the Classroom, we talk about how the market moves in waves. We also talk about Ending Diagonals and termination patterns. And the one thing we know about them is that the final waves of these larger patterns should consist of 5 waves. And because the most recent ‘Rope Jump’ that occurred in early December told us that the move was likely a wave 1, which was followed by a retracement, it’s even more likely that what we are seeing now is the impulse wave, or wave 3 of the 5 wave sequence that will eventually complete the Ending Diagonal Pattern.
So assuming that we are in the impulse wave, then we also know that it too should consist of 5 waves, So odds are that the move that started on 31 December still has a lot more to go. We know that the move probably won’t be straight up. That there will be pullbacks along the way, and each of these pullbacks should be viewed as a buying opportunity.
Buying opportunity as in Buy the Cake, Eat the Cake (BTC-ETC). That’s what we’re looking for now.
One of the stocks that I’m currently watching is Green Mountain Coffee Roasters, GMCR. Before you look at Green Mountain on a Daily Chart, I suggest that you take a look at it on a Weekly Chart. That way you’ll have a better feeling for the kind of stock we’re dealing with.
Green Mountain had an incredible ride once the market turned positive in March 09. It rose from relative obscurity to being a 115 stock in 2 ½ years. Then the coffee tree came crashing down and GMCR fell back to earth, once again trading in the teens. Hey…GMCR is a coffee grower not a purveyor of magic potions. Anyhow, for the past few months, GMCR has been appearing on the Member’s Watch List. We saw it jump the ropes in late November, an indication of a possible wave 1. Since then, it has spent the last 6 weeks forming what appears to be a wave 2. The stock is currently in a well defined up trend, and is on MWL with positive PT indicators. More importantly, the Bands are narrowing, which could be telling us that its K-cups could be ready for some serious brewing. If the stock starts to move above 43.79 and push its Bands, it could be headed significantly higher.
On the other hand, on Friday, Bank of America reported fourth-quarter earnings that were 63 percent lower than last year but slightly above expectations. A decrease in revenue and a few costly blunders from their 2008 acquisition of Countrywide and Merrill Lynch were the reasons cited for the decline.
Now, most of you know that I’m not a big fan of bank stocks. I’m not. But I also know that many of you are. But when it comes to stock ownership, the only thing I really care about is patterns, indicators, and Lists. Being a fan of something is for sports, not stocks. And right now, the events leading to BAC’s earnings announcement have created a very interesting situation on its Daily chart.
BAC is currently in a well defined up trend, and when the stock pulled back on Friday, it caused the 2-period RSI Wilder to become oversold. Now I know that a few of you might be looking at BAC and thinking about using the BTC-ETC strategy. But as we know, to use this strategy, the stock must be in an up trend, and have positive indicators. During Friday’s pullback, the DMI and P-vol on BAC turned negative. So right now, BAC is NOT a candidate for my BTC-ETC strategy. The stock was on the MWL recently, but dropped off during the pullback. That’s OK. But to use BTC-ETC Strategy, we still need to see an Up trend, an oversold 2-period RSI Wilder and POSITIVE indicators. So I still say…. NO Banks! Besides, take a look at BAC’s weekly Chart since 2009. It’s been almost 4 years since the stock bottomed, and the chart still looks horrible! Give me Free Willy stocks anytime! I can’t get interested in BAC until I see it ‘Jump the Ropes’ on the Weekly.
Another stock I’m watching is American Express. AXP. It’s on the MWL and has pulled back on the Daily’s. The stock is in a well-defined up trend with positive PT indicators and is a candidate for my BTC-ETC strategy
Also, on Friday, we saw Schlumberger, SLB, pop 3.13 points to 76.50, after being highlighted by Emeritus and placed on the Honor Roll at 73.22 two days before.
After jumping the ropes in mid-September for its wave 1, SLB formed a 2 wave pullback into mid-November. Since that time, it jumped the ropes again for wave 3.1, that was followed by another 2-wave pullback or wave 3.2. The PT indicators turned positive on 4 January at 72, and Friday’s jump appears to confirm that the impulse wave is underway. Take a look at the HS/w Blade Pattern on the Weekly’s.
While you’re at it, you might want to compare SLB to our energy rabbit, GPOR, which continues on its tear. Do you see the massive HSw/Blade pattern that formed on the Weekly chart of GPOR since 2009? That’s what is propelling the stock higher now. Now go back to SLB. See the similarities? For comparison purposes, you might want to look at the chart of Petrobras, PBR. GPOR is Green, having fun in an Up trend, and is now in the Free Willy Mode. PBR is in Jail, constrained by its moving averages, RED indicators, and fighting a downtrend. What’s more fun? Free Willy or Jail?
Remember, it’s mid-January, and March is right around the corner. I always want to look at energy going into March.
So reviewing my Big Picture Strategy, I’m positive and looking to buy stocks from my Lists that have patterns and are either starting an Up trend or are pulling back and resting from a recent move up. For stocks that appear to be completing a wave 2, I’m looking to buy them when the indicators turn positive, especially if they have tight Bands. On those stocks that are already in up trends, I’m looking to buy them if the 2-period RSI Wilder becomes oversold. We’re going higher.
Also, continue to pay attention to Emeritus and the Honor Roll. Remember how he signaled ‘RALLY’ on 2 January by placing a world record 38 new stocks on the Honor Roll? Then added RCL, GILD and CNI. He highlighted SLB on 8 January, then again on 16 January. And PEP on 10 January, just to name a few. Pay attention :>)
Continue to be patient with gold and silver. On Friday, the PT indicators turned positive on SLV after a nice 2-wave pullback since mid-September. The ETF is starting to ‘Jump the Ropes’again. Hmmm? Could Major Wave 3 Up be starting? We’ll see.
I’m also watching the Major Hockey Stick Pattern on physical gold shares, GLD. Gold is also playing with a ‘Rope Jump’on the Daily’s. The DMI and P-vol turned positive on Friday. Now all I need to see is a positive MACD and I’ll go looking for my pick and wheelbarrow.
That’s what I’m doing,
h
All of the commentary expressed in this site and any attachments are opinions of the author, subject to change, and provided for educational purposes only. Nothing in this commentary or any attachments should be considered as trading advice. Trading any financial instrument is RISKY and may result in loss of capital including loss of principal. Past performance is not indicative of future results. Always understand the RISK before you trade.
en_GBEnglish
en_GBEnglish