Jun 29, 2013 | Uncategorized
Original article by Marsha Stokes
AIQ Code by Richard Denning
For this month’s Stocks and Commodities issue, I did not do the selected article on the step candle pattern, but instead I provide code for an indicator discussed in the Bonus Issue 2013 article, “Balancing Your Indicators”, by Martha Stokes.
In the article, the author discusses several indicators but focuses on the price versus volume rate of change. She suggests that we use these two to find divergences in price versus volume changes. She does not give specific formulas or describe how the indicators should be constructed nor how the diverge could be mechanized. She only shows examples of the indicators and gives interpretations on one stock.
To code the indicators, I used linear regression (LR) of the price compared to linear regression of the volume. We need to get the rate of change of each in order to normalize so that we can compare and get the divergence. I get the LR rate of change of each indicator by using the end points of the LR line (end point divided by beginning point -1). I use the slope to be sure the sign is correct. In other words if the linear regression slope is positive, then the rate of change must be positive. If negative then it must be negative. Next I get the standard deviation (STD) of the difference (DIFF) between the LR percent rate of change of volume minus the LR percent rate of change of price. By then dividing the current DIFF by the STD, I get a measure of how much divergence is currently happening. When the divergence exceeds the input value, buy and sell signals can be generated.
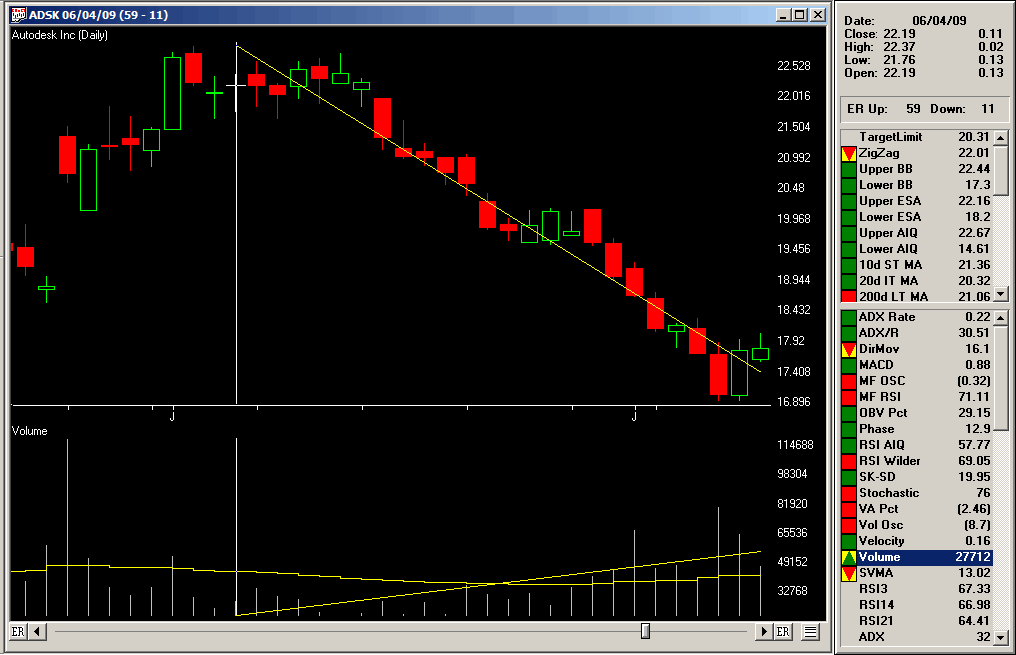
Chart of ADSK on date of positive divergence signal (7/9/09) with LR lines on price and volume.
The chart of ADSK with the linear regression lines drawn in on the price and the volume. We see that price has a negative rate of change and volume has a positive rate of change. The divergence indicator exceeded the 2 STD positive level on 7/9/09 for a buy signal. Holding for 10 trading days the trade generated a profit of 23.69%.
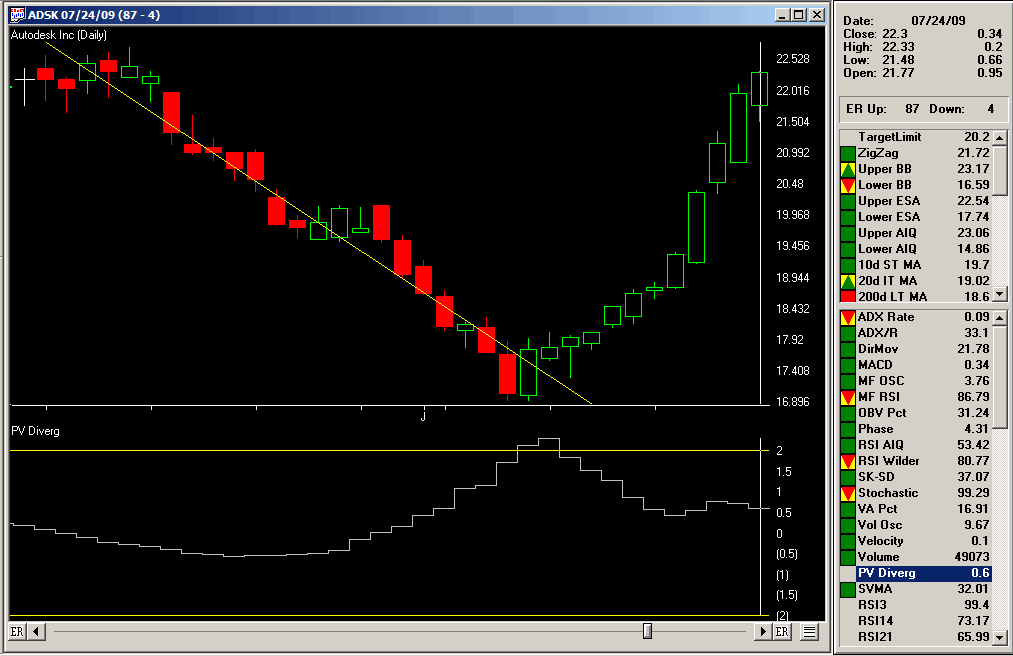
Chart of ADSK on date of trade exit (7/24/09) with divergence indicator and the 2 STD signal lines. When the indicator crossed above the upper signal line on 7/9/09, a buy signal is indicated. This trade was entered on 7/10/09 at the open and exited on 7/24/09 at the open.
In this chart I show the divergence indicator on ADSK with the date shifted to the exit date. I picked this trade because it was a clear example of how the indicator can work, however there were many other trades that did not work as well as this one. The code provided is not meant to be a complete trading system as it lacks exits rules and position sizing. More testing should be done to determine the appropriate inputs, etc.
The AIQ EDS code is below
!APPLYING QUANTITY AND TIME INDICATORS
!Substituted for the July 2013 Traders’ Tips Article
!Author: Martha Stokes, TASC Bonus Issue 2013
!Coded by: Richard Denning 5/12/13
!INPUTS:
ROCLEN is 24.
MYINDICATOR1 is [volume].
MYINDICATOR2 is [close].
STDLEN is 200.
DEVIATION_STD_MULT is 2.
!LINEAR REGRESSION RATE OF CHANGE INDICATOR1 (VOLUME):
!GET SLOPE AND INTERCEPT OF LINEAR REGRESSION LINE 1:
b is slope2(MYINDICATOR1,ROCLEN).
intercept is sum(MYINDICATOR1,ROCLEN)/
ROCLEN – (b * (ROCLEN + 1) / 2).
!END POINT OF LINEAR REGRESSION LINE 1:
LRV is intercept + (ROCLEN*b).
!BEGINNING POINT OF LINEAR REGRESSION LINE 1:
LRVrocLen is intercept + ((ROCLEN-ROCLEN)*b).
!LINEAR REGRESSION RATE OF CHANGE IN INDICATOR1:
rocLRind1 is iff(b>0,abs((LRV / LRVrocLen – 1)),
-abs((LRV / LRVrocLen – 1))) * 100.
!LINEAR REGRESSION RATE OF CHANGE INDICATOR2 (PRICE):
!GET SLOPE AND INTERCEPT OF LINEAR REGRESSION LINE 2:
b2 is slope2(MYINDICATOR2,ROCLEN).
intercept2 is sum(MYINDICATOR2,ROCLEN)/
ROCLEN – (b2 * (ROCLEN + 1) / 2).
!GET END POINT OF LINEAR REGRESSION LINE 2:
LRV2 is intercept2 + (ROCLEN*b2).
!GET BEGINNING POINT OF LINEAR REGRESSION LINE 2:
LRVrocLen2 is intercept2 + ((ROCLEN-ROCLEN)*b2).
!GET LINEAR REGRESSION RATE OF CHANGE IN INDICATOR2:
rocLRind2 is iff(b2>0,abs((LRV2 / LRVrocLen2 – 1)),
-abs((LRV2 / LRVrocLen2 – 1))) * 100.
!GET DIVERGENCE BETWEEN ROC OF INDICATOR1 VS INDICATOR2:
DIFF is rocLRind1 – rocLRind2.
stdDIFF is sqrt(variance(DIFF,STDLEN)).
numSTD is DIFF/stdDIFF. !PLOT
!START DATE FOR LINEAR REGRESSION LINE:
startDate is setdate(ROCLEN).
!REPORTS:
ShowValues if [volume] > 3000 and [close] > 5
and hasdatafor(max(ROCLEN,STDLEN)+10)>=max(ROCLEN,STDLEN).
PosDiverg if DIFF > 0
and numSTD >= DEVIATION_STD_MULT and ShowValues.
NegDiverg if DIFF < 0
and numSTD <= -DEVIATION_STD_MULT and ShowValues.
Jun 29, 2013 | Uncategorized
Original article by Marsha Stokes
AIQ Code by Richard Denning
For this month’s Stocks and Commodities issue, I did not do the selected article on the step candle pattern, but instead I provide code for an indicator discussed in the Bonus Issue 2013 article, “Balancing Your Indicators”, by Martha Stokes.
In the article, the author discusses several indicators but focuses on the price versus volume rate of change. She suggests that we use these two to find divergences in price versus volume changes. She does not give specific formulas or describe how the indicators should be constructed nor how the diverge could be mechanized. She only shows examples of the indicators and gives interpretations on one stock.
To code the indicators, I used linear regression (LR) of the price compared to linear regression of the volume. We need to get the rate of change of each in order to normalize so that we can compare and get the divergence. I get the LR rate of change of each indicator by using the end points of the LR line (end point divided by beginning point -1). I use the slope to be sure the sign is correct. In other words if the linear regression slope is positive, then the rate of change must be positive. If negative then it must be negative. Next I get the standard deviation (STD) of the difference (DIFF) between the LR percent rate of change of volume minus the LR percent rate of change of price. By then dividing the current DIFF by the STD, I get a measure of how much divergence is currently happening. When the divergence exceeds the input value, buy and sell signals can be generated.
Chart of ADSK on date of positive divergence signal (7/9/09) with LR lines on price and volume.
The chart of ADSK with the linear regression lines drawn in on the price and the volume. We see that price has a negative rate of change and volume has a positive rate of change. The divergence indicator exceeded the 2 STD positive level on 7/9/09 for a buy signal. Holding for 10 trading days the trade generated a profit of 23.69%.
Chart of ADSK on date of trade exit (7/24/09) with divergence indicator and the 2 STD signal lines. When the indicator crossed above the upper signal line on 7/9/09, a buy signal is indicated. This trade was entered on 7/10/09 at the open and exited on 7/24/09 at the open.
In this chart I show the divergence indicator on ADSK with the date shifted to the exit date. I picked this trade because it was a clear example of how the indicator can work, however there were many other trades that did not work as well as this one. The code provided is not meant to be a complete trading system as it lacks exits rules and position sizing. More testing should be done to determine the appropriate inputs, etc.
The AIQ EDS code is below
!APPLYING QUANTITY AND TIME INDICATORS
!Substituted for the July 2013 Traders’ Tips Article
!Author: Martha Stokes, TASC Bonus Issue 2013
!Coded by: Richard Denning 5/12/13
!INPUTS:
ROCLEN is 24.
MYINDICATOR1 is [volume].
MYINDICATOR2 is [close].
STDLEN is 200.
DEVIATION_STD_MULT is 2.
!LINEAR REGRESSION RATE OF CHANGE INDICATOR1 (VOLUME):
!GET SLOPE AND INTERCEPT OF LINEAR REGRESSION LINE 1:
b is slope2(MYINDICATOR1,ROCLEN).
intercept is sum(MYINDICATOR1,ROCLEN)/
ROCLEN – (b * (ROCLEN + 1) / 2).
!END POINT OF LINEAR REGRESSION LINE 1:
LRV is intercept + (ROCLEN*b).
!BEGINNING POINT OF LINEAR REGRESSION LINE 1:
LRVrocLen is intercept + ((ROCLEN-ROCLEN)*b).
!LINEAR REGRESSION RATE OF CHANGE IN INDICATOR1:
rocLRind1 is iff(b>0,abs((LRV / LRVrocLen – 1)),
-abs((LRV / LRVrocLen – 1))) * 100.
!LINEAR REGRESSION RATE OF CHANGE INDICATOR2 (PRICE):
!GET SLOPE AND INTERCEPT OF LINEAR REGRESSION LINE 2:
b2 is slope2(MYINDICATOR2,ROCLEN).
intercept2 is sum(MYINDICATOR2,ROCLEN)/
ROCLEN – (b2 * (ROCLEN + 1) / 2).
!GET END POINT OF LINEAR REGRESSION LINE 2:
LRV2 is intercept2 + (ROCLEN*b2).
!GET BEGINNING POINT OF LINEAR REGRESSION LINE 2:
LRVrocLen2 is intercept2 + ((ROCLEN-ROCLEN)*b2).
!GET LINEAR REGRESSION RATE OF CHANGE IN INDICATOR2:
rocLRind2 is iff(b2>0,abs((LRV2 / LRVrocLen2 – 1)),
-abs((LRV2 / LRVrocLen2 – 1))) * 100.
!GET DIVERGENCE BETWEEN ROC OF INDICATOR1 VS INDICATOR2:
DIFF is rocLRind1 – rocLRind2.
stdDIFF is sqrt(variance(DIFF,STDLEN)).
numSTD is DIFF/stdDIFF. !PLOT
!START DATE FOR LINEAR REGRESSION LINE:
startDate is setdate(ROCLEN).
!REPORTS:
ShowValues if [volume] > 3000 and [close] > 5
and hasdatafor(max(ROCLEN,STDLEN)+10)>=max(ROCLEN,STDLEN).
PosDiverg if DIFF > 0
and numSTD >= DEVIATION_STD_MULT and ShowValues.
NegDiverg if DIFF < 0
and numSTD <= -DEVIATION_STD_MULT and ShowValues.
May 23, 2013 | Uncategorized
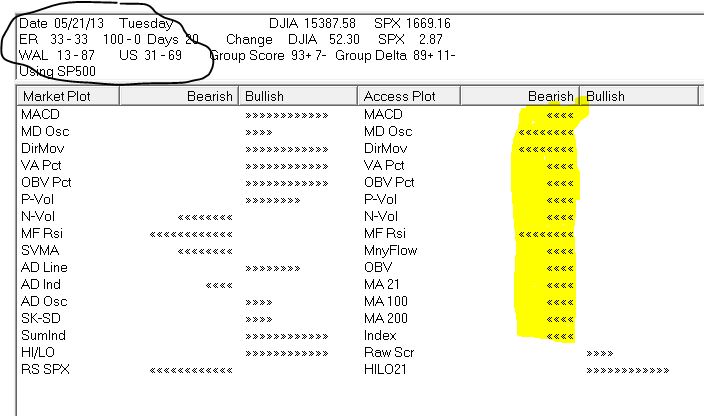
AIQ TradingExpert Pro’s Market Log provides traders with a daily snapshot of market conditions and how the market segments are performing. I’ll explain some of the elements here;
Days since the first Expert Rating to the up or down side – currently 20 days into an up rating of 100 – 0. The current rating is 33 – 33 and only ratings of 95 – 0 or 0 – 95 are significant.
Group Score is trending up vs trending down groups in S & P 500 – currently 93 % up.
WAL 13 – 87 and US 31 – 69 are a percentage measure of any stocks in the S & P 500 receiving expert ratings to the upside vs downside. Definitely more down than up ratings.
Market Plot measures the bullish and bearish readings of a basket of indicators for the Dow 30 Index.
Access Plot measures the bullish and bearish readings of a basket of indicators for each of the S & P 500 stocks. It’s the average reading for all 500 stocks for each indicator. This area I highlighted for it’s bearish technical look.
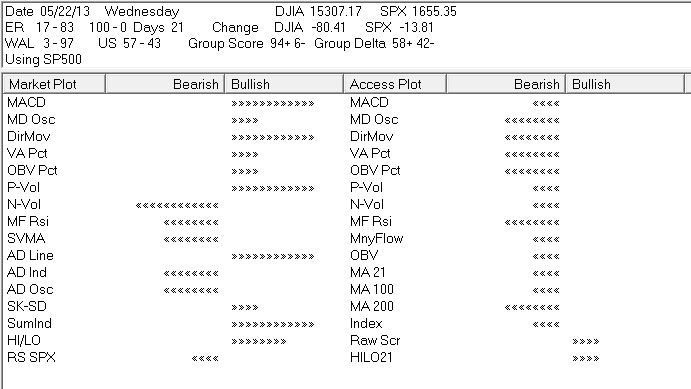
The Dow 30 Index is technically more bullish than the S & P 500 stocks. Next day Wednesday May 22nd, 2013 the Dow fell 80 some points, but the S & P 500 Index fell nearly 14 points. The market Log for 5/22/2013 shows the continued technical weakness in the stocks but less so in the Dow 30 Index.
May 23, 2013 | Uncategorized
AIQ TradingExpert Pro’s Market Log provides traders with a daily snapshot of market conditions and how the market segments are performing. I’ll explain some of the elements here;
Days since the first Expert Rating to the up or down side – currently 20 days into an up rating of 100 – 0. The current rating is 33 – 33 and only ratings of 95 – 0 or 0 – 95 are significant.
Group Score is trending up vs trending down groups in S & P 500 – currently 93 % up.
WAL 13 – 87 and US 31 – 69 are a percentage measure of any stocks in the S & P 500 receiving expert ratings to the upside vs downside. Definitely more down than up ratings.
Market Plot measures the bullish and bearish readings of a basket of indicators for the Dow 30 Index.
Access Plot measures the bullish and bearish readings of a basket of indicators for each of the S & P 500 stocks. It’s the average reading for all 500 stocks for each indicator. This area I highlighted for it’s bearish technical look.
The Dow 30 Index is technically more bullish than the S & P 500 stocks. Next day Wednesday May 22nd, 2013 the Dow fell 80 some points, but the S & P 500 Index fell nearly 14 points. The market Log for 5/22/2013 shows the continued technical weakness in the stocks but less so in the Dow 30 Index.
May 7, 2013 | Uncategorized
May 7, 2013 | Uncategorized
Apr 23, 2013 | Uncategorized
by Hank Swiencinski, AIQ TradingExpert Pro client for over 20 years, founder of ‘The Professor’s One Minute Guide to Stock Management’. DON’T MISS OUT, AIQ and The Professor are coming to New York…. LEARN MORE
“With the Dow up over 130 points, The Professor proves to be yet another valuable tool for short-term traders. Two days ago The Professor had 55 new longs, confirming the two VIX Buy Signals. Then last night, he maintained his positive bias with 21 new longs and only 3 shorts. So today, we’re up 130 points. Pretty cool, huh?”
“Anyhow I thought I would remind you that odds are that we’re still in a triangle, and the top should be near the 14,800+ level. We’re at 14, 706 as I write this. In other words, IF you took advantage of the DDM trade I mentioned yesterday, you might want to manage your money as we start to approach these higher levels. I’m starting to take profits NOW! Remember, no stock, no matter how good, goes to heaven. And this applies even more so when we’re in a triangle.”
“The 11:00am run of The Professor shows that the number of new longs has increased to 30. This tells me that we should see the Dow trading close to the 14, 800+ level before the next leg down starts to develop. In other words, I expect more upside in the next few days, but to get there, we should expect some very choppy trading. Because of this, I’m gonna take a few bucks off the table, and leave some on to see if we can approach 14,800 as this leg completes.”
“Managing my money,
TWID,
h “ |
| All of the commentary expressed in this site and any attachments are opinions of the author, subject to change, and provided for educational purposes only. Nothing in this commentary or any attachments should be considered as trading advice. Trading any financial instrument is RISKY and may result in loss of capital including loss of principal. Past performance is not indicative of future results. Always understand the RISK before you trade. |
Apr 20, 2013 | Uncategorized
The AIQ code for finding head & shoulders (H&S) patterns based on Giorgos Siligardos’ article in the May issue of Stocks & Commodities, “Head & Shoulders, Algorithmically (Part 2),” is provided at the following website: www.TradersEdgeSystems.com/traderstips.htm.
I did not directly translate the code given in Siligardos’ article into AIQ EDS code because the AIQ program has chart pattern recognition built in. The code I am providing will find H&S patterns — as well as many other patterns — for either completed or emerging patterns.
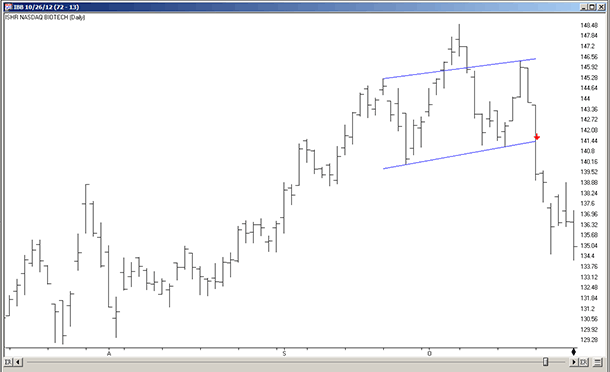
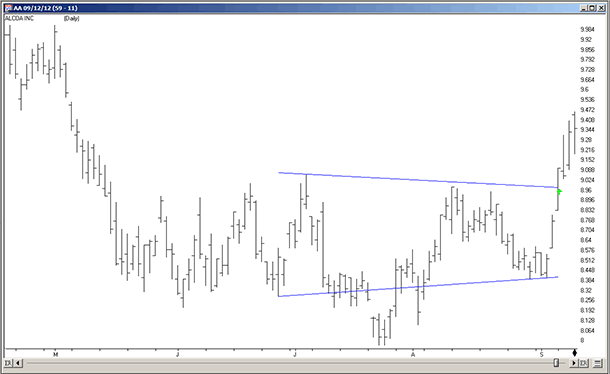
In Figure 5, I show an example of a completed H&S topping pattern with the sell signal (red down arrow). The bars after the signal indicate that this trade was immediately profitable. In Figure 2, I show an example of a completed inverse H&S bottoming pattern with a buy signal (red up arrow). The bars after the signal indicate that this trade was immediately profitable.
FIGURE 5: AIQ, H&S TOPPING PATTERN. Here’s an example of H&S topping pattern recognition with a sell signal (red down arrow) on iShares NASDAQ Biotechnology (IBB).
FIGURE 6: AIQ, H&S BOTTOMING PATTERN. Here’s an example of inverse H&S bottoming pattern recognition with a buy signal (red up arrow) on Alcoa (AA).
The code and EDS file can be downloaded from www.TradersEdgeSystems.com/traderstips.htm, and is shown below.
!DETECTING HEAD & SHOULDERS ALGORITHMICALLY
!Author: Giorgos E. Siligardos TASC May 2013
!Coded by: Richard Denning 3/17/2013
!USER DEFINED FUNCTIONS:
C is [close].
Name is description().
!COMPLETED HEAD & SHOULDERS PATTERN-TOPPING:
HS is [Head and Shoulders].
HS_breakoutup if HS > 0.
HS_breakoutdn if HS < 0.
!COMPLETED HEAD & SHOULDERS PATTERN-INVERTED:
iHS is [Inv Head and Shoulders].
iHS_breakoutup if iHS > 0.
iHS_breakoutdn if iHS < 0.
!EMERGING HEAD & SHOULDERS PATTERN-TOPPING:
e_HS is [eHead and Shoulders].
e_HSemerge if e_HS > 0 or e_HS < 0.
!EMERGING HEAD & SHOULDERS PATTERN-INVERTED:
e_iHS is [eInv Head and Shoulders].
e_iHSemerge if e_iHS > 0 or e_iHS < 0.
!REPORTS TO LIST ALL HEAD & SHOULDERS PATTERS:
ShowAll if C>0 and (HS <> 0 or iHS <> 0
or e_HS <> 0 or e_iHS <>0).
Apr 19, 2013 | Uncategorized
For the last few years, traders and investors in Jacksonville, Florida have had legendary trader and AIQ TradingEpert Pro client, Hank Swiencinski all to themselves. No longer.
The Professor, as he is known by his clients, will be joining Steve Hill in New York to present “The Professor’s One Minute Guide to Stock Management” in person in one action packed 4 hour seminar.
This remarkable course is usually taught in four sessions of 2 hours, and only recently been available outside the walls of the University of Northern Florida in Jacksonville, FL.
Apr 16, 2013 | Uncategorized
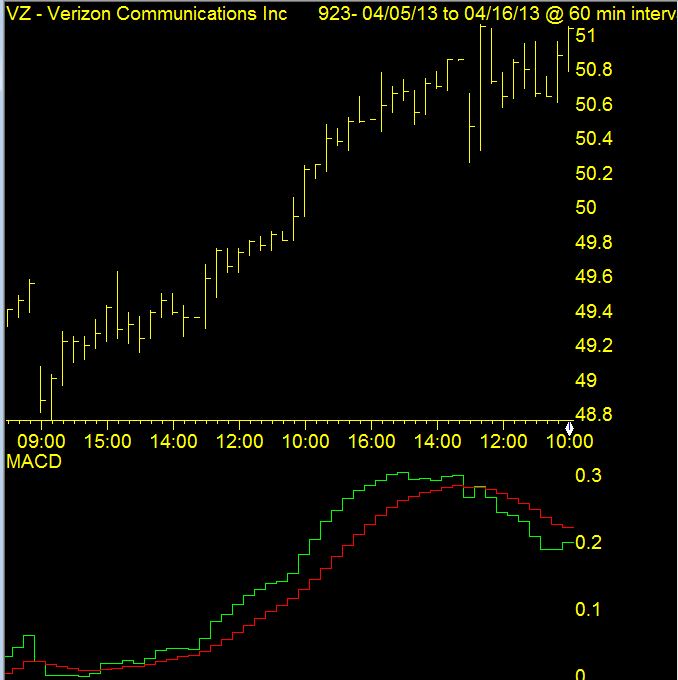
MACD divergence is a tried and tested technical tool. If you look at the daily price chart of Verizon below, you can clearly see the recent high on 4-12-2013. Note the MACD is well below the indicator peak back in the middle of March.
Looking at the hourly real-time chart of Verizon at the close on 4-15-2013, the same MCAD divergence characteristics are apparent.
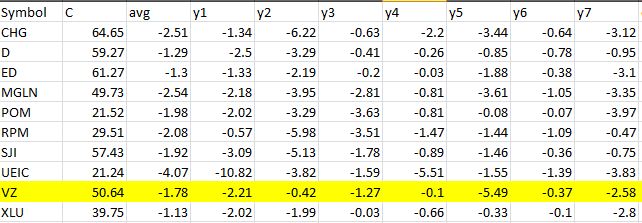
Another report that aligns nicely with this divergence is Seasonality – 5 day. Here’s a list of tickers that have exhibited down moves for this week in April for each of the last 7 years. Verizon is highlighted.


 English