Oct 8, 2013 | Uncategorized
Well according to reports that I have read, we are a little over a week away from Financial Armageddon, or at least that is what we are told will unfold if Congress does not raise the debt limit by October 17th. For if the debt limit is not raised by that time then the Fed will be unable to pay its bills (the 17 trillion dollars of debt that we have already raked up only means that up to now we have simply been “unwilling” to pay our bills – which apparently is different than “unable”), which means the U.S. Government may default and that the whole “Full Faith and Credit” thing will suddenly become worth approximately “a bucket of warm spit.” OK, that’s the Bad (granted, Very Bad) News. But there are two pieces of good news.
First, the financial markets are so far taking financial Armageddon pretty darn calmly. Sure the stock market is down a little bit of late, but overall it appears to be doing its best Alfred E. Nuemann (“What, Me Worry?”) impersonation. As a side note, I can’t quite figure out what the “Flight to Quality” crowd will do once the treasury defaults. I can’t help but think that half of them will buy treasury bonds anyway just as a reflex and because they don’t know what else to do (Old dogs, new tricks, if you get my drift).
The other piece of good news is that our elected politicians are “hard at work” attempting to solve this problem (Granted our elected officials appear to have a “slightly” different definition of “Hard at Work” than the rest of us shlubs). Whatever else you can say about them, our politicians are definitely busy engaging in politics these days. Nothing that will do any of us any good, granted, but hey, this whole “We the People” thing is getting just about as outdated as that whole “Full Faith and Credit” thing. So perhaps they are simply planning to wipe out both of these “antiquated” concepts in one fell swoop (at least that’s the only explanation that comes to mind).
When I think of our president and Congress I keep envisioning that image of those guys playing poker in the lounge of the Titanic. Sitting there at a 45 (and ever increasing) degree angle, they remain focused on what they considered to be the most important thing – “Hey, I think I can win this hand!”
Of course as we all know, all of this is completely and entirely the fault of [your least favorite political party here]. And no one can tell anyone otherwise.
What to Do, What to Do
Needless to say, everyone is pretty much assuming that something will happen at the 11th hour that will allow us to avoid “Shock and Awe, and Not in a Good Way” to our economy. Otherwise there might be just a tad more concern being reflected in the financial markets. Still it might be wise to think things through just a bit and to avoid “the conditioned response.”
Some of you may recall the utter “fear and loathing” that preceded the heavily anticipated “Fiscal Cliff” that we were going to plunge off of on January 1st of 2013. How did that work out? With a 20%+ gain in the stock market in the ensuing 8 months, of course. So there is a certain part of us that is now conditioned to believe that “potentially economically catastrophic events” lead to “above average returns”, which I am not entirely sure is the proper lesson. If nothing else, it’s a pretty small sample size.
So should investors simply take solace and assume that “things will work out?” Or is some sort of “defensive action” in order? At this point I think it is wise to invoke that age old bit of wisdom that states, “Hope for the Best, Prepare for the Worst.” At this point there are two basic theoretical scenarios:
1. A deal is reached to avoid a U.S. default and stocks bounce and bonds do not collapse.
2. The U.S. does default and stocks and U.S. treasury securities tank.
If you are a typical investor with a typical allocation of your portfolio to stocks then you don’t really need to “do” anything to take advantage of scenario #1. So that was easy.
Scenario #2 is “a little trickier”. There is a school of thought that states (probably accurately) that if the U.S. does default on its debt there will be far bigger problems than your stock portfolio. And that may be true. But in this worst case scenario it is not like the stock market will close down for good, the economy will (immediately) grind to a halt and we will all begin just “living off the land.” So “just in case”, it might make sense to “hedge.”
One Possibility
As I have written about recently, my new favorite hedging tool (for hedging specifically against an adverse move in the stock market) are call options on ticker VXX, the exchange-traded fund that ostensibly tracks futures contracts on the VIX Index.
The bottom line is simple to understand:
-When the stock market goes down, the VIX Index goes up.
-And the harder the stock market falls, the more quickly the VIX Index “spikes”.
So if you have concerns about a stock market decline then a cheap VXX call option can offer some pretty good upside potential. A trade that I highlighted recently involving VXX call options appears in Figures 1 and 2. (http://jayonthemarkets.com/2013/09/17/looking-to-vxx-just-in-case/)
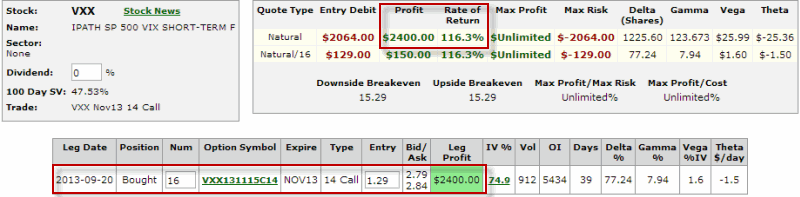
Figure 1 – VXX Nov 14 Call Option (courtesy www.OptionsAnalysis.com)
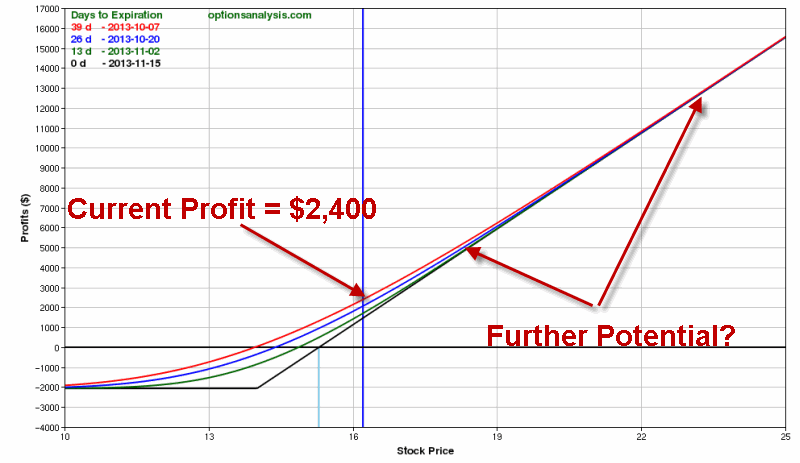
Figure 2 – VXX Nov 14 Call Option Risk Curves (courtesy www.OptionsAnalysis.com)
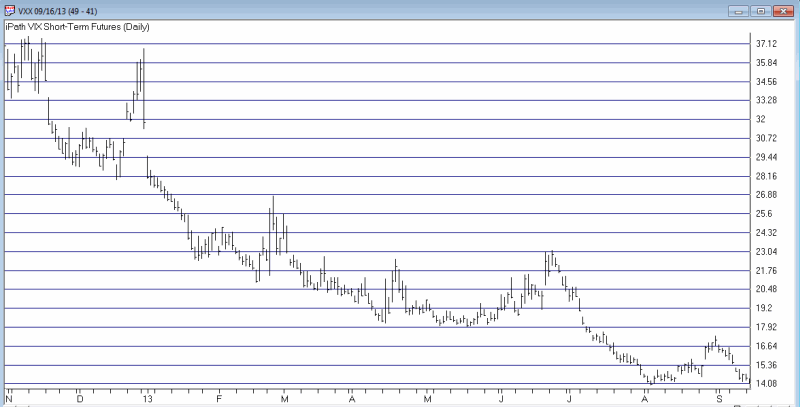
As you can see in Figure 3, VXX has rallied from 13.84 to 16.21, or +17%. In the same time the VXX call option shown in Figures 1 and 2 have advanced +116%. This clearly illustrates the potential benefit of leverage in the options market.
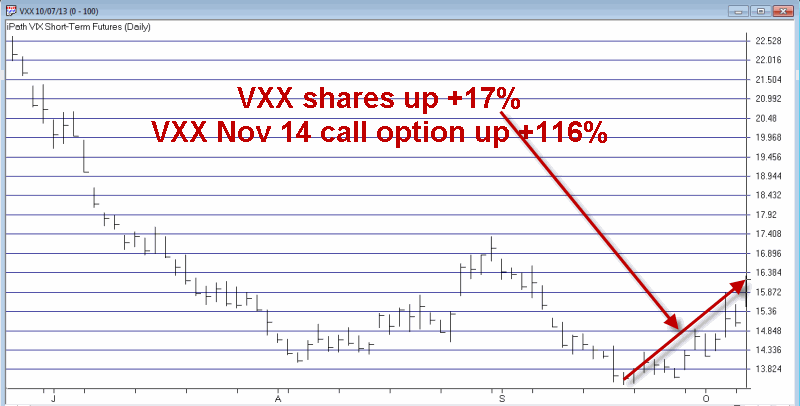
Figure 3 – Ticker VXX (exchange=traded fund) bounces recently (courtesy AIQ TradingExpert)
How high could VXX go if the U.S. somehow manages to default? Figure 4 displays the longer-term history of the VIX Index itself.
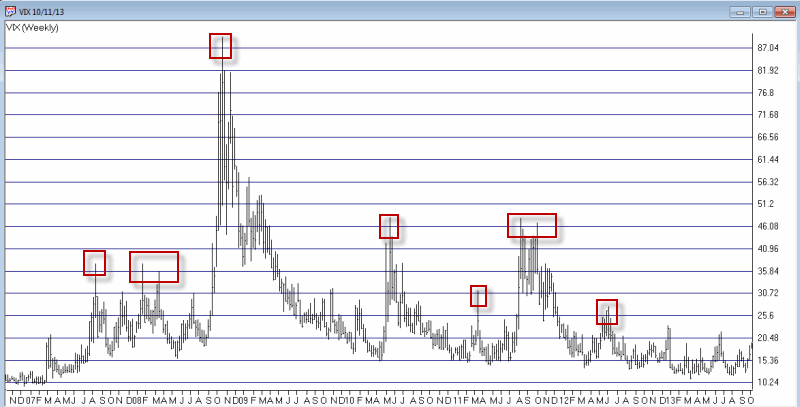
Figure 4 – The VIX Index; How High Can it Go? (courtesy AIQ TradingExpert)
Just to “go to extremes”, if we had another meltdown along the line of 2008 and if ticker VXX rallied to 80, the November 14 VXX call option would be worth $66 a contract, or a gain of about +5,000% from the initial price on 9/20 (about +2,265% from current levels).
The Irony
The ironic part is that as exciting as a potential gain of 2,000 to 5,000% sounds, we absolutely, positively hope that it doesn’t happen. In fact, in the overall best case scenario these VXX call options expire worthless as the stock market rallies and volatility subsides.
What we hope is that our esteemed elected officials will get their act together and come up with a solid long-term plan to put the U.S. back on solid financial footing.
Or at the very least, that they avoid making us Thelma to their Louise.
Jay Kaeppel
Chief Market Analyst at JayOnTheMarkets.com and AIQ TradingExpert Pro client
http://jayonthemarkets.com/
Jay has published four books on futures, option and stock trading. He was Head Trader for a CTA from 1995 through 2003. As a computer programmer, he co-developed trading software that was voted “Best Option Trading System” six consecutive years by readers of Technical Analysis of Stocks and Commodities magazine. A featured speaker and instructor at live and on-line trading seminars, he has authored over 30 articles in Technical Analysis of Stocks and Commodities magazine, Active Trader magazine, Futures & Options magazine and on-line at www.Investopedia.com.
Oct 2, 2013 | Uncategorized
The AIQ code for Sylvain Vervoort’s color study and system described in his article in the October issue of Stocks and Commodities, “An Expert Of A System,” is provided at www.TradersEdgeSystems.com/traderstips.htm.
Figure 1 is a chart of Netflix (NFLX) with a color bar study that shows when the expert system is in a buy mode (green bars). A buy mode occurs when the typical price exponential moving average (typEMA) is above the heinkin-ashi close exponential moving average (haEMA), and the close is above the open after having been in the sell mode. For the sell to be true (red bars), the typEMA must be below the haEMA and the close must be below the open for the initial signal to go short after having been in the buy mode.
FIGURE 1: AIQ, TYPEMA AND HAEMA. Here is a sample chart of NFLX with typEMA (yellow) and haEMA (green), with the color study showing buys (green bars with up white arrows) and sells (red bars with down white arrows).
Figure 1 also shows the two moving averages typEMA in yellow and the haEMA in green. White arrows show the signal dates for the sample trade on NFLX. The entries & exits are the next day at the open. I simplified the system and did not code the stop-loss or the breakeven exits. I ran a test on the NASDAQ 100 from August 11, 2000 to August 9, 2013.
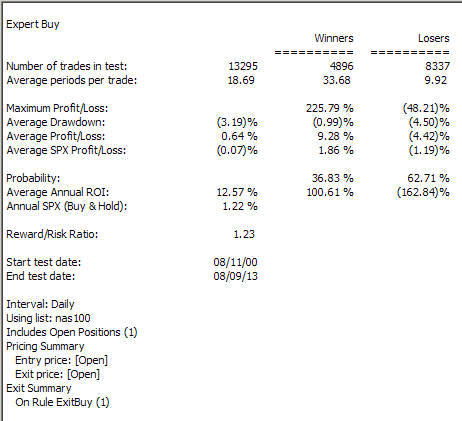
The long-side test results are summarized in Figure 2. The average return for all 13,295 trades is 0.64% per trade before commissions & slippage. This return assumes that all trades are taken. I tested the short side over this same period, and there were 13,256 trades averaging a loss of 1.00% per trade (summary not shown).
FIGURE 8: AIQ, BACKTEST RESULTS. Here is a summary of the backtest results of the long side on the NASDAQ 100 list of stocks from August 11, 2000 to August 9, 2013.
The code and EDS file can be downloaded from www.TradersEdgeSystems.com/traderstips.htm, and is shown below.
! AN EXPERT OF A SYSTEM
! Author: Sylvain Vervoort, TASC, October 2013
! Coded by: Richard Denning
! www.TradersEdgeSystems.com
! INPUTS:
H is [high].
L is [low].
C is [close].
O is [open].
OSD is offsettodate(month(),day(),year()).
typLen is 5.
haLen is 8.
!----------------HEIKIN-ASHI-----------------
haC is (O + H +L + C) / 4.
DaysInto is ReportDate() - RuleDate().
end if DaysInto >  30.
endHAO is iff(end,O, haO).
haO is (valresult(endHAO,1)
+valresult(haC,1))/2.
haH is Max(H,max(haO,haC)).
haL is Min(L,min(haO,haC)).
haCL is (haC + haO + haH + haL) / 4.
haEMA is expavg(haCL,haLen).  !PLOT
!---------------end HEIKIN-ASHI---------------
!---------------TYPICAL PRICE ----------------
TYP is (H+L+C)/3.
typEMA is expavg(TYP,typLen). !PLOT
!-----------------end TYPICAL-----------------
!--------------COLOR STUDY--------------------
G if (typEMA >  haEMA and C >  O).
Gos is scanany(G,200) then OSD.
R if typEMA <  haEMA and C <  O.
Ros is scanany(R,200) then OSD.
GREEN if G or ^Gos <  ^Ros.
RED if  R or ^Ros <  ^Gos.
!-------------end COLOR STUDY-----------------
!-------------TRADING SYSTEM------------------
Buy if G.
ExitBuy if R.
Sell if R.
ExitSell if G.
!-------------end TRADING SYSTEM--------------
Oct 2, 2013 | Uncategorized
The AIQ code for Sylvain Vervoort’s color study and system described in his article in the October issue of Stocks and Commodities, “An Expert Of A System,” is provided at www.TradersEdgeSystems.com/traderstips.htm.
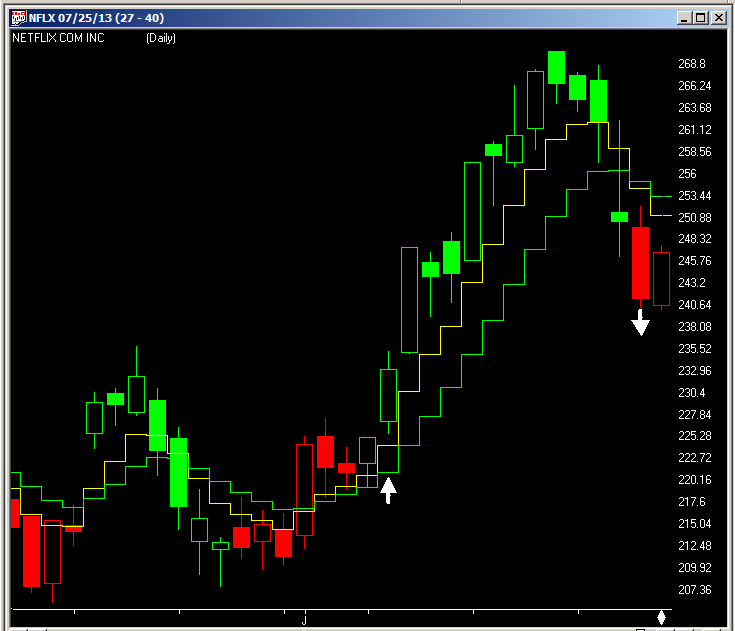
Figure 1 is a chart of Netflix (NFLX) with a color bar study that shows when the expert system is in a buy mode (green bars). A buy mode occurs when the typical price exponential moving average (typEMA) is above the heinkin-ashi close exponential moving average (haEMA), and the close is above the open after having been in the sell mode. For the sell to be true (red bars), the typEMA must be below the haEMA and the close must be below the open for the initial signal to go short after having been in the buy mode.
FIGURE 1: AIQ, TYPEMA AND HAEMA. Here is a sample chart of NFLX with typEMA (yellow) and haEMA (green), with the color study showing buys (green bars with up white arrows) and sells (red bars with down white arrows).
Figure 1 also shows the two moving averages typEMA in yellow and the haEMA in green. White arrows show the signal dates for the sample trade on NFLX. The entries & exits are the next day at the open. I simplified the system and did not code the stop-loss or the breakeven exits. I ran a test on the NASDAQ 100 from August 11, 2000 to August 9, 2013.
The long-side test results are summarized in Figure 2. The average return for all 13,295 trades is 0.64% per trade before commissions & slippage. This return assumes that all trades are taken. I tested the short side over this same period, and there were 13,256 trades averaging a loss of 1.00% per trade (summary not shown).
FIGURE 8: AIQ, BACKTEST RESULTS. Here is a summary of the backtest results of the long side on the NASDAQ 100 list of stocks from August 11, 2000 to August 9, 2013.
The code and EDS file can be downloaded from www.TradersEdgeSystems.com/traderstips.htm, and is shown below.
! AN EXPERT OF A SYSTEM
! Author: Sylvain Vervoort, TASC, October 2013
! Coded by: Richard Denning
! www.TradersEdgeSystems.com
! INPUTS:
H is [high].
L is [low].
C is [close].
O is [open].
OSD is offsettodate(month(),day(),year()).
typLen is 5.
haLen is 8.
!----------------HEIKIN-ASHI-----------------
haC is (O + H +L + C) / 4.
DaysInto is ReportDate() - RuleDate().
end if DaysInto >  30.
endHAO is iff(end,O, haO).
haO is (valresult(endHAO,1)
+valresult(haC,1))/2.
haH is Max(H,max(haO,haC)).
haL is Min(L,min(haO,haC)).
haCL is (haC + haO + haH + haL) / 4.
haEMA is expavg(haCL,haLen).  !PLOT
!---------------end HEIKIN-ASHI---------------
!---------------TYPICAL PRICE ----------------
TYP is (H+L+C)/3.
typEMA is expavg(TYP,typLen). !PLOT
!-----------------end TYPICAL-----------------
!--------------COLOR STUDY--------------------
G if (typEMA >  haEMA and C >  O).
Gos is scanany(G,200) then OSD.
R if typEMA <  haEMA and C <  O.
Ros is scanany(R,200) then OSD.
GREEN if G or ^Gos <  ^Ros.
RED if  R or ^Ros <  ^Gos.
!-------------end COLOR STUDY-----------------
!-------------TRADING SYSTEM------------------
Buy if G.
ExitBuy if R.
Sell if R.
ExitSell if G.
!-------------end TRADING SYSTEM--------------
Sep 23, 2013 | Uncategorized
The AIQ code based on Sylvain Vervoort’s article in the September issue of Stocks & Commodities, “Oscillators, Smoothed,” is provided at www.TradersEdgeSystems.com/traderstips.htm and is also shown below.
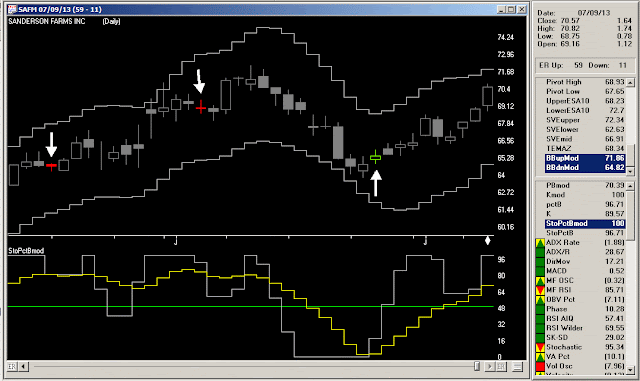
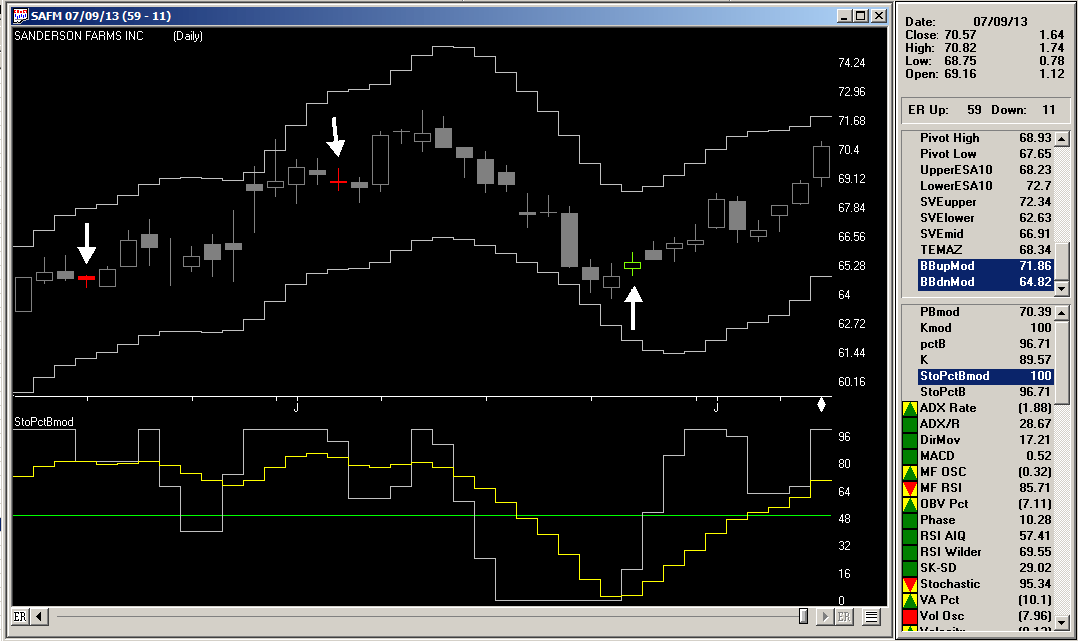
In the chart of Sanderson Farms (SANF) with a color bar study that shows potential buys (green bars) when both oscillators are moving up and they are both oversold (below 20). It sells (red bars) when both oscillators are moving down and they are both overbought (above 80). The bands shown are based on the modified Bollinger Bands that are used in the calculation of the modified Percent b oscillator. For comparison purposes, I have also provided the formula for John Bollinger’s original Percent b indicator as well as for the original smoothed %K indicator.
!OSCILLATORS, SMOOTHED
!Author: Sylvain Vervoort, TASC Sept 2013
!Coded by: Richard Denning 7/6/13
!www.TradersEdgeSystems.com
!INPUTS:
C is [close].
H is [high].
L is [low].
smaLen is 2.
smoLen is 3.
sdLen is 18.
kLen is 3.
!CODE FOR MODIFIED PERCENT B INDICATOR:
SMA1 is simpleavg(C,smaLen).
SMA2 is simpleavg(SMA1,smaLen).
SMA3 is simpleavg(SMA2,smaLen).
SMA4 is simpleavg(SMA3,smaLen).
SMA5 is simpleavg(SMA4,smaLen).
SMA6 is simpleavg(SMA5,smaLen).
SMA7 is simpleavg(SMA6,smaLen).
SMA8 is simpleavg(SMA7,smaLen).
SMA9 is simpleavg(SMA8,smaLen).
SMA10 is simpleavg(SMA9,smaLen).
rainbow is (5*SMA1 + 4*SMA2 + 3*SMA3 + 2*SMA4
+ SMA5 + SMA6 + SMA7 + SMA8 + SMA9
+SMA10) / 20.
EMA1 is expavg(rainbow,smoLen).
EMA2 is expavg(EMA1,smoLen).
diff is EMA1 – EMA2.
ZLRB is EMA1 + diff.
EMAZ1 is expavg(ZLRB,smoLen).
EMAZ2 is expavg(EMAZ1,smoLen).
EMAZ3 is expavg(EMAZ2,smoLen).
TEMAZ is 3*EMAZ1 – 3*EMAZ2 + EMAZ3.
SDTEMAZ is sqrt(variance(TEMAZ,sdLen)).
TEMAZ18 is valresult(TEMAZ,18).
TEMAZ17 is valresult(TEMAZ,17).
TEMAZ16 is valresult(TEMAZ,16).
TEMAZ15 is valresult(TEMAZ,15).
TEMAZ14 is valresult(TEMAZ,14).
TEMAZ13 is valresult(TEMAZ,13).
TEMAZ12 is valresult(TEMAZ,12).
TEMAZ11 is valresult(TEMAZ,11).
TEMAZ10 is valresult(TEMAZ,10).
TEMAZ9 is valresult(TEMAZ,9).
TEMAZ8 is valresult(TEMAZ,8).
TEMAZ7 is valresult(TEMAZ,7).
TEMAZ6 is valresult(TEMAZ,6).
TEMAZ5 is valresult(TEMAZ,5).
TEMAZ4 is valresult(TEMAZ,4).
TEMAZ3 is valresult(TEMAZ,3).
TEMAZ2 is valresult(TEMAZ,2).
TEMAZ1 is valresult(TEMAZ,1).
WMA18TEMAZ is (18*TEMAZ + 17*TEMAZ1 + 16*TEMAZ2
+ 15*TEMAZ3 + 14*TEMAZ4 + 13*TEMAZ5
+ 12*TEMAZ6 + 11*TEMAZ7 + 10*TEMAZ8
+ 9*TEMAZ9 + 8*TEMAZ10 + 7*TEMAZ11
+ 6*TEMAZ12 + 5*TEMAZ13 + 4*TEMAZ14
+ 3*TEMAZ15 + 2*TEMAZ16 + 1*TEMAZ17 ) /
(18+17+16+15+14+13+12+11+10+9+8+7+6+5+4+3+2+1).
!Plot the following as single line indicator with 50 line:
PBmod is (TEMAZ + 2*SDTEMAZ – WMA18TEMAZ) / (4*SDTEMAZ)*100.
!CODE FOR MODIFIED BOLLIGER BANDS:
BBupMod is TEMAZ + 2*SDTEMAZ. !Plot on chart area
BBdnMod is TEMAZ – 2*SDTEMAZ. !Plot on chart area
!CODE FOR STANDARD PERCENT B:
sdC is sqrt(variance(C,sdLen)).
!For comparison the following is the percent B:
pctB is (C+2*sdC-simpleavg(C,sdLen))/(4*sdC)*100.
!CODE FOR MODIFIED SLOW STOCHASTIC:
typ is (H+L+C)/3.
RBC is (rainbow + typ) / 2.
nom is RBC – lowresult(RBC,kLen).
den is highresult(RBC,kLen) – lowresult(RBC,kLen).
fastKmod is min(100,max(0,100*nom / den)).
Kmod is simpleavg(fastKmod,smoLen).
!CODE FOR STANDARD SLOW STOCHASTIC:
n is (C – lowresult(L,kLen)).
d is (highresult(H,kLen)-lowresult(L,kLen)).
fastK is min(100,max(0,100*n / d)).
slowK is simpleavg(fastK,smoLen).
!COLOR STUDY FOR MODIFIED OSCILLATORS
Green if PBmod > valresult(PBmod,1)
and Kmod > valresult(Kmod,1)
and PBmod < 20 and Kmod < 20.
Red if PBmod < valresult(PBmod,1)
and Kmod < valresult(Kmod,1)
and PBmod > 80 and Kmod > 80.
—Richard Denning
info@TradersEdgeSystems.com
for AIQ Systems
Sep 17, 2013 | Uncategorized
In Figure 1 below you will see a chart of ticker VXX, an ETF that tracks the VIX Index.
Figure 1 – Ticker VXX (Chart courtesy of AIQ TradingExpert)
Given:
- The fact that September and October have historically been the scene of a lot of stock market wreckage.
- That the Fed is due to say “something” about tapering soon
- The fact that VXX is at about its lowest level in years
- And the fact that VXX “spikes” to higher ground when the stock market stumbles.
Does it seem at all possible that VXX might be about ready for its next “spike”? Now understand that that is not a prediction but merely an observation that the possibility seems “ripe”. So it might be time to consider what I sometimes refer to as a “throwaway” trade.
My definition of a “throwaway” trade is one whereby based on the “possibility” of “something” in particular occurring, one enters into a very low cost trade that has the prospect of paying off in a big way based. But do not confuse this with a “lottery ticker” mentality, because the trade is based on some realistic expectation that the “something” might actually occur. Is it really that hard to picture a VIX spike sometime in the September/October timeframe?
So here is one example possibility (though not necessarily a recommendation) using an option on VXX. This trade was found using software at www.OptionsAnalysis.com. It involves simply buying 1 November VXX 14 strike price call option for $161. The particulars appear in Figures 2 and 3.
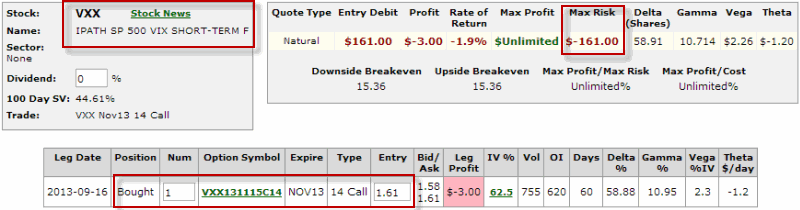
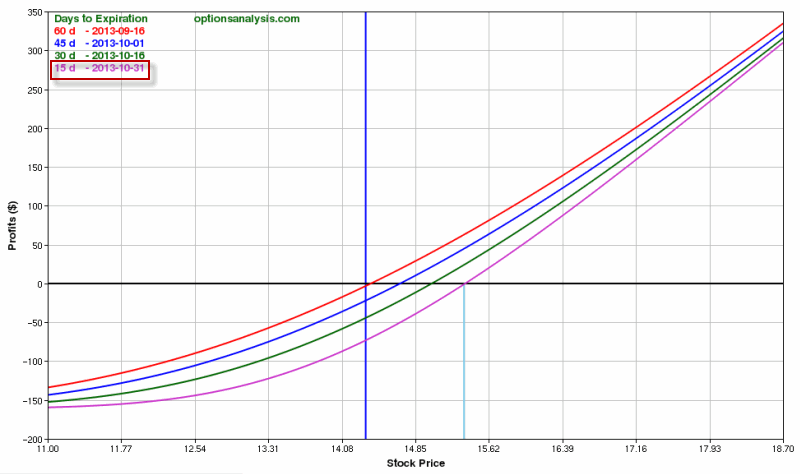
If VXX were merely to return to its August 30th high of 17.34, this trade would essentially double in value. If “something” really crazy happens and VXX soars to sharply higher levels the profit could be quite a bit more.
Again, I am not saying that VXX is sure to soar between now and the end of November. I’m only saying that I might be willing to risk $161 just in case.
Jay Kaeppel
Chief Market Analyst at JayOnTheMarkets.com and AIQ TradingExpert Pro client
http://jayonthemarkets.com/
Jay has published four books on futures, option and stock trading. He was Head Trader for a CTA from 1995 through 2003. As a computer programmer, he co-developed trading software that was voted “Best Option Trading System” six consecutive years by readers of Technical Analysis of Stocks and Commodities magazine. A featured speaker and instructor at live and on-line trading seminars, he has authored over 30 articles in Technical Analysis of Stocks and Commodities magazine, Active Trader magazine, Futures & Options magazine and on-line at www.Investopedia.com.
Aug 16, 2013 | Uncategorized
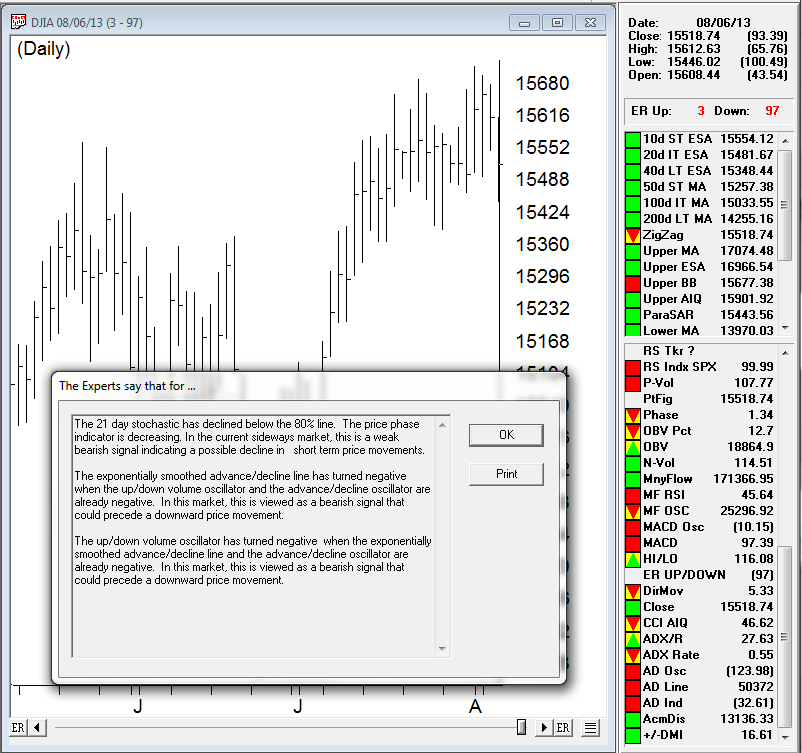
Here’s August 6th chart of the DJIA with the AIQ Experts say…
we had a 3-97 to the downside. The internal technical metrics feeding this rating were as follows
The 21 day stochastic has declined below the 80% line. The price phase indicator is decreasing. In the current sideways market, this is a weak bearish signal indicating a possible decline in short term price movements.
The exponentially smoothed advance/decline line has turned negative when the up/down volume oscillator and the advance/decline oscillator are already negative. In this market, this is viewed as a bearish signal that could precede a downward price movement.
The up/down volume oscillator has turned negative when the exponentially smoothed advance/decline line and the advance/decline oscillator are already negative. In this market, this is viewed as a bearish signal that could precede a downward price movement.
This rating was confirmed by Price Phase indicator moving down the same day. Phase confirmation eliminates rogue ratings as Price Phase is not a part of the AI rating. Sine August 6th the market has corrected more than 400 points, and up ratings were generated, however the Price Phase has continued declining and has not confirmed these ratings.
Jul 17, 2013 | Uncategorized
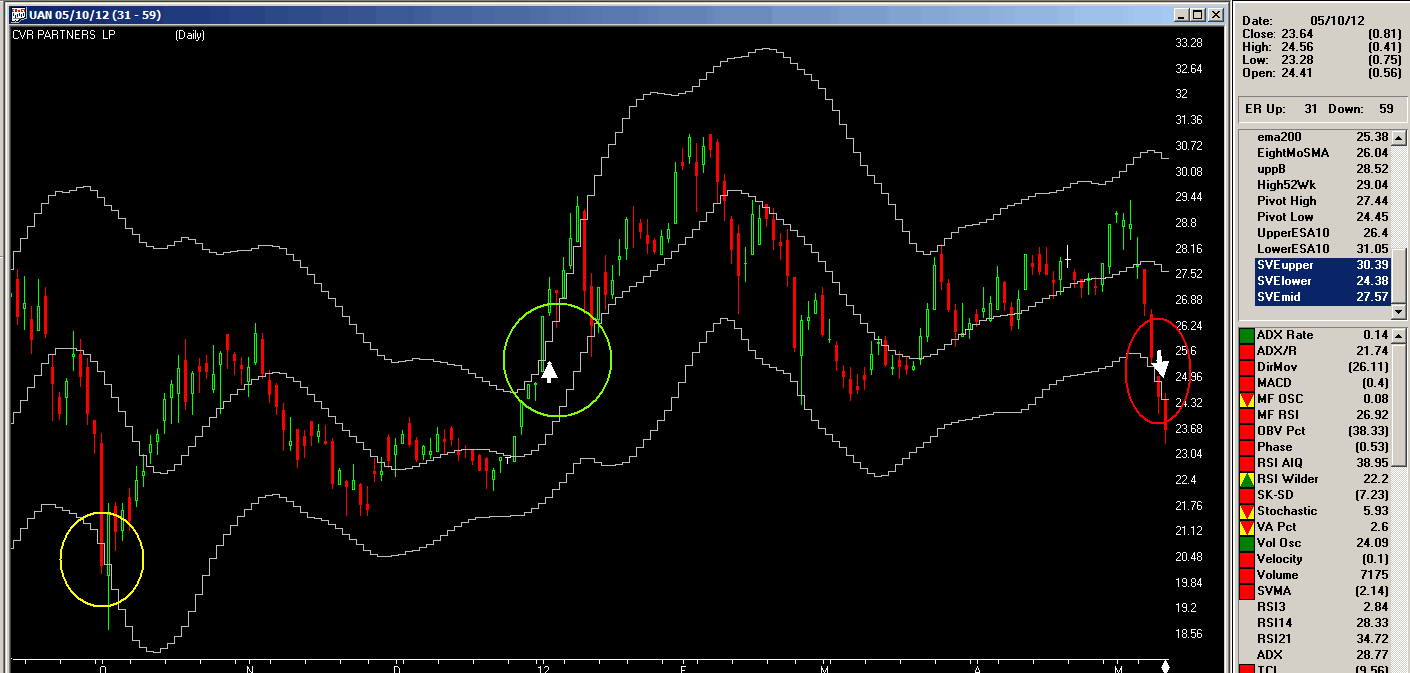
In Figure 1, I show a chart of CVR Partners LP (UAN) with the setup (yellow circle), the buy signal (green circle) and the exit (red circle). The author indicates that a valid buy signal does not occur unless the closing price has penetrated the lower band and then it closes above the upper band.
On 10/3/11, the close of 20.25 is below the lower band of 20.81 and then we have to wait until 1/3/12 for the close of 26.48 to be above the upper band of 25.36. We would enter the next day at the opening price of 26.57.
We would stay in the trade until the closing price is below the lower band. The exit does not occur for several months on 5/9/12 when the close of 24.45 is below the lower band of 27.76. We would then exit the next day at the open of 24.41 for a loss of $2.07 plus commission and slippage.
The highest close of the trade occurred on 2/2/12, just a few weeks after the entry, for a high open profit of $4.35. The trade would have been profitable if we had used the middle band as the exit. Note that I did not code the suggested trading system as the author indicates that more is to come in future parts of the article series.
Figure 1 – chart of UAN with SVE Volatility Bands and setup (yellow), entry (green) and exit (red) signals for the period 10/3/11 to 5/10/12.
Jul 12, 2013 | Uncategorized
by Hank Swiencinski, AIQ TradingExpert Pro client for over 20 years, founder of ‘The Professor’s One Minute Guide to Stock Management’
Join Hank at a special one hour webinar entitled ‘The Professor’s Rifle Trade’, August 22, 2013. hank will reveal his most powerful position trading technique. Limited audience and early bird pricing. LEARN MORE
The Dow fell 8 points, closing at 15,291. Volume on the NYSE was extremely light on the decline, coming in at only 71 percent of its 10 day average. There were 194 new highs and 36 new lows.
The markets spent most of the day waiting to see what the Fed minutes said about their plans for stimulating the economy. When the minutes came out at 2pm, there was a small rally, but it died quickly leaving the Dow flat into the cloise. However after the close, Bernanke, speaking at a conference sponsored by the National Bureau of Economic Research, stated that the U.S. economy continues to need an accommodative monetary policy. This caused US futures to shoot higher in after market trading, with the Dow futures gaining over 140 points..
There was another small change in the A-D oscillator yesterday, so you could say that the oscillator was predicting the Bernanke move. The Big Move should be enough to push the Dow above the point where the odds favor the scenario that wave ‘c’ up has started. But over the past few months, we have seen several times where a ‘talked up’ markets has come back down to earth, so today’s trading should be very interesting to watch.
Bernanke’s statement also caused several of the world markets to rally overnight, including China’s Hang Seng which gained over 2 percent. So it appears that FXP will make that second low in the Blade that I talked about yesterday. Same for EEV as the Bovespa is currently trading up almost one percent. BTW, the 60s remained negative yesterday on both FXP and EEV, so my Rifle Trade on the ETFs was never triggered.
I spent a few hours last night looking at the volume data on several of the indexes, and what I saw was not pretty picture. The P-Volume, Volume Accumulation Percent and On Balance Volume on the Dow (DIA) remain very negative, despite the past week’s advance. And while two of the three same indicators on the Nasdaq (QQQ) are positive, they are showing significant divergences with price. This problem with volume could all change if the overnight spike rally continues to be supported in the next few days. But right now, it’s very hard for me to believe that the rally will stick on such negative and diverging volume.
Also, the pattern is somewhat troubling to me as well if wave ‘c’ up is starting. Up until last night, the pattern on the Dow looked more like an a-b-c move coming off the 24 June low of 14, 551. But after last night’s spike rally, the c wave of that a-b-c move will start to look impulsive, meaning that it’s starting to appear more like a wave 3 up than a wave c. This too would strongly argue that wave 1 up of wave ’c’ is underway.
The Dow high of 15,542 made on 22 May should provide significant resistance to any rally built on Bernanke’s words. So even if we do pop, I would expect the markets to pull back to form a better pattern before they have enough strength to support a further advance. If the volume starts to improve, and the market pulls back, that’s where I’ll look to go long. Not now.
Remember, wave ‘c’ up should be the final wave in the three wave sequence for Major Wave E up that started back in November 2012. And once this wave completes, there will not be any more up major waves in the Ending Diagonal Pattern for a long time. So please, pay attention to the Dean’s List during the next few months. As long as the Dean remains positive, odds are that the markets will continue to push higher as final wave ‘c’ of Major Wave E starts to unfold.
If this starts to happen, I will be trading this final wave up the same way that I traded the ‘a’ wave that occurred from January into late May with Rifle Trades. As we prepare for this, you might want to take a look at a stock like GILD on the Daily’s. I’m not saying that GILD is the stock I will be looking to trade. It’s only an example of what you should be looking for. Note how GILD has been in a steady Uptrend since April 2012. Notice too how the PT indicators remained positive for most of that time. Then after you have done this, remove all of the PT indicators so your chart just contains the price and a 2-period RSI Wilder. What I want you to see is how many opportunities you had to go ‘hunting’ on GILD. And how many of those trades resulted in profits of 5-6 points.
So don’t worry about today’s spike rally. If it’s part of wave 1 up of ‘c’ up there will be plenty of opportunities to go hunting…at a much lower risk. Right now, all I’m doing is polishing my Rifle.
That’s what I’m doing,
h
Jul 2, 2013 | Uncategorized
One of my favorite chart tools is Fibonacci Retracements. I find it really useful on retracements both from a high and from a low point.
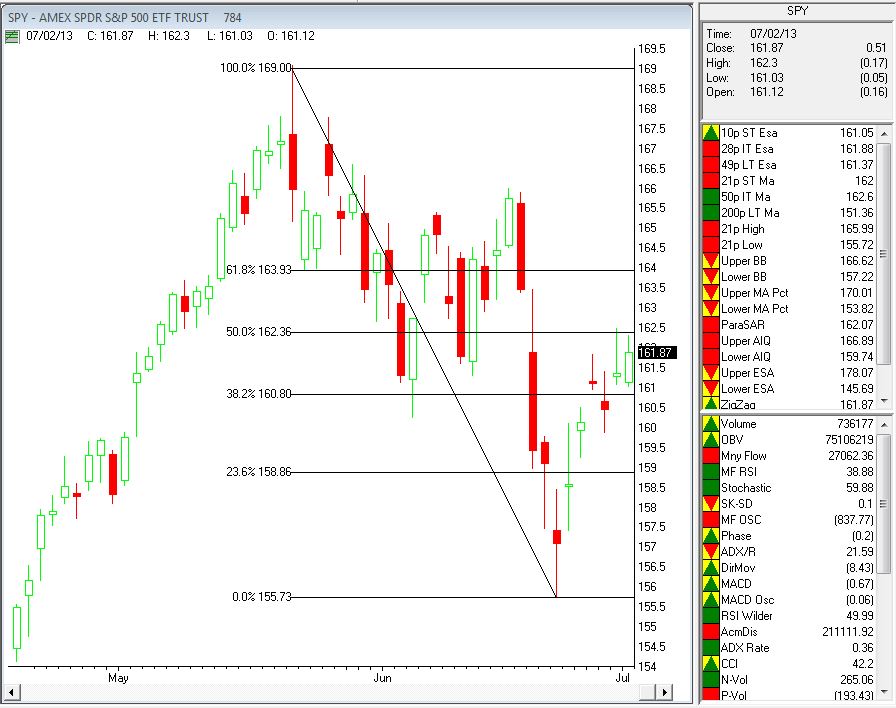
Here’s what I mean on the SPY July 2, 2013 chart below.
I’ve run the retracement from the high of May 20, 2013 to the recent low on June 24, 2013. The levels generated provide possible resistance levels to the rally from the low. I find the 50% and 61.8% levels most useful. In this example the market is struggling to break through the 50% retracement of this down move at around $162.5. If it does break out, the next level of resistance is at 61.8% or when SPY is around $164. if the rally fails at the 50% retracement then I consider the retracement pattern completed.
Incidentally, I drew this retracement 2 days after the low on June 24, 2013.
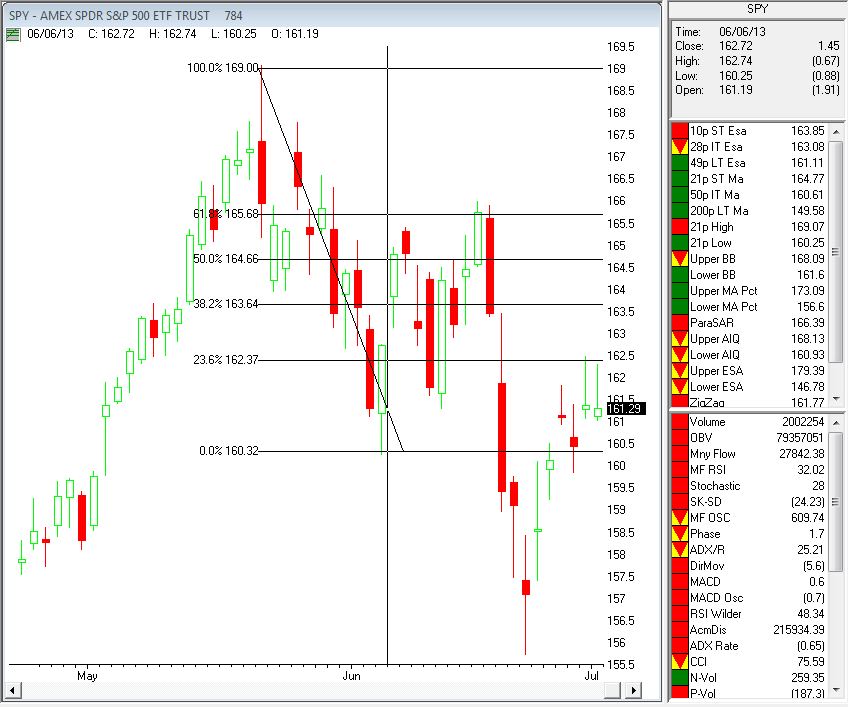
This was not the first Fibonacci Retracement I’ve drawn since the high of May 20, 2013. On June 6, 2013 when prices reached a low of $160.25 and rallied up from there. I drew the Fibonacci Retracements from the high of May 20, 2013 to the low of June 6, 2013. In this instance, as you can see in the chart below, the SPY struggled with the 61.8% retracement, before falling away. Again once the prices fall away from the retracement level, I consider that pattern over.
Jul 2, 2013 | Uncategorized
One of my favorite chart tools is Fibonacci Retracements. I find it really useful on retracements both from a high and from a low point.
Here’s what I mean on the SPY July 2, 2013 chart below.
I’ve run the retracement from the high of May 20, 2013 to the recent low on June 24, 2013. The levels generated provide possible resistance levels to the rally from the low. I find the 50% and 61.8% levels most useful. In this example the market is struggling to break through the 50% retracement of this down move at around $162.5. If it does break out, the next level of resistance is at 61.8% or when SPY is around $164. if the rally fails at the 50% retracement then I consider the retracement pattern completed.
Incidentally, I drew this retracement 2 days after the low on June 24, 2013.
This was not the first Fibonacci Retracement I’ve drawn since the high of May 20, 2013. On June 6, 2013 when prices reached a low of $160.25 and rallied up from there. I drew the Fibonacci Retracements from the high of May 20, 2013 to the low of June 6, 2013. In this instance, as you can see in the chart below, the SPY struggled with the 61.8% retracement, before falling away. Again once the prices fall away from the retracement level, I consider that pattern over.

 English