|
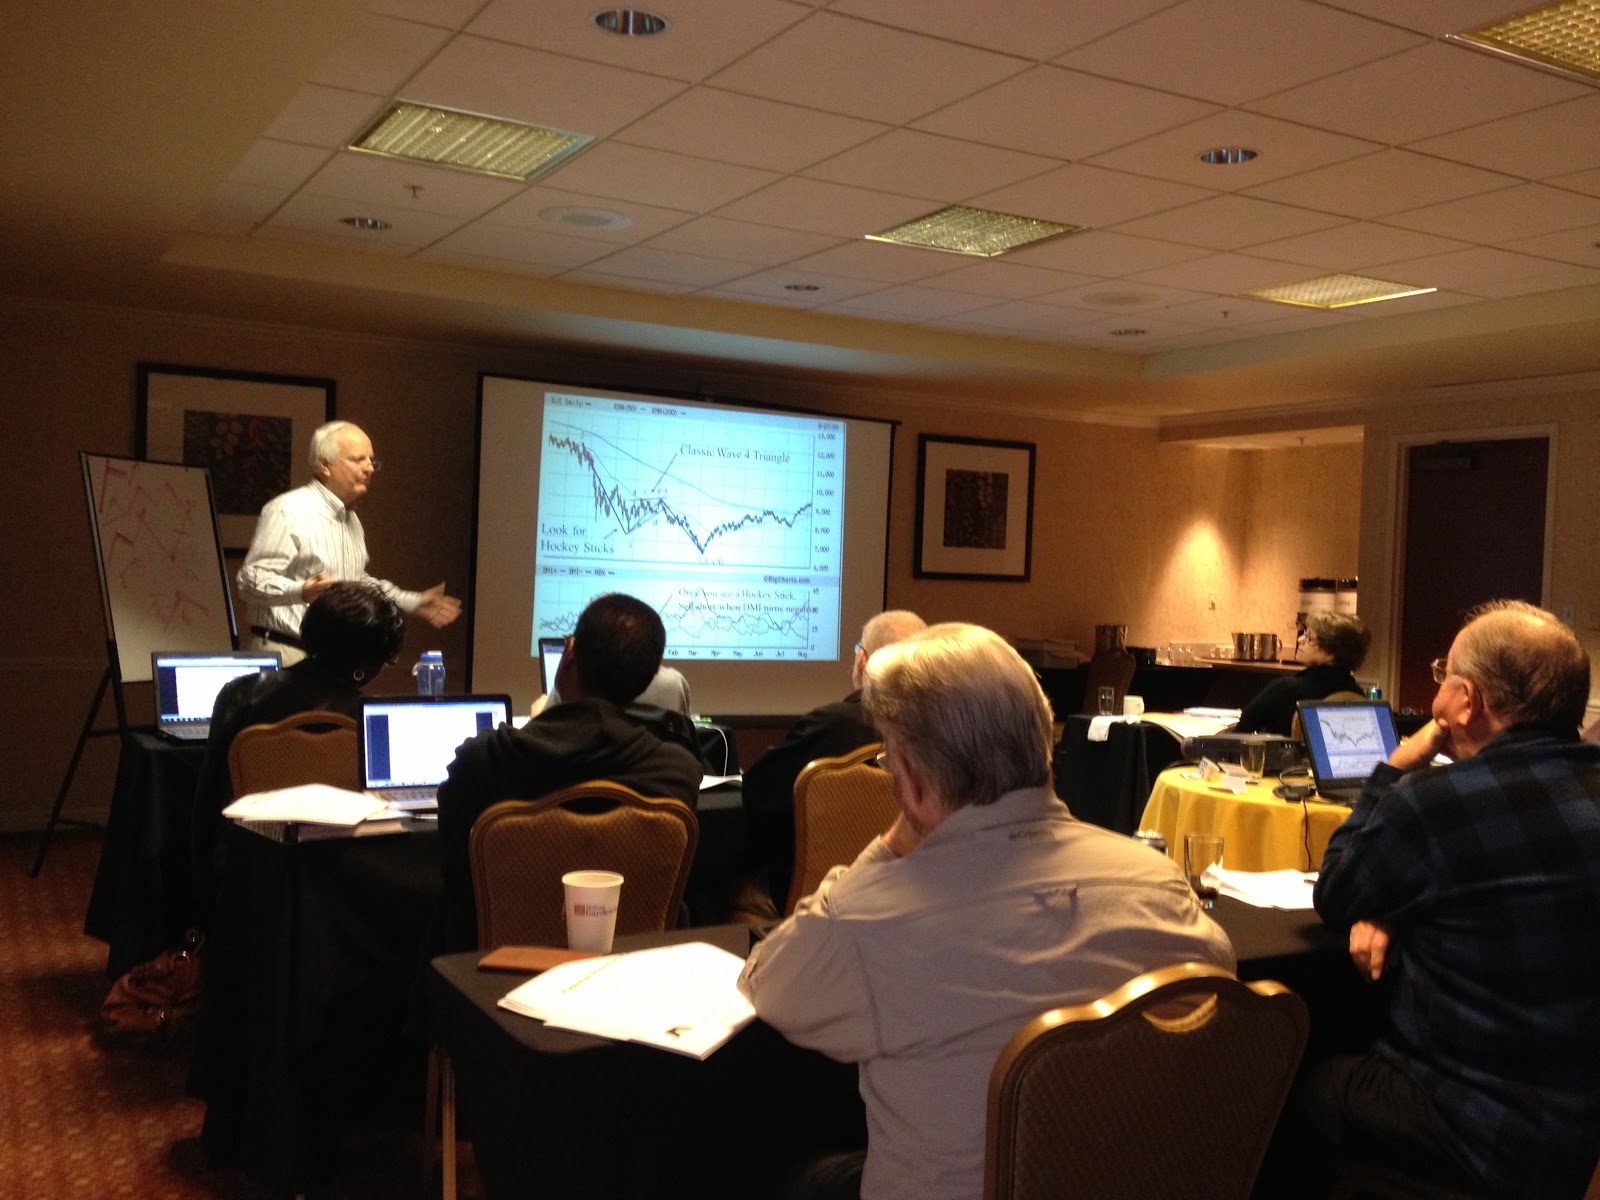
by Hank Swiencinski, AIQ TradingExpert Pro client for over 20 years, founder of ‘The Professor’s One Minute Guide to Stock Management’
AIQ extends its congratulations to Hank for presenting a really excellent seminar on Saturday March 9, 2013. if you attended and have some additional feedback please e-mail Steve Hill
The Dow rose 2 points, closing at 14,450. The Dow got as high as 14,478 before pulling back. Volume was low again, coming in at 90 percent of its 10 day average. There were 244 new highs and only 17 new lows.
The A-D oscillator fell to 14.9 during yesterday’s trading. If we get a down day today, it’s likely that the oscillator will turn negative, meaning that most stocks on the NYSE are starting down trends. Coming at this point in the pattern, there is a good chance that wave ‘b’ down could be starting.
There is also a possibility that a pullback today could be part of a small corrective wave before one final push higher completes the ‘a’wave. At this point it’s hard to tell. And that’s why we will need to keep an eye on the Dean’s List. A small pullback today could turn out to be a false alarm. I don’t want to get too negative until I see a few of those positive ETFs start moving down or dropping off the Dean’s List.
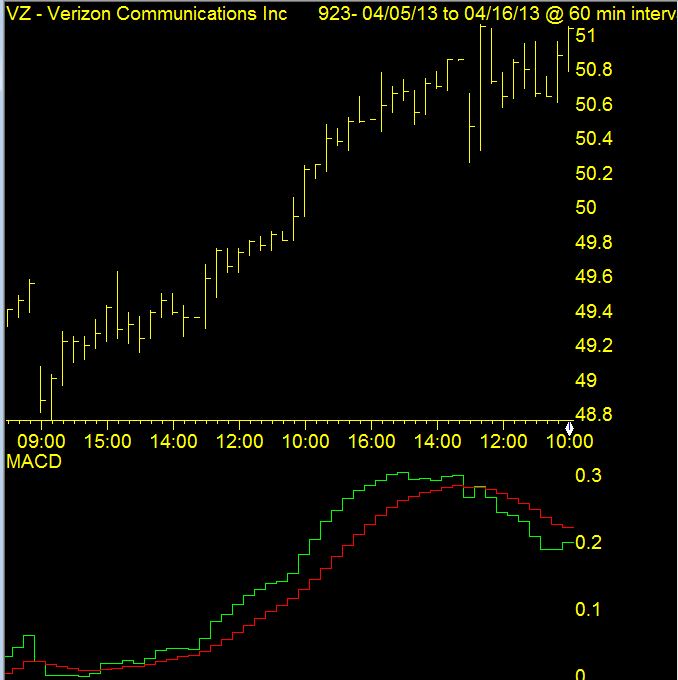
The List remains very strong and the indicators on the cockpit remain positive. However the P-volume, which is one of our three PT indicators remains negative. It has been diverging from price ever since this leg of the current rally started on 25 February. It’s warning us not to get to comfortable.
If you get a chance today, take a look at the P-volume on the DIA, and while you’re at it check it on the Nasdaq (QQQ) as well. It’s actually pretty scary. This negative divergence is also evident on all of the indicators I use to measure market breadth, like the Summation Index, Hi/Lo Oscillator, Advance Decline Indicator, and VA Percent Indicator. They’re all diverging negatively, which is a warning. The Hi/Lo oscillator is actually lower now than it was on 1 February, when the Dow was at 14,009. It’s telling us that fewer and fewer stocks are participating in this rally. Always be careful when the Generals lead and the troops don’t follow.
We still have a ‘relatively’ small change (13.78 points) from the A-D oscillator on the board from two days ago. And because of this we’ll need to pay attention to any decline. There is still a possibility of a Big Move.
Emeritus was pretty quiet again last night, with only one stock being highlighted, and that was a short. This is the second day in a row that he hasn’t had much to say. I would expect that IF the market starts to turn negative, he will start to highlight a few more shorts for the Honor Roll. But right now, he’s silent…both on the long and short side.
Once again, with weak internals, I’m just watching for the markets to start to roll over. I believe the upside potential is limited at this point, so I’m not initiating any new long positions now. If we start out negative today, I will be looking to scalp a few shorts as I’m waiting. I will also be posting the Dean’s List after 1pm today to see if there are any changes. And if the market starts to trade lower, I will also be running Emeritus to see what he has to say as well. If he kicks out 1-2 shorts, I’ll continue to watch. But IF he starts to highlight 6 or more shorts, that will get my attention.
I’m on the sidelines.
That’s what I’m doing,
h
PT Class at UNF tonight.
|