Apr 19, 2013 | Uncategorized
For the last few years, traders and investors in Jacksonville, Florida have had legendary trader and AIQ TradingEpert Pro client, Hank Swiencinski all to themselves. No longer.
The Professor, as he is known by his clients, will be joining Steve Hill in New York to present “The Professor’s One Minute Guide to Stock Management” in person in one action packed 4 hour seminar.
This remarkable course is usually taught in four sessions of 2 hours, and only recently been available outside the walls of the University of Northern Florida in Jacksonville, FL.
Apr 16, 2013 | Uncategorized
MACD divergence is a tried and tested technical tool. If you look at the daily price chart of Verizon below, you can clearly see the recent high on 4-12-2013. Note the MACD is well below the indicator peak back in the middle of March.
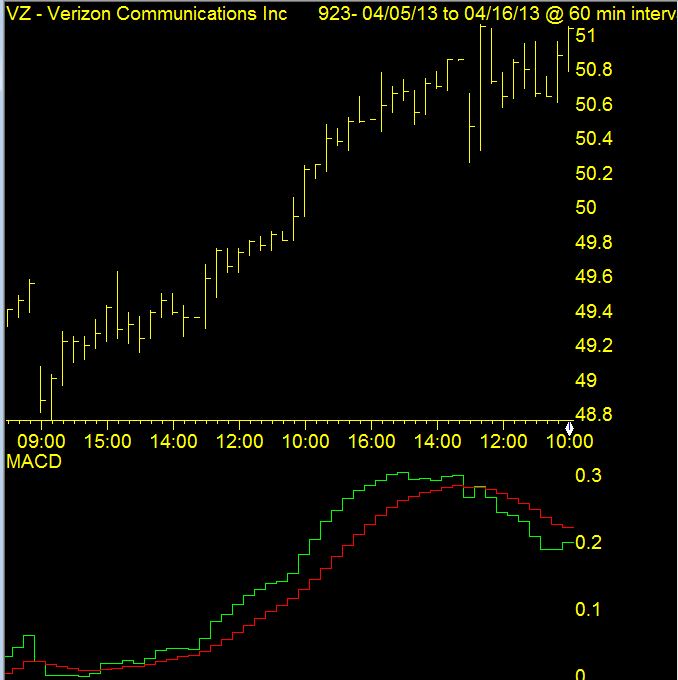
Looking at the hourly real-time chart of Verizon at the close on 4-15-2013, the same MCAD divergence characteristics are apparent.
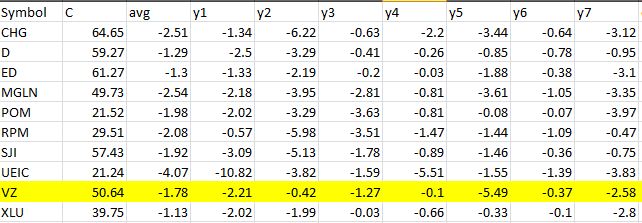
Another report that aligns nicely with this divergence is Seasonality – 5 day. Here’s a list of tickers that have exhibited down moves for this week in April for each of the last 7 years. Verizon is highlighted.
Apr 16, 2013 | Uncategorized
MACD divergence is a tried and tested technical tool. If you look at the daily price chart of Verizon below, you can clearly see the recent high on 4-12-2013. Note the MACD is well below the indicator peak back in the middle of March.
Looking at the hourly real-time chart of Verizon at the close on 4-15-2013, the same MCAD divergence characteristics are apparent.
Another report that aligns nicely with this divergence is Seasonality – 5 day. Here’s a list of tickers that have exhibited down moves for this week in April for each of the last 7 years. Verizon is highlighted.
Apr 4, 2013 | Uncategorized
|
by Hank Swiencinski, AIQ TradingExpert Pro client for over 20 years, founder of ‘The Professor’s One Minute Guide to Stock Management’
AIQ extends its congratulations to Hank for presenting a really excellent seminar on Saturday March 9, 2013. if you attended and have some additional feedback please e-mail Steve Hill
The markets appear to be marking time, waiting for tomorrow’s jobs report.
I started buying shares of DXD when the Dow popped this early morning. Given that I believe the top of wave ‘a’ is somewhere near the 14,650 level, I believe the risk-reward is favorable for shorts at or near these levels.
Here’s the deal: If tomorrow’s jobs report turns out to be poor, it could trigger an impulse wave in wave ‘b’ down. On the other hand, If the jobs report turns out to be positive, I believe the pop will just give me another opportunity to add to my shorts. That’s what I mean by a favorable risk-reward ratio.
Right now there is no trend going on. The Dean is still positive, and Emeritus is still silent. The Professor is mixed with an equal number of Buys as Shorts (4). It’s starting to look like today’s retracement is part of a wave 2 in the ‘b’ wave.
I don’t expect my algorithms to become active until the DIA starts to trade below 145.
So for the rest of the day, I plan to continue to look for and accumulate a few short positions. I’m NOT getting aggressive yet. I’ll only do that when the DMI on the Dow turns negative. However, because I believe the upside potential is limited now that we have reached my targets, I will start holding my short positions overnight.
I’m now long DXD and short ORCL.
TWID,
h
|
|
All of the commentary expressed in this site and any attachments are opinions of the author, subject to change, and provided for educational purposes only. Nothing in this commentary or any attachments should be considered as trading advice. Trading any financial instrument is RISKY and may result in loss of capital including loss of principal. Past performance is not indicative of future results. Always understand the RISK before you trade.
|
Mar 14, 2013 | Uncategorized
The AIQ code based on Ron McEwan’s article in the March issue of Stocks & Commodities, “Low-Frequency Trading,” is provided at the following website: www.TradersEdgeSystems.com/traderstips.htm.
The cumulative indicators on the advances and declines for the NYSE are provided in the first section of code that follows. However, I have never liked cumulative indicators because results can vary depending on where the accumulation is started. I do not recommend using the first code set below that replicates the author’s indicator because it runs so slowly that you will think your computer is frozen. Thus, I coded an alternative that uses the built-in advance-decline (A/D) line and then takes a moving average of the built-in A/D line. This version runs quickly and probably gives similar results.
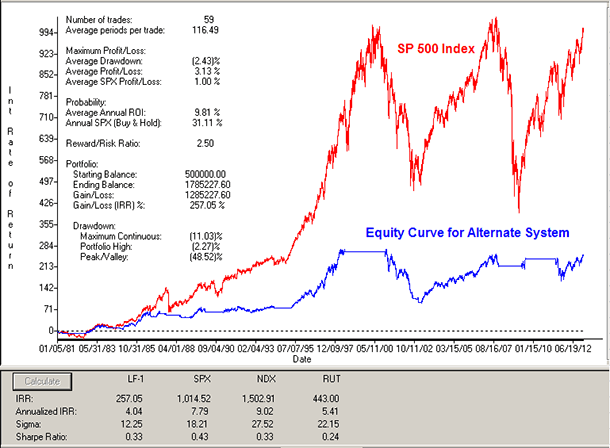
I did not test the first coded version. I tested my second code set as a timing system on the S&P 500 ETF (SPY) from 1981 to 2/12/2013 (Figure 7). As with most timing systems, the risk was reduced based on a lower sigma than that of the markets and the return was also less than just buying and holding the SPY for the test period.
FIGURE 7: AIQ. Here is a sample equity curve for the alternative system trading the SPY from 1/5/1981 to 2/12/2013 compared to the S&P 500 (SPX).
The code and EDS file can be downloaded from
www.TradersEdgeSystems.com/traderstips.htm.
The code is also shown below.
!LOW-FREQUENCY TRADING !Author: Ron McEwan, TASC April 2013 !Coded by: Richard Denning !www.TradersEdgeSystems.com !INPUT: advMAlen is 252. !ABBREVIATIONS: C is [close]. OSD is offSetToDate(month(),day(),year()). !AUTHORS INDICATOR AND SYSTEM (processes very slowly-see alternate below): DaysToStart is min(advMAlen,scanany(month()=02 and day()=05
and year()=1980,252*50) then OSD). NYadv is TickerUDF(“DJIA”,[Adv Issues]). NYdec is TickerUDF(“DJIA”,[Dec Issues]). ADVpctTot is (NYadv-NYdec) / (NYadv+NYdec) * 1000. ADVcumPct is sum(ADVpctTot,^DaysToStart). ADVcumPctMA is simpleavg(ADVcumPct,252). HD if hasdatafor(advMAlen +10) > advMAlen. Buy if ADVcumPct > ADVcumPctMA and HD. Sell if ADVcumPct < ADVcumPctMA. !ALTERNATE TO ABOVE (due to processing speed recommend that this one is used): ADline is tickerUDF(“DJIA”,[AD Line]). ADlineMA is simpleavg(ADline,252). BuyAlt if ADline > ADlineMA and HD. SellAlt if ADline < ADlineMA.


 English