Oct 10, 2018 | indexes, market timing, Portfolio management, Risk management, stock market, Stock trading
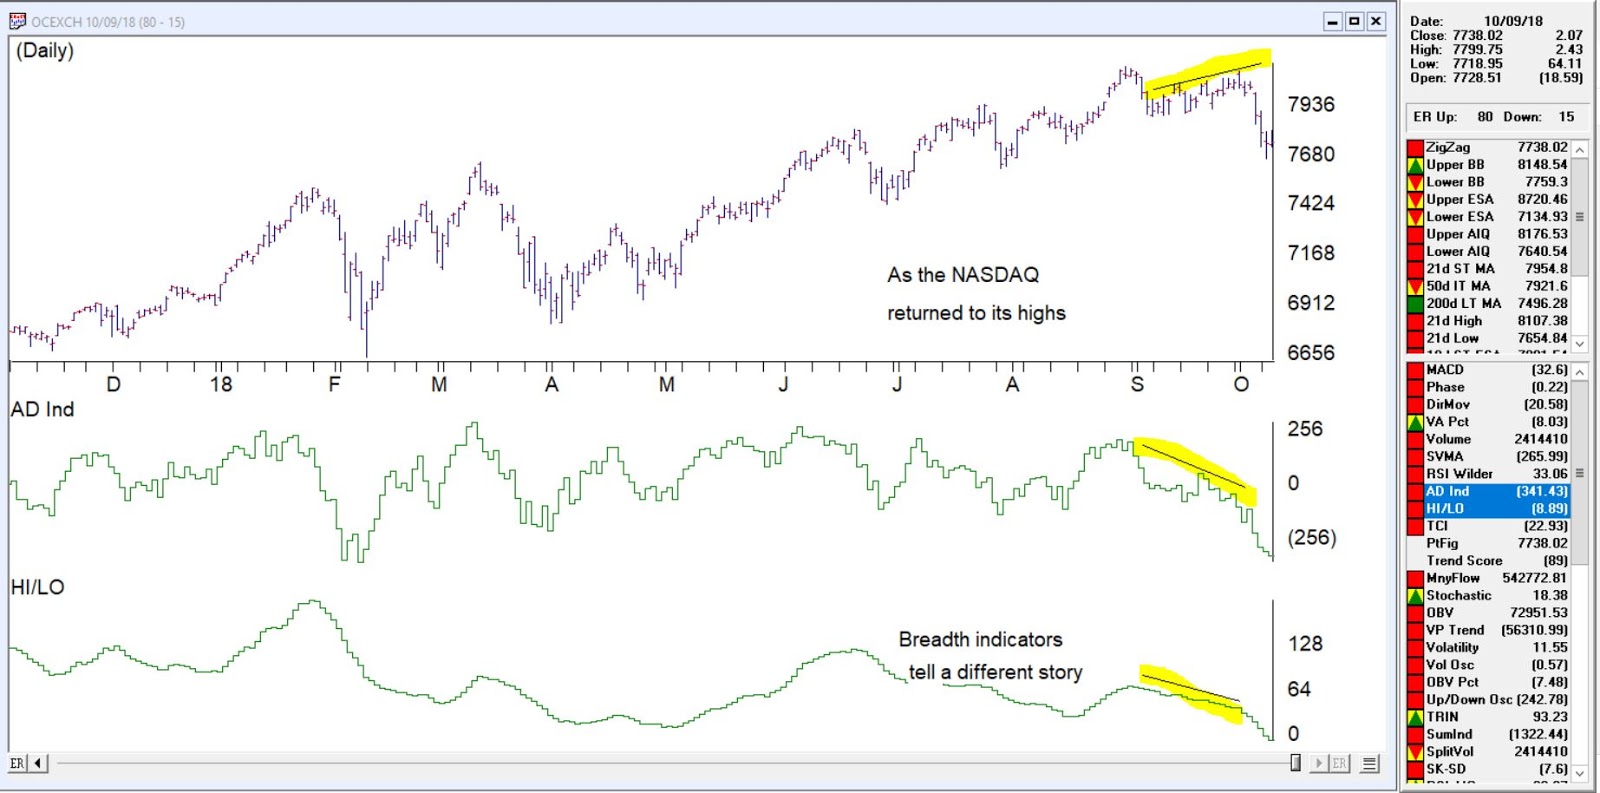
Working on some slides for a seminar last week, it was apparent that breadth indicators on the NASDAQ signaled a divergence from the price action of the market.
Looking specifically at AD Ind and HI/LO, although other breadth measures told the same tale.
The AD indicator explained
The Advance/Decline Indicator is an exponentially weighted average of the net advancing versus declining issues. With this indicator, the direction of the trend is of importance and not the actual value of the indicator. When the indicator is increasing, advances are outweighing declines, and when it is decreasing, there are more declining issues than advancing.
The Advance/Decline Indicator is a breadth indicator very similar to the Advance/Decline Line. However, this indicator tends to be more sensitive and at times will signal a move earlier than the Advance/Decline Line.
The breadth was telling us something was amiss from last week. Take a look at this chart of the NASDAQ clearly a divergence was in place before the downturn.
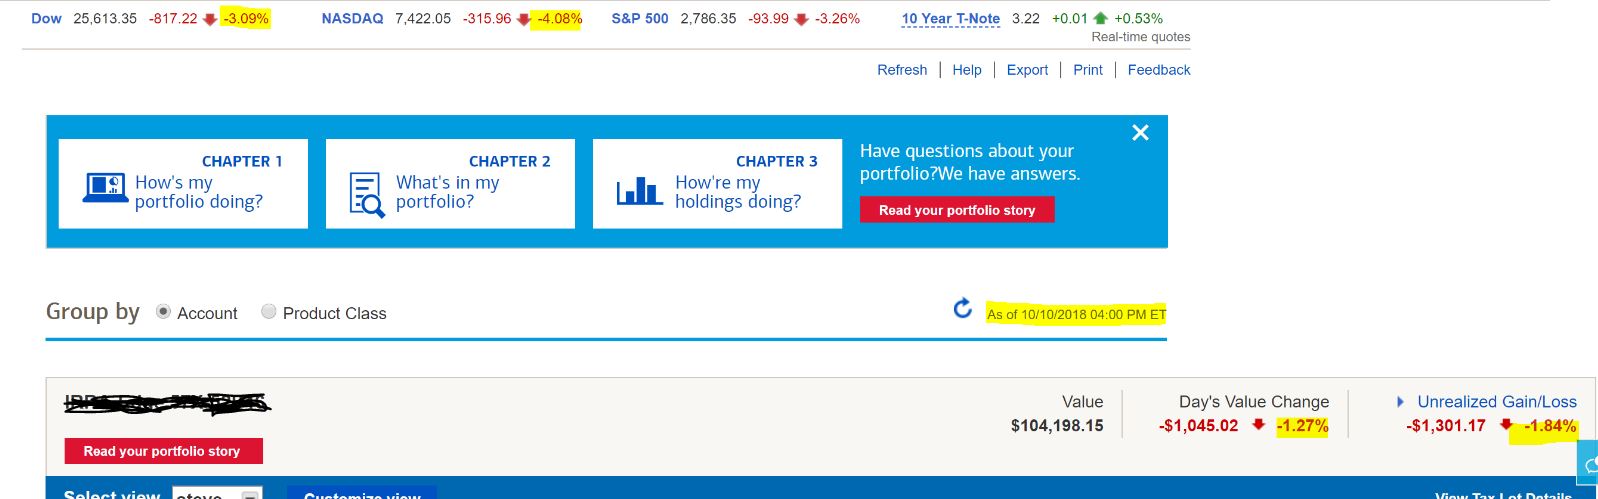
Today’s (10-10-18) 316 point drop in the NASDAQ a 4% drop and nearly 9% drop from the high is close to the 10% corrective point and some buyers may come in over the next few days and keep the decline in check or not.
The markets are down between 6 and 10% in 5 days. Keeping good stops is a must in your portfolio to protect you from the worst of this. Using trailing stops between 7 and 10 % on stocks that are moving and protective stops 5 to 7 % below initial investment for example can easily reduce your losses in these volatile markets.
Mar 29, 2018 | Charts, EDS, EDS code, Risk management
Harness your trading potential April 26, 2018
Join us at Wealth Training offices for a full day seminar using WinWayCharts
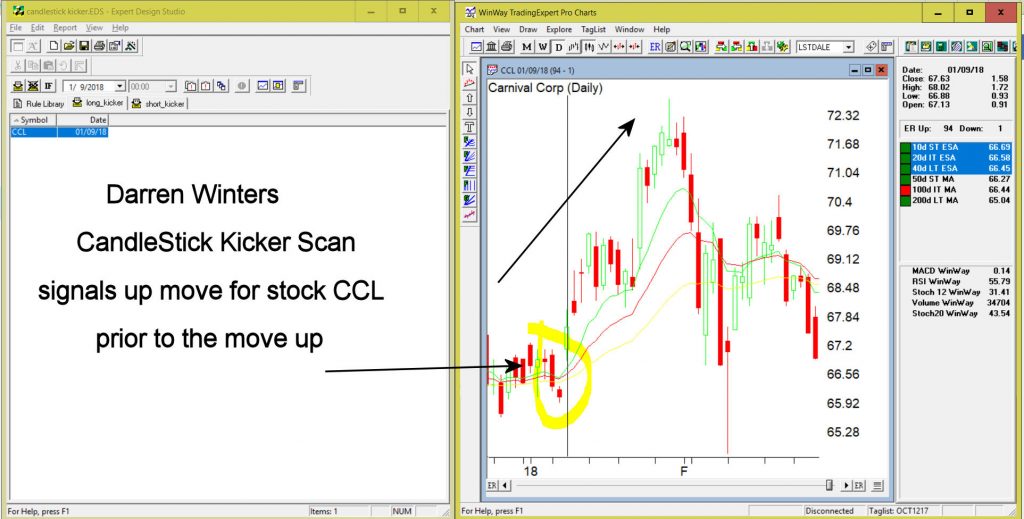
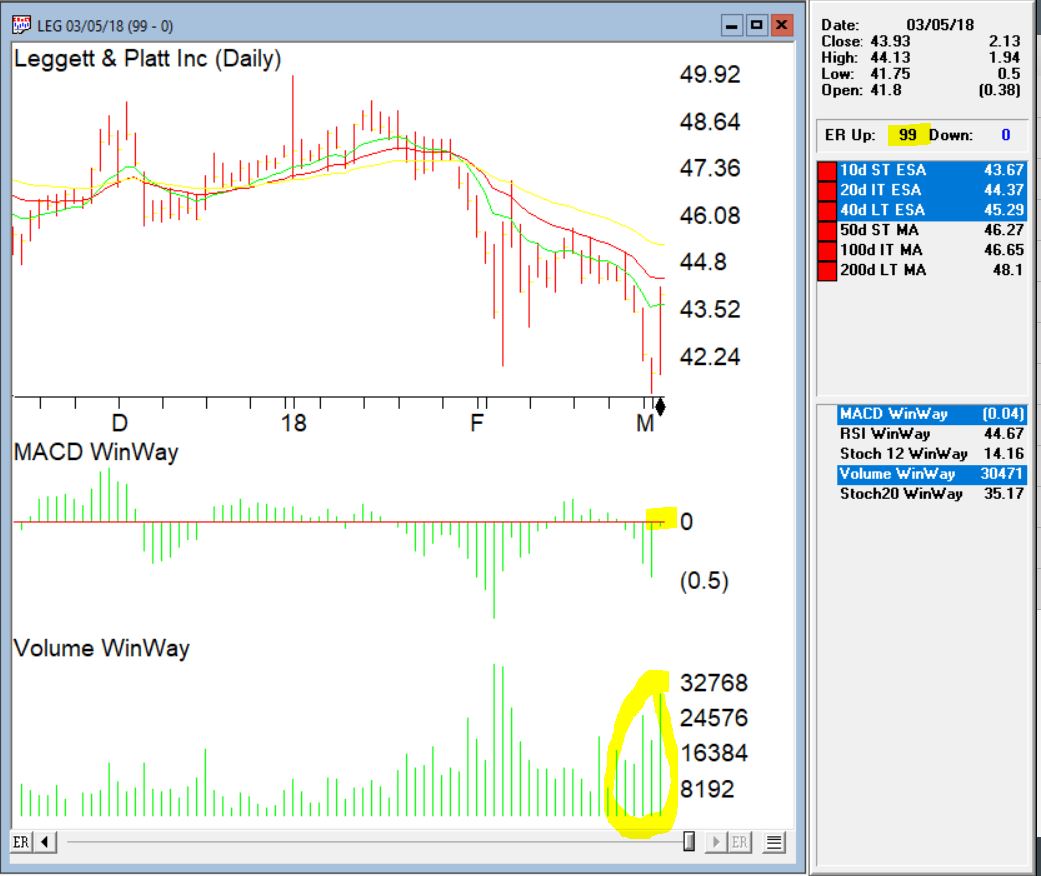
Darren Winters preferred trading software
New to WinWayCharts or a veteran looking for a refresher, this seminar is for you. We’ll be covering in detail the application of Darren Winters indicators and strategies within the trading software and taking you through some of the powerful tools that will make your analysis easier and save you time.
Now more than ever, stock traders need an edge to successfully trade stocks
We really don’t care if the market goes up or down. With the right tools, used the right way, there are always opportunities to make money trading stocks.
In this full-day seminar, Steve Hill, founder of WInWayCharts, will start at the top with the powerful Market Analysis tools, Sector Rotation and Stock Selection, plus he’ll recap technical indicators that Darren uses and reveal additional confirming indicators that are essential for making good trading decisions, .
All of this will build up to developing a trading strategy that suits your trading style. Finally he’ll take you through trade execution and trade management with live market action and trades. With this traders blueprint, you’ll have the tools you need to take your trading efficiency to a new level.
Rare opportunity to spend the day with
WinWayCharts founder Steve Hill
Those of you have had an opportunity to spend time with Steve at sessions at Wealth Training will appreciate his broad and in-depth knowledge and experience in trading analysis. Darren and Steve have worked together to develop and improve the WinWayCharts software throughout the last 10 years. Today the WinWayCharts platform is one of the fastest and most comprehensive stock analysis tools in the world.
You’ll need to be on your toes for this seminar. Every session is designed to enhance your current trading skill and take you to the next logical step as a trader.
Topics covered in this action-packed day include:
– Market Timing – a thorough breakdown of WinWayCharts Market Timing and how to use it effectively
– Sector Rotation – Tools for identifying leading and lagging sectors and how to maximize your investments
– Technical indicators you have in WinWayCharts that every trader and investor must use
– Hidden tools in your WinWayCharts that can save you time and make you money
– Steve trading account, establishing positions, portfolio management of established positions, exiting positions and live trades in action
This opportunity won’t be available again this year!
Seats are limited. Don’t hesitate, fast track your way to trading success PLUS early bird pricing now applies.
ONLY a few more days left to lock in the early bird price
Book your seat before March 31, 2018 and you’ll pay
ONLY $649
$499
a $150 saving
or call 0207-749-2205 Mon-Fri 08:00-4:00pm
May 3, 2014 | chart patterns, Risk management, Seasonality, trading strategies
I have to admit I am a little surprised. It is the last day of April and so far I have only seen a couple hundred thousand “Sell in May and Go Away” related articles, as opposed to the usual several hundred bazillion such articles that usually make their appearance about his time each year. Still, what with May due to pop up at midnight tonight it seems like as good a time as any to chime in.
What You Probably Already Know
Historically the stock market has performed much better between the end of October and the third trading day of May that it has between the third trading day of May and the end of October. To wit, sees Figure 1 and 2.
.
Figure 1 – $1,000 in the Dow from October 31st through 3rd trading day of May (1960-present)
Figure 2 – $1,000 in the Dow from 3rd trading day of May to October 31st (1960-present)
Starting on 10/31/60:
* $1,000 invested in the Dow Industrials each year at the close of trading on the last trading day of October and held through the close of the third trading day of May grew to $47,280.
* $1,000 invested in the Dow Industrials each year at the close of trading on the third trading day of May and held through the close of the last trading day of October decreased to $599.
So to put it in blunt terms:
October to May = +4,628%
May to October = (-40%)
So clearly there is something to the “Sell in May” thing. There is a caveat, however. As you can see from a perusal of Figure 2 it is not as though the stock market declines each and every year during the May to October period. So during many years selling in May and getting back in at the end of October would cause your returns to trail that of the overall market (and we can’t have that now can we?).
So that explains why roughly half of the bazillion annual “Sell in May” related articles warn against blindly selling in May.
What You Probably Don’t Know
Like they always say, sometimes it’s not what you know but who you know that counts. Or in this case, not even someone I have personally met but do associate with. Rob Hanna is the head of Hannah Capital Management (www.QuantifiableEdges.com) and is a colleague of mine in AAPTA (American Association of Professional Technical Analysts). Rob revealed in some of his work the following “guide” for determining whether to “sell in May” or not:
-If the S&P 500 experiences a drawdown of 5% or more between December 31st and April 30th, then sell in May.
-If the S&P 500 DOES NOT experience a drawdown of 5% or more between December 31st and April 30th, then DO NOT sell in May.
Doesn’t get much simpler than that. Since 1960 there have been 14 years during which the S&P 500 did not experience a 5% drawdown and an investor would have simply remained in the market. The results appear in Figures 3 and 4.
Figure 3 – $1,000 in the Dow during bullish periods applying Hanna Sell in May Filter (1960-present)
Figure 4 – $1,000 in the Dow during bearish periods applying Hanna Sell in May Filter (1960-present)
In cold hard numbers:
* $1,000 invested in the Dow Industrials each year durung the “bullish” periods described grew to $70,244.
* $1,000 invested in the Dow Industrials each year duirng the “beairsh” periods describeed decreased to $403.
So to put it in blunt terms, applying Rob Hanna’s Sell in May Filter:
*October to May (plus May to October when no Sell in May IS NOT triggered) = +6,924%
*May to October (only during years when Sell in May IS triggered) = (-59.7%)
Here’s The Bad News
As you can see in Figure 5, the S&P 500 experienced a drawdown of -5.76% between the end of December and the end of April. And -5.76% is greater than -5% (OK, mathematically speaking -5.76 is technically LESS than 5%, but you get my drift – there was a drawdown in excess of 5%).
Figure 5 – S&P 500 for 2014
So by that rule, the Sell in May model that I prefer says to sell at the close on the third trading day of May and to buy back in at the end of October (although for the record, buying at the end of September is typically better in a mid-term election year, but that’s a topic for another article).
Summary
So because the S&P 500 experienced a -5.76% drawdown is the stock market absolutely, positively doomed to decline between May and the end of October? Of course not. But the historical odds seem to suggest that caution may be in order.
Jay Kaeppel Chief Market Analyst at JayOnTheMarkets.com and AIQ TradingExpert Pro (http://www.aiq.com) client
Jay has published four books on futures, option and stock trading. He was Head Trader for a CTA from 1995 through 2003. As a computer programmer, he co-developed trading software that was voted “Best Option Trading System” six consecutive years by readers of Technical Analysis of Stocks and Commodities magazine. A featured speaker and instructor at live and on-line trading seminars, he has authored over 30 articles in Technical Analysis of Stocks and Commodities magazine, Active Trader magazine, Futures & Options magazine and on-line at www.Investopedia.com.
Feb 7, 2014 | Portfolio management, Risk management, trading strategies
Risk denotes the probability of an outcome, when an individual places an investment of value in the path of forces outside their control. Straightaway the madness of this practice is revealed, yet the pages of history are littered with those that have brought about the greatest advances mankind has ever made in return for risking something of value.
It may be interesting to note that the volatility of the recent global financial crisis saw the advent of many newcomers onto the BRW Rich List in 2008, and the contention that risk is defined by the market falling is not to the point. Today, due to the very existence of derivatives such as options, swaps and forward rate agreements, an individual can direct risk and return to almost every possible market contingency, regardless of the volatility exhibited.
The Bell Curve represents a distribution of events, with the ‘bell’ representing those events that are most likely; events that are in close proximity to present market price. These resemble at-the-money options.
As we get further away from conditions prevailing at the time, the likelihood of particular events occurring will not only decrease, but will decrease in probability at an increasing rate. These less likely events take their place along the tapering edges of the bell, extending to both extremes. A pricing model attributes time value in this very fashion.
The standard deviation is the unit used to measure the probabilities transgressed from the status quo, to the market price when a particular event occurs. These measured intervals decrease in size, as the two poles of this dimension are approached; the difference between a movement of one standard deviation and two standard deviations will be far greater than that of seven deviations and eight standard deviations.
Primarily, this is due to the fact that there is little difference between probabilities that are small with other probabilities of that class, and similarly, little difference between probabilities that are high with members of that class also. They are described at a high level of abstraction that classifies them broadly as ‘high’ or ‘low’ probability.
However, when events of low probability are compared with those that are of high probability, a happening may be for example, said to be effected by a movement across seven standard deviations. In this event it is a rare occurrence indeed. When volatility is high, it is useful to note that not only are the entire bell and its tapered edges lifted higher on the plane, but the edges of the bell, move closer in gradient to the body. In higher volatility, this is directly due to the indiscriminate application of an increased probability in all possible events. The opposite will be found in low volatility with in this case, the actual bell of the curve becoming much smaller.
Accordingly, a matrix of probabilities is able to be placed in perspective.
Heavily reliant on reason, the contention that price and quality are inexorably attached is well founded in history. Even more so in perfect markets, at very least we can state with confidence that low risk and high risk are not uniformly priced. While the perception of value is a personal value judgment, what is most definite is that markets provide returns that are commensurate with the risk undertaken.
Consideration of the capital needed to fund a position, and also a variety of possible market outcomes must firmly occupy the consciousness of every trader. Insight into one’s own ability to function under the weight of risk is also crucial to profitability, as decision making needs to be carried out as free of subjective influences as possible. At any length, a good rule of thumb will be to allow 25% of risk capital to remain free for unexpected contingencies.
Mar 22, 2010 | ETFs, indicators, Risk management, trading strategies
An Excerpt from the Timely Trades Letter.
Horizontal support and resistance levels should always be considered when selecting potential trades. Since stocks often consolidate, or bounce near support and resistance the distance between the entry point and support (for shorts) or resistance (for longs) is an important consideration when deciding whether or not to take a particular trade. I want to find trades with ‘room to run’ as the stock pulls back and approaches support.
Trading is based on being positioned to profit if the stock, or the market, does the usual thing in a given situation. Since stocks often bounce from support, candidates with a larger distance to support from the entry are more attractive because they have more ‘room to run. When a trading pattern occurs near support it may just drop to support and bounce, thereby limiting potential profits.
I also apply the same concepts of support, resistance, and accumulation to the market itself to determine if trading is appropriate. If I am trading shorts and the market is approaching support I become cautious. The reason is that the market often bounces or bases near support and thus shorts would be less attractive. When the market is clearly trending and well away from support I will use larger position sizes in my trades than when the market is approaching a support level. I cannot influence what the market does, but I can react to it and reduce my risks by taking smaller position sizes when the market is approaching a support level.
Someone usually asks the question, ‘yes, but what if the market had broken below support, would it not have been better to hold onto the short positions’?
I trade based on what the market usually does, not what I hope may
happen, or what sometimes happens. Since the market often bounces when retesting important lows I will stop taking new shorts and take profits on existing ones when the market approaches support. The market has two choices when it approaches support. It can bounce or it can break bellow. If the market bounces I will not incur potential losses from new shorts and will have the profits from the positions I closed. If the market breaks below support I will have the profits from the positions I closed and can easily take new positions to get back in the game. There is less risk in taking the profits when the market approaches support. It is tough to go broke taking profits. It is easy to go broke by holding on too long.
Things to do each evening:
Look at the price and volume action on the NASDAQ. Where are support and resistance levels? How is the volume on recent up and down days. Given the recent daily range, how many days would it take to reach support or resistance?
Look at each of your positions for the same information listed above. Where are your stops, and do they need to be adjusted? Do you have any stocks that are extended (consider profit taking) or ones that are breaking trend lines or support (consider exiting)?
Review your watch list of interesting patterns and make a list of the best set ups to take a look at tomorrow. Review the watch list for patterns that are no longer valid and delete those stocks from the
watch list.
Learning to trade with the Market is a key part of taking investment results to the next level. It’s harder than it sounds, and takes some experience. I haven’t met many traders who got the experience by paper trading, the pain of losing is what causes people to spend thetime and effort to review their trades and learn from the mistakes.Don’t just write off losses, learn from them, they are part of the tuition you pay to learn how to trade.
Learning to sell as the Market approaches resistance takes some practice, since after a nice run most people want to put more money in.
I generally place a protective stop immediately after entering the trade. The stop is normally under the previous day’s low, or the low of the pattern. Remember that the protective stop is just to keep you from having a bad loss. If you leave the stop at its initial protective value and use it as your only exit you will lose money. Generally set the initial protective stop at the point where the trade set up would be invalidated, then watch the behavior of the stock and the market to determine when to get out. I also make sure the stop is not at a round number, or something that ends in 5 since this is where most people place the stop. Instead of 23.00, I would place the stop at 22.95. Instead of 18.95, I would use 18.84.
Steve Palmquist a full time trader who invests his own
money in the market every day. He has shared trading
techniques and systems at seminars across the country;
presented at the Traders Expo, and published articles in
Stocks & Commodities, Traders-Journal, The Opening Bell,
and Working Money. Steve is the author of, “Money-Making Candlestick Patterns, Backtested for Proven Results’, in which he shares backtesting research on popular candlestick patterns and shows what actually works, and what does not. Steve is the publisher of the, ‘Timely Trades Letter’ in which he shares his market analysis and specific trading setups for stocks and ETFs. To receive a sample of the ‘Timely Trades Letter’ send an email to sample@daisydogger.com. Steve’s website:www.daisydogger.com provides additional trading information and market adaptive trading techniques. Steve teaches a weekly web seminar on specific trading techniques and market analysis through Power Trader Tools.
Terms of Use & Disclaimer:
This newsletter is a publication for the education of short
term stock traders. The newsletter is an educational and
information service only, and not intended to offer investment advice. The information provided herein is not to be construed as an offer or recommendation to buy or sell stocks of any kind. The newsletter selections are not to be a recommendation to buy or sell any stock, but to aid the investor in making an informed decision based on technical analysis. Readers should always check with their licensed financial advisor and their tax advisor to determine the suitability of any investment or trade. Trading stocks involves risk and you may lose part or all of your investment. Do not trade with money you cannot afford to lose. All readers should consult their registered investment advisor concerning the risks inherent in the stock market prior to
investing in or trading any securities.