If you follow jay Kaeppel’s posts in this blog, you’ll know that he’s the master of research on all things seasonal. This past week he posted a seasonal article on energy using FSESX – Fidelity Select Energy Services. Previously he had noted the bullish tendency for ticker FSESX during the months of February, March and April. In his follow up piece, he added one more “favorable” month and then also looked at a 6-month “unfavorable” period. The article is included at the end of this post so you can see the results.As Mutual funds are not for everyone, we went in search of alternative tickers that could closely match FSESX in performance characteristics. Using WinWay Matchmaker we compared the price action of FSESX against our universe of stocks and ETFs looking for a match.
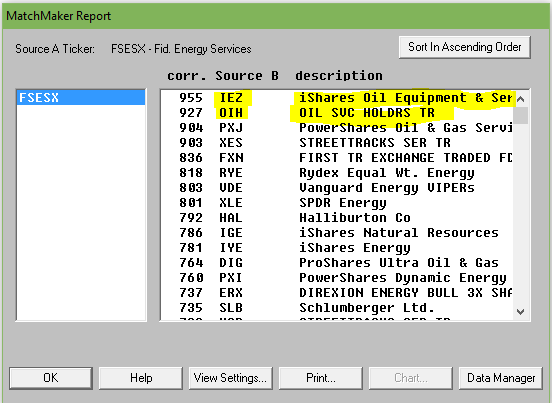
Matchmaker uses Spearman Rank Correlation analysis to identify a close match to FSESX. The closer the result to 1000, the higher the correlation. Anything over 950 is a very close match. Here’s the results.
Figure 1. MatchMaker correlation for last 4 years – FSESX vs stocks and ETFs
The ETF IEZ – iShares Oil and Equipment & Services showed a very high correlation over the 4 years we tested. OIH – Oil Service Holders, another ETF, also showed high correlation.
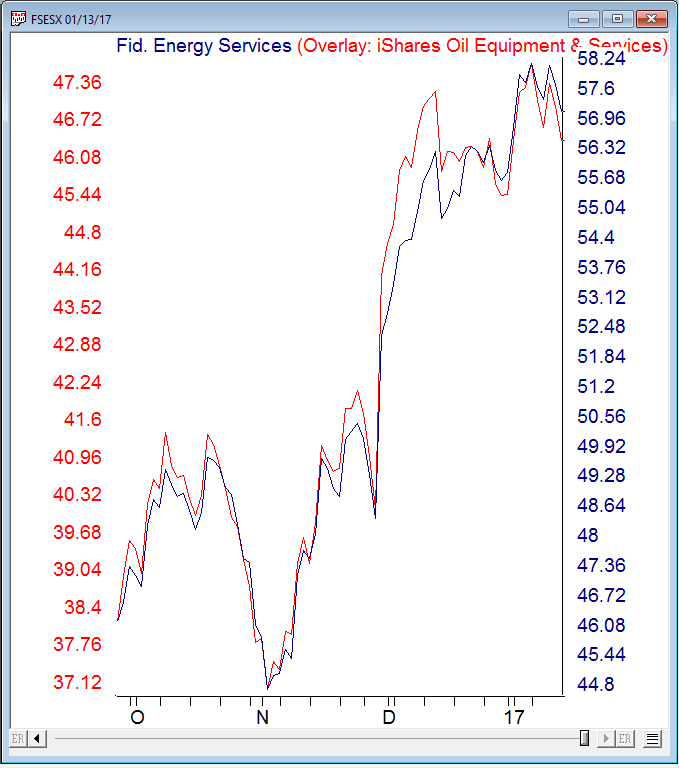
Here’s a WinWay overlay chart of recent daily price action comparing FSESX vs IEZ.
Figure 2. Recent daily price action comparing FSESX vs IEZ.
IEZ appears to be a good surrogate for FSESX at least over the last 4 years.
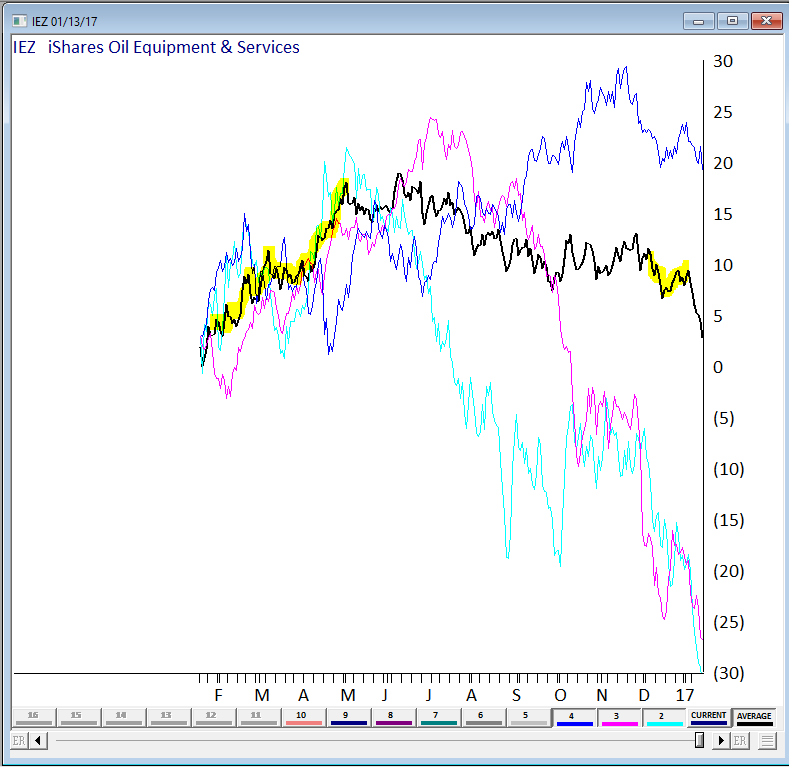
We also wanted a visual of the seasonal pattern in action. Fortunately we have a tool still in development at WinWay that’s just right for this. Basically it provides a price comparison of ‘x’ numbers of years of the same ticker overlaid on each other.
Here’s 3 of the last 4 years on IEZ, the average of the years displayed is in black. We highlighted the Feb, Mar, Apr and Dec in yellow. We could have included more years but for illustration purposes it was easier to show the 3 years (the chart gets busy with too many lines on it!)
Figure 3 – IEZ seasonal chart (beta) for 3 years with average.
The Feb, Mar, Apr period has a definite bullish tendency, the Dec period does Ok too. You’ll notice the tendency for IEZ to fall sharply in January. Conclusion? IEZ is a reasonable surrogate for FSESX if you’re contemplating this seasonal move.
_________________________________________________________
The article this follow up is based upon is by Jay Kaeppel and is included below. Jay is
Chief Market Analyst at JayOnTheMarkets.com and TradingExpert Pro client. http://jayonthemarkets.com/If you are looking for a market sector with some serious seasonal trends, look no further than the energy sector. Previously I had noted the bullish tendency for ticker FSESX during the months of February, March and April. In this piece, we will add one more “favorable” month and then also look at a 6-month “unfavorable” period.
For the record, the information that follows is not being recommended as a standalone strategy. It is presented simply to make you aware of certain long-term trends that have been very persistently bullish (or bearish as the case may be) in the energy sector.
4 Favorable Months
*The four “favorable” months for our test are February, March, April and December
Figure 1 displays the growth of $1,000 invested in ticker FSESX only during these four months every year since 1986 versus simply buying-and-holding ticker FSESX.
Figure 1 – Growth of $1,000 invested in FSESX only during Feb, Mar, Apr, Dec every year since 1986
Starting in 1986, an initial $1,000 investment grew to $76,019 (or +7,500%) versus $10,237 (or 923%) using a buy-and-hold strategy.
6 Unfavorable Months
The six “Unfavorable” months are June, July, August, September, October and November.
First the “positive” news:
*This 6-month period has managed to show a gain 14 times in 31 years – so by no means should you consider this period a “sure thing” loser
*During 4 separate years – 1997, 2003, 2004 and 2010 – the “unfavorable” months registered a cumulative gain in excess of +30%.
Doesn’t sound all that “unfavorable” so far does it? But here’s the catch: Despite the occasional 30%or more gain, it is fair to refer to this 6-month period as “unfavorable” as the cumulative long-term results of buying and holding FSESX during these months has been nothing short of devastating.
Figure 2 displays the growth of $1,000 invested in ticker FSESX only between the end of May and the end of November every year starting in 1986.
Figure 2 – Growth of $1,000 invested in FSESX only during June through November every year since 1986
Starting in 1986, an initial $1,000 investment declined to just $82, or a cumulative loss of -91.8%
Figure 3 displays some comparative data between favorable and unfavorable periods as well as using a Buy-and-Hold strategy.
| Measure |
Buy-and-Hold |
4 Favorable Months |
6 Unfavorable Months |
| Average Annual % +(-) |
12.8 |
16.5 |
(-4.2) |
| Median Annual % +(-) |
8.7 |
15.5 |
(-1.8) |
| Standard Deviation |
33.4 |
20.1 |
24.6 |
| # Years UP |
18 |
26 |
14 |
| # Years DOWN |
13 |
5 |
17 |
| Worst Year |
(-55.4) 2008 |
(-7.6) 1994 |
(-62.8) 2008 |
| $1,000 becomes |
$10,237 |
$76,019 |
$82 |
| Cumulative % +(-) |
+923% |
+7,500% |
(-92%) |
Figure 3 – Comparative Results
Figure 4 displays the year-to-year results for a Buy-and-Hold approach versus holding only during the 4 “favorable” months or the “Unfavorable” 6 months.
| Year |
All 12 months % +(-) |
4 Favorable % +(-) |
6 Unfavorable % +(-) |
| 1986 |
(8.9) |
(5.2) |
(9.2) |
| 1987 |
(20.7) |
22.9 |
(40.1) |
| 1988 |
(4.2) |
22.8 |
(16.3) |
| 1989 |
50.3 |
27.1 |
16.2 |
| 1990 |
8.7 |
4.9 |
(11.2) |
| 1991 |
(19.9) |
4.1 |
(25.0) |
| 1992 |
4.9 |
(1.6) |
(1.3) |
| 1993 |
16.4 |
24.5 |
(10.7) |
| 1994 |
(0.5) |
(7.6) |
3.1 |
| 1995 |
40.0 |
33.7 |
2.0 |
| 1996 |
45.9 |
22.5 |
20.8 |
| 1997 |
43.9 |
(4.9) |
32.9 |
| 1998 |
(41.4) |
26.5 |
(50.5) |
| 1999 |
80.9 |
74.1 |
7.5 |
| 2000 |
51.7 |
77.6 |
(21.1) |
| 2001 |
(22.4) |
20.8 |
(32.4) |
| 2002 |
2.2 |
26.2 |
(18.0) |
| 2003 |
13.1 |
15.5 |
(16.0) |
| 2004 |
26.2 |
1.2 |
30.2 |
| 2005 |
47.4 |
4.8 |
34.0 |
| 2006 |
(9.1) |
(4.1) |
(1.8) |
| 2007 |
58.3 |
25.6 |
16.7 |
| 2008 |
(55.4) |
10.5 |
(62.8) |
| 2009 |
60.4 |
24.5 |
9.6 |
| 2010 |
31.7 |
21.6 |
33.7 |
| 2011 |
(18.5) |
3.1 |
(16.8) |
| 2012 |
(3.9) |
0.7 |
9.6 |
| 2013 |
14.1 |
0.3 |
11.5 |
| 2014 |
(19.5) |
7.2 |
(26.7) |
| 2015 |
(19.7) |
2.9 |
(17.9) |
| 2016 |
44.2 |
28.4 |
20.1 |
Figure 4 – Yearly % +(-) for Buy-and-Hold versus 4 Favorable Months versus 6 Unfavorable Months
Summary
There is no guarantee from year-to-year results of buying and holding ticker FSESX during the “Favorable 4” months will show a gain and/or outperform the “Unfavorable 6” months. And there is by no means any guarantee that the “Unfavorable 6” will show a loss during any given year (note that 2016 saw the Unfavorable 6 generate a cumulative gain of +20.1%!). So just remember that we are talking about some very long-term trends here.
Still, most investors can discern the difference between:
*Favorable 4 months gain = +7,500%
*Unfavorable 6 months loss = (-92%)
This type of difference is what we “quantitative types” refer to as “statistically significant.”