While looking through the seasonal trends in stocks and currencies, we decided to start running the seasonality scans on the S & P 500 groups. As a reminder here are the criteria we consider when running this.
Our study looks at 7 years of historical data and looks at the returns for all groups in the S & P 500 for the month of July from 2006 to 2013.
We do make an assumption that the month is 21 trading days and work our way back from the last day of the month. July also has the July 4th holiday and a half day trading on July 3rd. if the last day of the month falls on a weekend, then we use the first trading day prior to that date.
We make no assumptions for drawdown, nor do we look at the fundamentals behind such a pattern. We do compare the group to the market during the same period and look at the average SPY gain/loss vs. the average group gain/loss. This helps filter out market influence.
Finally we look at the median gain/loss and look for statistical anomalies, like meteoric gains/loss in one year. Here are top 5 performing groups based on average return.
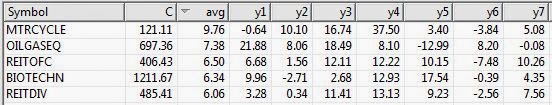
Average return alone is misleading. In the seasonal analysis we need consistent patterns in the price action throughout the periods we are testing, in this case 7 years. While The S & P 500 Motorcycle manufacturers group (MTRCYCLE) looks good on average, it includes one stellar July of 37.50% back in 2010, and has 2 July’s that were negative returns. NOTE: there’s only one stock in the group (guess which one that is!).
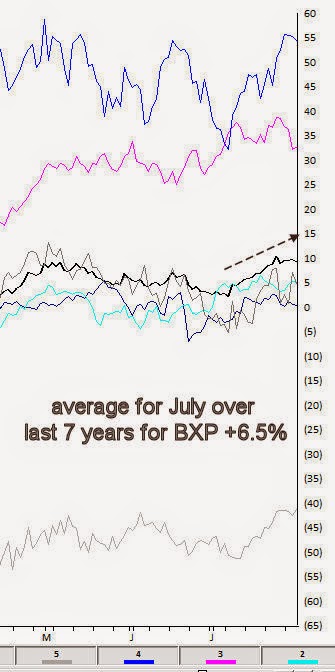
The office REITs group (REITOFC) is more consistent. It has an average return for the last 7 years in July of 6.50%, with the last 6 years Julys all positive. There are no stellar months skewing the average. The group also contains only one stock, Boston Properties [BXP].
Here’s the seasonal chart for BXP
Interestingly the other consistent group in July is another REIT, the Diversified REITs (REITDIV). It has an average return for the last 7 years in July of 6.06%, with the last 6 years Julys all positive. There are no stellar months skewing the average. The group also contains only one stock, Vonando Realty Trust [VNO].
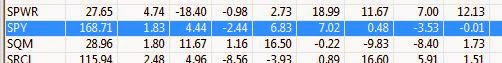
A quick check on what the market did during the same period reveals an average return of 1.83% with 4 gaining Julys and 3 losing Julys.