The AIQ code and EDS file based on Charlotte Hudgin’s article in the September 2014 Stocks & Commodities issue, “Finding The Golden Triangle,” is provided at www.TradersEdgeSystems.com/traderstips.htm, and is shown below.
I created an indicator I named the clear value indicator (“ClearValueSum” and “ClearValueAvg”) that might be used to rank signals. The “ClearValueSum” indicator sums the daily percentages that the close is above the simple moving average (SMA). The summing starts at the last cross up and goes to the current bar. If the close is below the SMA, then the value of the indicator is zero.
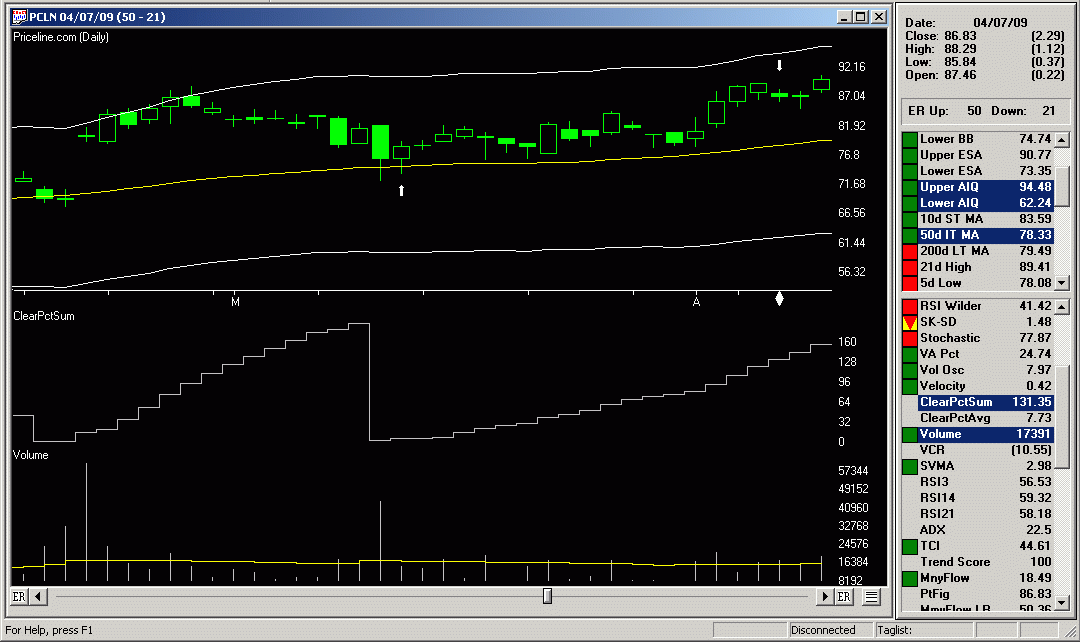
In Figure 7, I show a chart of Priceline (PCLN) with the ClearVauleSum indicator in the subgraph. In addition, I provide the code for the golden triangle setup and confirmation.
The author did not discuss exits, so I provided one based on a cross under the SMA or an exit after a maximum-bars-to-hold input (“maxBarsToHold”).


I ran a short optimization on the “maxBarsToHold” input, the results of which are shown in the table in Figure 8. Most of the metrics are best at the 18-bar setting. In Figure 7, I also show a sample trade from the system from 2009 with the 18-bar setting.
!FINDING THE GOLDEN TRIANGLE
!Author: Charlotte Hudgin, TASC Sept 2014
!Coded by: Richard Denning 7/10/2014
!www.TradersEdgeSystems.com

!INPUTS:
 smaLen is 50.        !moving average length
 periods is 252.      !Total look back period
 strength is 4.       !Number of bars on each side of pivot
 maxBarsToHold is 18. !max bars to hold position

!VARIABLES:
 C is [close].
 L is [low].
 V is [volume].
 OTD is offsettodate(month(),day(),year()).

!CLEAR VALUE INDICATOR:
 SMA is simpleavg(C,smaLen).
 Xup if C>SMA and (valrule(C<=SMA,1) or countof(L=1).
 XupDte is scanany(Xup,periods).
 XupOS is scanany(Xup,periods) then OTD.
 ClearPct is (C/SMA -1) * 100.
 ClearPctSum is iff(C>SMA,sum(ClearPct,^XupOS),0).
 ClearPctAvg is iff(C>SMA and ^XupOS>1,simpleavg(ClearPct,^XupOS),iff(ClearPct>0,ClearPct,0)).

!CODE TO FIND PIVOTS:
 LowR is LoVal([low],(2*strength)+1).
 LowM is Val([low],strength).
 LS if LowR = LowM.
 HighR is HiVal([high],(2*strength)+1).
 HighM is Val([high],strength).
 HS if  HighR = HighM.

   !FIND FIRST PIVOT LOW
      LT1 is scanany(LS,periods) then OTD .
       LO1 is ^LT1 + Strength.
     LO1dte is SetDate(LO1).
 LowLO1 is val([low],^LO1).

   !FIND FIRST PIVOT HIGH
      HT1 is scanany(HS,periods,0) then OTD .
       HO1 is ^HT1 + Strength.
 HO1dte is SetDate(HO1).
 HighHO1 is val([high],HO1).

!SYSTEM CODE:
 Xdn if [low]=SMA,1).
 XdnDte is scanany(Xdn,periods).
 XdnOS is scanany(Xdn,periods) then OTD.

 ShowValues if C > 5.
 HHVpivot if HighHO1 = hival([high],smaLen) and C > 5.
 Setup if Xdn and HHVpivot.
 PriceCnf if C>SMA.
 SetupOS is scanany(Setup,periods) then OTD.
 PriceCnfOS is scanany(PriceCnf,periods) then OTD.
 AvgV is simpleavg(V,smaLen).
 VolumeCnf if ^SetupOS<15 and="" ricecnfos="" setupos="" v="">avgV and V=highresult(V,^PriceCnfOS).

    !BUY & EXIT RULES (LONG ONLY):
 Buy if VolumeCnf and countof(Setup,15)=1 and countof(PriceCnf,15)>=1
  and countof(C>SMA,SetupOS+1)=SetupOS+1.
 Exit if C=maxBarsToHold.

