May 21, 2012 | Uncategorized
Complimentary access to Richard Muller’s Market Analysis at the Trading Prism webinar Wed May 23rd, 2pm eastern, 7pm London.
Currently Richard Muller is a Proprietary Trader, Senior Instructor at The Trading Prism, and former global equities analyst with Thomson Reuters, where he delivered investment ideas on the Reuters Insider financial TV channel.
Agenda
- Big picture market review of the S&P 500, Nasdaq Comp, and the Dow Jones Index. What the expert ratings are telling us of where the market might be heading next – FREE ACCESS
- Sector rotation review: A detail look at the sectors to spot the ones where there is strength, and weakness – SUBSCRIBER ACCESS ONLY
- Individual stock trading strategies discussed: A look at potential trade ideas to add to your watch list – SUBSCRIBER ACCESS ONLY
- Review of prior weeks potential trade ideas that we added to watch list – SUBSCRIBER ACCESS ONLY
Login information
http://connectpro39608568.adobeconnect.com/marketprism/
Click on this link and login as a guest at 7pm London, 2pm eastern.
May 9, 2012 | Uncategorized
If you attended Richard Muller’s May 9th session, we hoped you gained some insight into the market and possible stock and options setups. If you missed the session, don’t worry, Richard has made available the recording.
In this 70 minute session, Richard covered the big picture market review of the S&P 500, Nasdaq, and the Dow Jones Index. This was followed by Sector rotation review: A detail look at the sectors to spot the ones where there is strength, and weakness. Richard then identified individual stock and option trading ideas.
Click on this link to view the recording http://connectpro39608568.adobeconnect.com/p9dhqqg0sjw/
May 7, 2012 | Uncategorized
Steve Palmquist.
When the market is resting, like it did last week, I set up the alerts function that my broker provides to text my iPhone when the market moves either above or below the resting area. When I get the text message I look at the market to see if trading is warranted. In this case I was notified when the market made a move on Friday. I looked at the market chart on my iPhone, determined that no swing trades were warranted, because I was focused on longs and the market had moved down a bit. This process takes just a few minutes and can be done from almost anywhere; or with a brief break, in most any job. New traders often make this too hard, they want to watch the market all day, afraid they will miss something. Sending the alerts to a cell phone, for both stock triggers and key market levels, allows traders to work on other things and just take a look at the market when something interesting happens. If I am too busy to get to the computer I do not worry about it; any decent move does not require you to be in on the first day, almost by definition. All of my backtesting research for the trading tools I use, and the ones published in my books was done using end of day data; trades were entered at the open the day after the trigger. Again, this illustrates that one does not need to watch the market all day. In fact, it seems that the more people watch the market the worse they do. They start making emotional decisions rather than data based decisions. I am trading patterns in market environments in which they have demonstrated interesting results. There is no emotion in trading a pattern, it is either there or it is not. The stock has either moved above the trigger price, or it has not. The market is either in an appropriate environment for trading or it is not.
Trading should be data driven, not based on emotion, wishful thinking, or hot tips from TV hosts. To be data driven one needs to test and analyze trading tools and find out what really works, and when each tool should be used. Traders must understand which tool to use for a specific task, and have a clear understanding of how the tool works, and what can and cannot be done with it. I have extensively tested several trading systems, the results of this testing on specific trading trading tools are outlined in ‘How to Take Money from the Markets’, and Money-Making Candlestick Patterns. The testing process helps us understand how stocks usually behave after forming a specific pattern such as being outside the Bollinger Bands, showing strong distribution or accumulation, or pulling back or retracing during a trend. Understanding what a stock is most likely to do forms the beginning of a trading strategy. Trading without this information is taking unknown risks.
May 5, 2012 | Uncategorized
The AIQ code for Walid Khalil’s sentiment zone oscillator and related system from his article in this issue, “Sentiment Zone Oscillator,” is provided at www.TradersEdgeSystems.com/traderstips.htm.
Using the author’s system that is described in the article, I ran a test on the NASDAQ 100 list of stocks using the Portfolio Manager module. The following capitalization settings were used:
- Maximum of 10 open positions
- Size each position at 10% of mark-to-market total capital
- Take no more than three new positions per day
- Compute the mark-to-market capital each day
- Choose signals based on a relative strength indicator for ranking in descending order for longs.
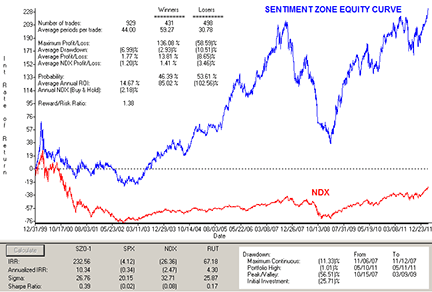
In Figure 9, I show the equity curve for long-only trading on the NASDAQ 100 list of stocks for the period 12/31/1999 to 3/16/2012. The return averaged 10.3% per year with a maximum drawdown of 56.5% on 3/9/2009. The trend filters that are applied to each stock in the system did not prevent the large drawdown during the two bear markets in the test period. Applying an index-based trend filter might improve the results, but I did not try this due to time constraints.
The code and EDS file can be downloaded from www.TradersEdgeSystems.com/traderstips.htm and is also shown here.
!SENTIMENT ZONE OSCILLATOR
!Author: Walid Khailil, TASC May 2012
!Coded by: Richard Denning 3/14/12
!www.TradersEdgeSystems.com

!ABBREVIATIONS:
C  is [close].
C1 is valresult(C,1).
H  is [high].
L  is [low].
O  is [open].
V is [volume].
avgV is expavg(V,50).
smaC is simpleavg(C,10).

!INPUTS:
szoLen is 14.   !SZO PARAMETER
trendEMAlen is 60.  !LENTH FOR TREND DETERMINATION
longLen is 30.  !LONG PERIOD SMOOTHING FOR SZO
percent is 95.  !PERCENTAGE OF RANGE
sellLevel is 7.
filter is 0.24.

!SZO OSCILLATOR:
R is iff(C > C1,1,-1).

rEMA is expavg(R,szoLen).
rTEMA is (3*rEMA) - (3*expavg(rEMA,szoLen))
 + (expavg(expavg(rEMA,szoLen),szoLen)).
SZO is 100*(rTEMA / szoLen).
szoHLP is highresult(SZO,longLen).
szoLLP is lowresult(SZO,longLen).
szoRng is szoHLP - szoLLP.
szoPctRng is szoRng * (percent/100).
szoOB is szoLLP + szoPctRng.
szoOS is szoHLP - szoPctRng.
szoMA is simpleavg(szo,longLen).
EMAtrend is expavg(C,trendEMAlen).

!SZO TRADING SYSTEM RULES:

!BUYING CONDITION RULES:
SZOmaXOzero if szoMA > filter
 and not valrule(szoMA > filter,1).
TrendUp if C > EMAtrend.
SZOovrSld if SZO < szoOS.
SZOmaUp if SZO > valresult(SZO,1).
SZOgtZero if SZO > 0.
SZOxoLLP if valrule(SZOovrSld,1) and not SZOovrSld.
EMAUp if EMAtrend > valresult(EMAtrend,1).

BuyCond1 if SZOmaXOzero and TrendUP.
BuyCond2 if TrendUp and SZOovrSld
 and szoMA > valresult(szoMA,1).
BuyCond3 if SZOgtZero and SZOxoLLP and EMAUp.

Buy if BuyCond1 or BuyCond2 or BuyCond3.

!SELLING CONDITION RULES:
SellCond1 if szoMA < -filter
 and not valrule(szoMA < -filter,1).
SellCond2 if szo < sellLevel
 and not valrule(szo < sellLevel,1)
 and szoMA < valresult(szoMA,1).

Sell if SellCond1 or SellCond2.

!RELATIVE STRENGTH UDF FOR SELECTING TRADES:
STL is 32. !RELATIVE STRENGTH LENGTH
Price1 is C. Price2 is C.
aL is STL * 0.25.
RC3 is (valresult(Price1,3*aL)/valresult(Price2,4*aL)-1)*100.
RC2 is (valresult(Price1,2*aL)/valresult(Price2,3*aL)-1)*100.
RC1 is (valresult(Price1,1*aL)/valresult(Price2,2*aL)-1)*100.
RC0 is (valresult(Price1,0*aL)/valresult(Price2,1*aL)-1)*100.
RS_AIQs is 0.4*RC0 + 0.2*RC1 + 0.2*RC2 + 0.2*RC3.

ShowValues if C > 0.
May 5, 2012 | Uncategorized
The AIQ code for Walid Khalil’s sentiment zone oscillator and related system from his article in this issue, “Sentiment Zone Oscillator,” is provided at www.TradersEdgeSystems.com/traderstips.htm.
Using the author’s system that is described in the article, I ran a test on the NASDAQ 100 list of stocks using the Portfolio Manager module. The following capitalization settings were used:
- Maximum of 10 open positions
- Size each position at 10% of mark-to-market total capital
- Take no more than three new positions per day
- Compute the mark-to-market capital each day
- Choose signals based on a relative strength indicator for ranking in descending order for longs.
In Figure 9, I show the equity curve for long-only trading on the NASDAQ 100 list of stocks for the period 12/31/1999 to 3/16/2012. The return averaged 10.3% per year with a maximum drawdown of 56.5% on 3/9/2009. The trend filters that are applied to each stock in the system did not prevent the large drawdown during the two bear markets in the test period. Applying an index-based trend filter might improve the results, but I did not try this due to time constraints.
The code and EDS file can be downloaded from www.TradersEdgeSystems.com/traderstips.htm and is also shown here.
!SENTIMENT ZONE OSCILLATOR
!Author: Walid Khailil, TASC May 2012
!Coded by: Richard Denning 3/14/12
!www.TradersEdgeSystems.com

!ABBREVIATIONS:
C  is [close].
C1 is valresult(C,1).
H  is [high].
L  is [low].
O  is [open].
V is [volume].
avgV is expavg(V,50).
smaC is simpleavg(C,10).

!INPUTS:
szoLen is 14.   !SZO PARAMETER
trendEMAlen is 60.  !LENTH FOR TREND DETERMINATION
longLen is 30.  !LONG PERIOD SMOOTHING FOR SZO
percent is 95.  !PERCENTAGE OF RANGE
sellLevel is 7.
filter is 0.24.

!SZO OSCILLATOR:
R is iff(C > C1,1,-1).

rEMA is expavg(R,szoLen).
rTEMA is (3*rEMA) - (3*expavg(rEMA,szoLen))
 + (expavg(expavg(rEMA,szoLen),szoLen)).
SZO is 100*(rTEMA / szoLen).
szoHLP is highresult(SZO,longLen).
szoLLP is lowresult(SZO,longLen).
szoRng is szoHLP - szoLLP.
szoPctRng is szoRng * (percent/100).
szoOB is szoLLP + szoPctRng.
szoOS is szoHLP - szoPctRng.
szoMA is simpleavg(szo,longLen).
EMAtrend is expavg(C,trendEMAlen).

!SZO TRADING SYSTEM RULES:

!BUYING CONDITION RULES:
SZOmaXOzero if szoMA > filter
 and not valrule(szoMA > filter,1).
TrendUp if C > EMAtrend.
SZOovrSld if SZO < szoOS.
SZOmaUp if SZO > valresult(SZO,1).
SZOgtZero if SZO > 0.
SZOxoLLP if valrule(SZOovrSld,1) and not SZOovrSld.
EMAUp if EMAtrend > valresult(EMAtrend,1).

BuyCond1 if SZOmaXOzero and TrendUP.
BuyCond2 if TrendUp and SZOovrSld
 and szoMA > valresult(szoMA,1).
BuyCond3 if SZOgtZero and SZOxoLLP and EMAUp.

Buy if BuyCond1 or BuyCond2 or BuyCond3.

!SELLING CONDITION RULES:
SellCond1 if szoMA < -filter
 and not valrule(szoMA < -filter,1).
SellCond2 if szo < sellLevel
 and not valrule(szo < sellLevel,1)
 and szoMA < valresult(szoMA,1).

Sell if SellCond1 or SellCond2.

!RELATIVE STRENGTH UDF FOR SELECTING TRADES:
STL is 32. !RELATIVE STRENGTH LENGTH
Price1 is C. Price2 is C.
aL is STL * 0.25.
RC3 is (valresult(Price1,3*aL)/valresult(Price2,4*aL)-1)*100.
RC2 is (valresult(Price1,2*aL)/valresult(Price2,3*aL)-1)*100.
RC1 is (valresult(Price1,1*aL)/valresult(Price2,2*aL)-1)*100.
RC0 is (valresult(Price1,0*aL)/valresult(Price2,1*aL)-1)*100.
RS_AIQs is 0.4*RC0 + 0.2*RC1 + 0.2*RC2 + 0.2*RC3.

ShowValues if C > 0.
May 1, 2012 | Uncategorized
Richard Muller, a longtime TradingExpert Pro client, former Reuters TV Equity Analyst and now senior instructor at The Trading Prism has made available the recording of his Tuesday May 1, 2012 webinar.
In this 80 minute session, Richard covered the big picture market review of the S&P 500, Nasdaq, and the Dow Jones Index. This was followed by Sector rotation review: A detail look at the sectors to spot the ones where there is strength, and weakness. Richard then identified 10 Individual stock and option trading ideas. Finally he reviewed AAPL and possible plays going forward.
Click on this link to view the recording http://connectpro39608568.adobeconnect.com/p4l7x9ye6m4/