NASDAQ Point & Figure November 26, 2012
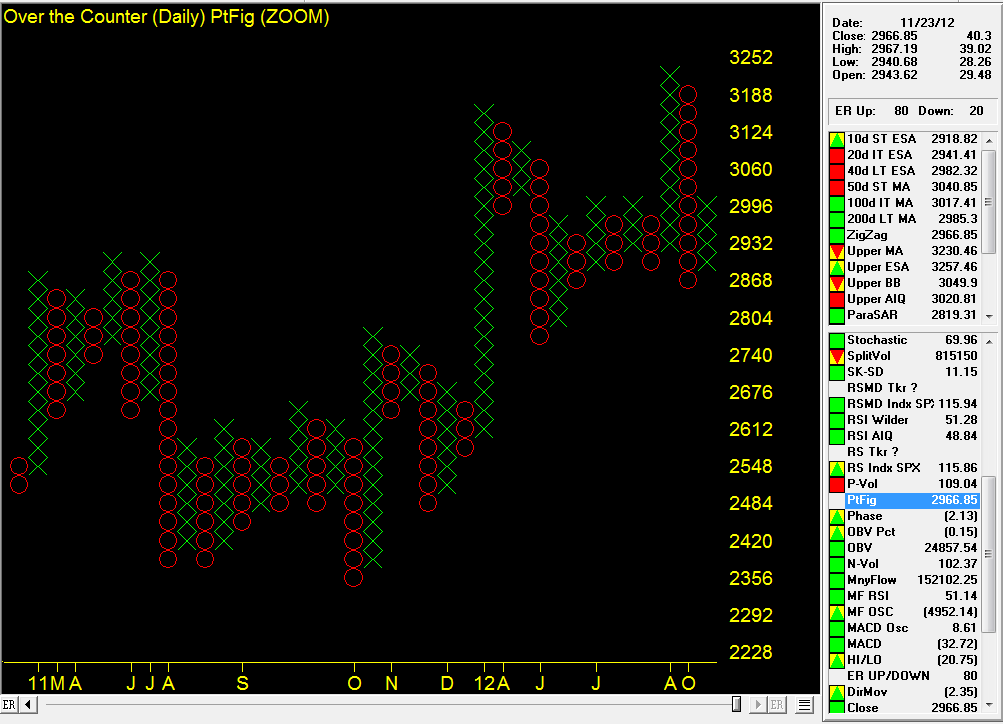
Point & Figure chart on the NASDAQ market made a key reversal to the upside on November 23, 2012

Point & Figure chart on the NASDAQ market made a key reversal to the upside on November 23, 2012
The AIQ code based on BC Low’s article in the November issue of Stocks & Commodities, “Identify The Start Of A Trend With DMI,” is provided at the following website: www.TradersEdgeSystems.com/traderstips.htm, and is shown below.
Several of the terms used by the author had to be interpreted to be converted into signal code such as, “cluster drifts down below level 30,” “converging,” “turning up,” and so on. My interpretation may differ from what the author intended, and other interpretations are possible. In addition, I had to come up with exits for the signals as none were given. In testing using the NASDAQ 100 list of stocks, the long-only system was profitable over the test period, whereas I could not get the short-only system to be profitable.
To test the author’s 3x DMI system, I used the NASDAQ 100 list of stocks and AIQ’s Portfolio Manager. A long-only trading simulation was run with the following capitalization, cost, and exit settings:
In Figure 8, I show the resulting statistics and long-only equity curve compared to the NASDAQ 100 index. For the period 12/31/1999 to 9/17/2012, the system returned an average internal rate of return of 20.7% with a maximum drawdown of 58.2% on 3/9/2009.
!INPUTS:
wLen is 14.
wLen3 is 3.
wLen4 is 4.
wLen5 is 5.
wLen8 is 8.
blvl is 30.
slvl is 70.
!CODING ABREVIATIONS:
H is [high].
L is [low].
C is [close].
C1 is valresult(C,1).
H1 is valresult(H,1).
L1 is valresult(L,1).
!NOTE: Wilder to expontential averaging the formula is:
! Wilder length * 2 – 1 = exponential averaging length
eLen is wLen * 2 – 1.
eLen3 is wLen3 * 2 – 1.
eLen4 is wLen4 * 2 – 1.
eLen5 is wLen5 * 2 – 1.
eLen8 is wLen8 * 2 – 1.
!AVERAGE TRUE RANGE:
TR is Max(H-L,max(abs(C1-L),abs(C1-H))).
ATR is expAvg(TR,eLen).
ATR3 is expAvg(TR,eLen3).
ATR4 is expAvg(TR,eLen4).
ATR5 is expAvg(TR,eLen5).
ATR8 is expAvg(TR,eLen8).
!+DM -DM CODE:
rhigh is (H-H1).
rlow is (L1-L).
DMplus is iff(rhigh > 0 and rhigh > rlow, rhigh, 0).
DMminus is iff(rlow > 0 and rlow >= rhigh, rlow, 0).
AvgPlusDM is expAvg(DMplus,eLen).
AvgPlusDM3 is expAvg(DMplus,eLen3).
AvgPlusDM4 is expAvg(DMplus,eLen4).
AvgPlusDM5 is expAvg(DMplus,eLen5).
AvgPlusDM8 is expAvg(DMplus,eLen8).
AvgMinusDM is expavg(DMminus,eLen).
AvgMinusDM3 is expavg(DMminus,eLen3).
AvgMinusDM4 is expavg(DMminus,eLen4).
AvgMinusDM5 is expavg(DMminus,eLen5).
AvgMinusDM8 is expavg(DMminus,eLen8).
!DMI CODE:
PlusDMI is (AvgPlusDM/ATR)*100.
PlusDMI3 is (AvgPlusDM3/ATR)*100.
PlusDMI4 is (AvgPlusDM4/ATR)*100.
PlusDMI5 is (AvgPlusDM5/ATR)*100.
PlusDMI8 is (AvgPlusDM8/ATR)*100.
MinusDMI is AvgMinusDM/ATR*100.
MinusDMI3 is AvgMinusDM3/ATR*100.
MinusDMI4 is AvgMinusDM4/ATR*100.
MinusDMI5 is AvgMinusDM5/ATR*100.
MinusDMI8 is AvgMinusDM8/ATR*100.
!ADX INDICATOR as defined by Wells Wilder
DIdiff is PlusDMI-MinusDMI.
ZERO if PlusDMI = 0 and MinusDMI =0.
DIsum is PlusDMI+MinusDMI.
DX is iff(ZERO,100,abs(DIdiff)/DIsum*100).
ADX is ExpAvg(DX,eLen).
DIdiff3 is PlusDMI3-MinusDMI3.
ZERO3 if PlusDMI3 = 0 and MinusDMI3 =0.
DIsum3 is PlusDMI3+MinusDMI3.
DX3 is iff(ZERO3,100,abs(DIdiff3)/DIsum3*100).
ADX3 is ExpAvg(DX3,eLen3).
DIdiff4 is PlusDMI4-MinusDMI4.
ZERO4 if PlusDMI4 = 0 and MinusDMI4 =0.
DIsum4 is PlusDMI4+MinusDMI4.
DX4 is iff(ZERO4,100,abs(DIdiff4)/DIsum4*100).
ADX4 is ExpAvg(DX4,eLen4).
DIdiff5 is PlusDMI5-MinusDMI5.
ZERO5 if PlusDMI5 = 0 and MinusDMI5 =0.
DIsum5 is PlusDMI5+MinusDMI5.
DX5 is iff(ZERO5,100,abs(DIdiff5)/DIsum5*100).
ADX5 is ExpAvg(DX5,eLen5).
!TRADING SYSTEM CODE:
Converge if (ADX3 < ADX4 Or ADX3 < ADX5) and ADX4 < ADX5.
Below if ADX3 < blvl And ADX4 < blvl And ADX5 < blvl.
TurnUp if ADX3 > ADX4 And ADX3 > ADX5 And ADX4 > ADX5.
Peak if (ADX3 > ADX4 Or ADX3 > ADX5) And ADX4 > ADX5.
Above if ADX3 > slvl And ADX4 > slvl And ADX5 > slvl.
TurnDn if ADX3 < ADX4 And ADX3 < ADX5 And ADX4 < ADX5.
PlusBottom if PlusDMI5 <= 5 And PlusDMI8 <= 10 And PlusDMI <= 10.
AbovePlus if ADX3 > Min(slvl+20,90).
PlusUp if PlusDMI5 > PlusDMI8 And PlusDMI5 > PlusDMI And PlusDMI8 > PlusDMI.
MinusBottom if MinusDMI5 <= 5 And MinusDMI8 <= 10 And MinusDMI <= 10.
MinusUp if MinusDMI5 > MinusDMI8 And MinusDMI5 > MinusDMI And MinusDMI8 > MinusDMI.
BuySig1 if countof(Below,5,0)>=1 And countof(Converge,5,0)>=1 And TurnUp.
SellSig2 if countof(Above,5,0)>=1 And countof(Peak,5,0)>=1 And TurnDn.
BuySig3 if countof(PlusBottom,5,0)>=1 And countof(AbovePlus,5,0)>=1 And TurnDn And PlusUp.
SellSig4 if countof(MinusBottom,5,0)>=1 And countof(AbovePlus,5,0)>=1 And TurnDn And MinusUp.
Buy if BuySig1 or BuySig3.
Sell if SellSig2 or SellSig4.
The AIQ code and EDS file for Gerald Gardner’s article in October 2012 Stocks and Commodities, “A Seasonal Strategy With Leveraged ETFs,” is provided at the following website: www.TradersEdgeSystems.com/traderstips.htm.
To test Gardner’s seasonal system with the leveraged exchanged traded funds (ETFs) DBC and DDM using AIQ’s Portfolio Manager, a trading simulation was run with the following capitalization and cost settings:
In Figure 7, I show the resulting statistics and equity curve compared to the S&P 500 index (SPX). For the period 9/1/2006 to 8/13/2012, the system returned an average internal rate of return of 13.7% with a maximum drawdown of 32% on 3/5/2009. These statistics differ from the author’s due to my test starting earlier, and also, I picked up three trades that the author did not show in his list of trades with returns of -15.4%, -8.0%, and 1.0%. These differences may be due to differences in our data. In my test, there were only 12 trades and I would like to see more trades before I would rely on this as a trading strategy. This is the problem with testing systems on ETFs — there is not enough data.
! ABBREVIATIONS:
C is [close].
C1 is valresult(C,1).
O is [open].
H is [high].
H1 is valresult(H,1).
L is [low].
L1 is valresult(L,1).
V is [volume].
PEP is {position entry price}.
PD is {position days}.
OSD is offsettodate(month(),day(),year()).
! UDFs AND RULES FOR STRATEGY:
SMA50 is simpleavg(C,50).
OK_BUY if (month() >= 1 and month() <= 4)
or (month() >= 10 and month() <=12).
BUY if OK_BUY and C > SMA50.
SELL if month() = 5.
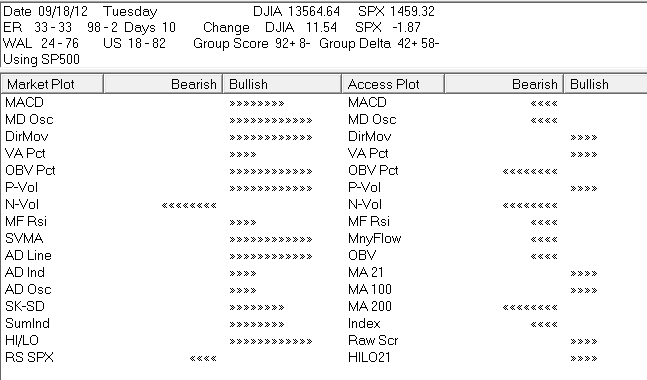
The last market Expert Rating 10 days ago was 98-2. WAL (Weighted Action List) and the US (Unconfirmed SIgnals) show a different picture. The WAL analyzes all the high up and down Expert Ratings on the S&P500 that have been confirmed by an independent indicator, in this case the Phase (MACD based). For the 500 stocks analyzed, 24% have ratings to the upside and 76% to downside.
Interstingly the US shows a similar picture 18% have ratings to the upside and 82% to downside. The US is a raw picture of the percenatge of stocks in S&P500 with unconfirmed up vs down high Expert Ratings. Past analysis has shown this US balance is an early indication of a possible change when the balance reaches 15-85 or 85-15.
Couple of chart patterns appeared in the Chart Pattern EDS report for 9-17-2012.
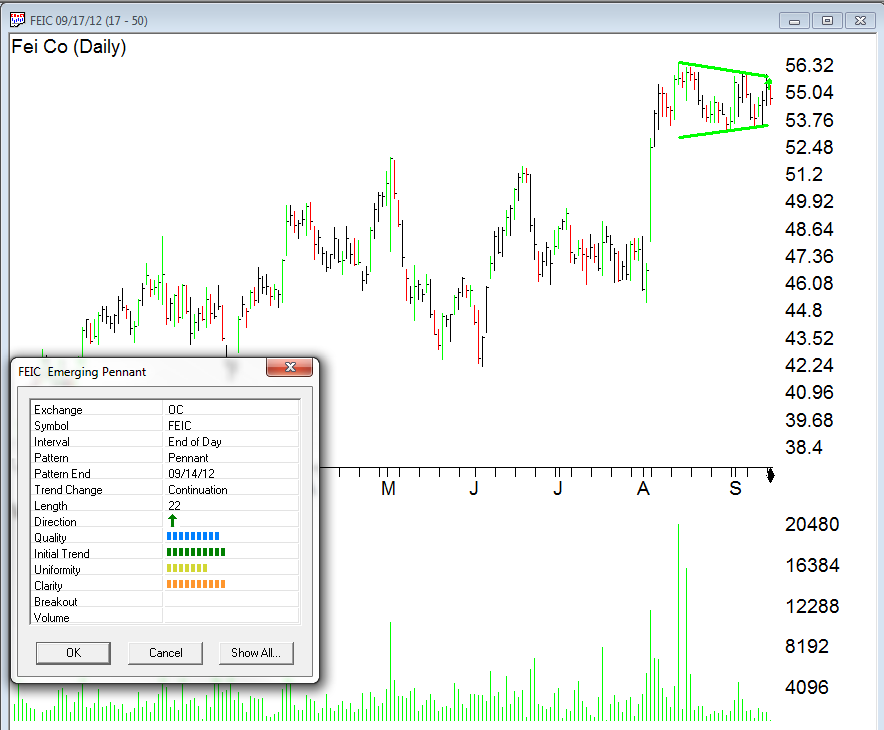
FEIC had a sharp move up at the beginning of August and has since been forming a pennant pattern. The clarity, quality and initial trend for the pattern are very good. The length of the pennant part of the pattern is getting a little long in the tooth but still could resolve. Usually pennants are completed with a breakout to the upside through the upper trendline followed by an increase in volume.
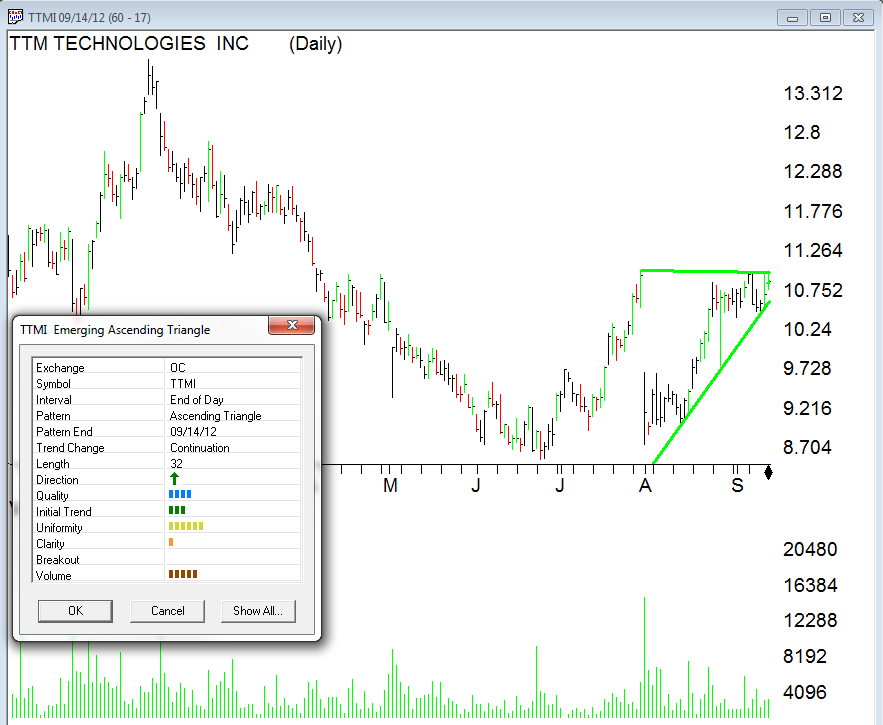
TTMI has a nice ascending triangle forming, the stock closed at 10.7 today and is still within the triangle. Diminishing volume is typical of this pattern. Breakout occurs usually to the upside through the horizontal trendline and needs to happen with good volume.
More information on Chart Pattern Recognition in TradingExpert Pro can be found at http://www.aiqsystems.com/chartpatterns.htm