Dec 28, 2012 | Uncategorized
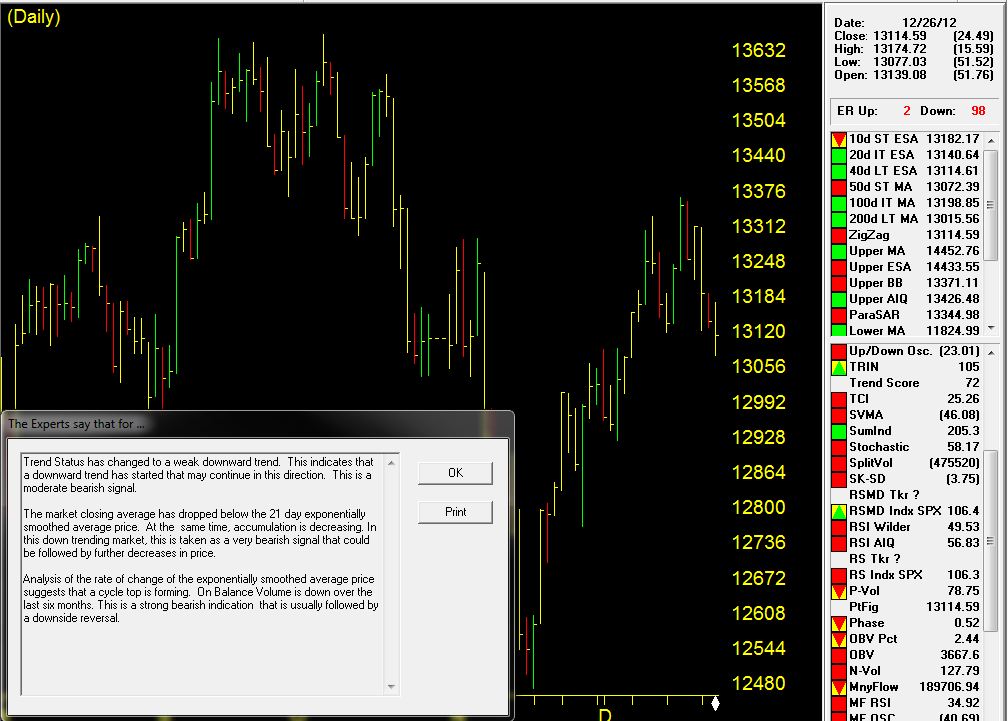
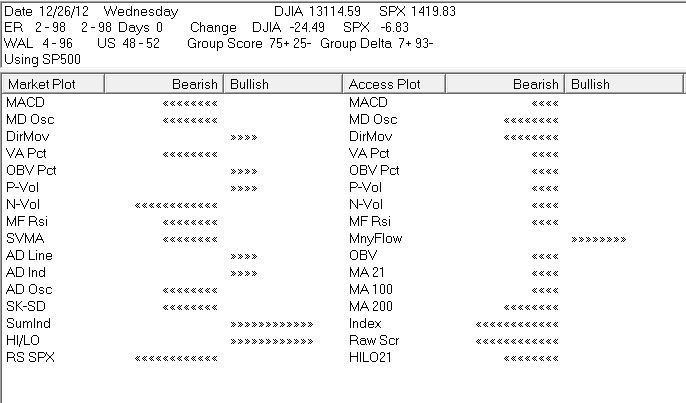
The Weighted Action List (WAL) a measure of tickers in the SP500 receiving confirmed Expert Ratings, is to the downside at 4-96. The Access Plot, a measure of the bullish/bearish for the sum of all SP500 stocks has only Moneyflow indicator in bullish territory.
We do not warrant, endorse or guarantee the completeness, accuracy, integrity or timelines of the information in this post. You must evaluate, and bear all risks associated with, the use of any information provided hereunder, including any reliance on the accuracy, completeness, safety or usefulness of such information. This information is not intended to be used as the primary basis of investment decisions. It should not be construed as financial or other advice or as an offer to sell or the solicitation of an offer to buy any security.
Dec 28, 2012 | Uncategorized
The Weighted Action List (WAL) a measure of tickers in the SP500 receiving confirmed Expert Ratings, is to the downside at 4-96. The Access Plot, a measure of the bullish/bearish for the sum of all SP500 stocks has only Moneyflow indicator in bullish territory.
We do not warrant, endorse or guarantee the completeness, accuracy, integrity or timelines of the information in this post. You must evaluate, and bear all risks associated with, the use of any information provided hereunder, including any reliance on the accuracy, completeness, safety or usefulness of such information. This information is not intended to be used as the primary basis of investment decisions. It should not be construed as financial or other advice or as an offer to sell or the solicitation of an offer to buy any security.
Dec 27, 2012 | Uncategorized
|
UNTIL 12/31/2012
DON’T MISS OUT
AIQ Education Holiday Sale
Prices starting at just $3.95
Dale Wheatley option course on 4 DVDs –
The Secret to Extraordinary Wealth in the Options Market
When Dale spoke to the attendees, everyone’s full undivided attention was set on him. He revealed his system that utilizes the power of the MACD (Moving Average Convergence Divergence) indicator, which is the only indicator he uses and swears by because of its astounding results with less risk. As he cuts right to the chase, he laid out the charts and let the simple rules demonstrate how it works and what it is capable of doing for the traders in the room
$995
$179

New Money-Making Trading Systems: Advanced Results from 6 Simple, Proven Strategies – Steve Palmquist
Long-term trading success is achieved using strategies that provide traders with an edge. But how can you prove that a system will show winning trades more often than random chance? You have to put it to the test. Don’t make costly mistakes by following the latest trading system blindly. Let Steve’s experience and expertise work for you. In this DVD course, he will not only provide you with six new powerful trading strategies, but he will show you exactly how to use each one to maximize profits.
$795
$149
|
Dec 12, 2012 | Uncategorized
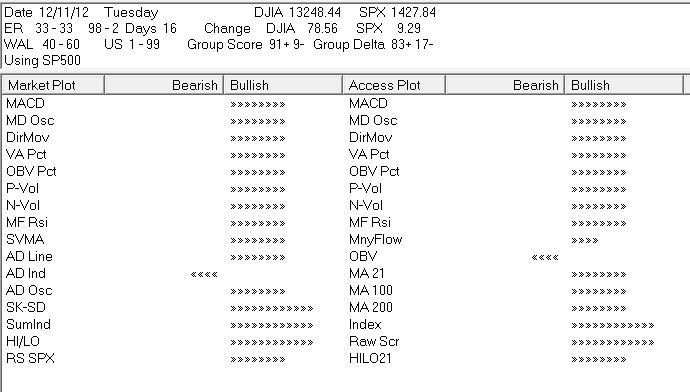
The cluster of Expert Ratings to the upside starting November 16th, right at the cusp of an 8% correction in the Dow 30 Index have born fruit. Almost 2/3rds of the correction has now been erased. Despite warning signs in the AIQ Market Log of a huge inbalance of unconfirmed ratings to the downside (US 1-99, see below), the market continues to drift higher.
Other points to note.
The US 1-99 rating is based on the component stocks of the S and P 500. 99% of the stocks that received an unconfirmed Expert Rating were to the downside.
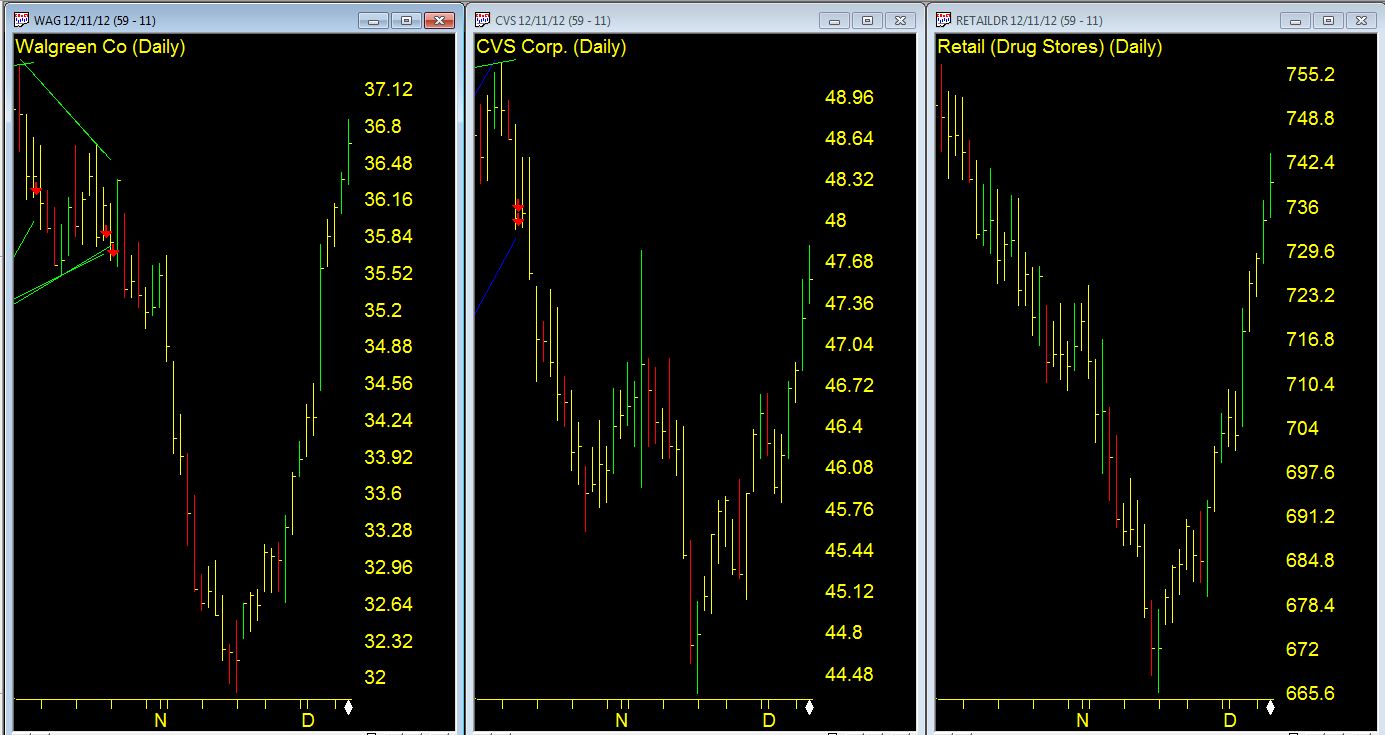
The group/sector analysis reveals the majority of groups are still trending up and the trend is continuing.
Leading groups like Retail (Drug Stores) are up over 10% from the November low.
We do not warrant, endorse or guarantee the completeness, accuracy, integrity or timelines of the information in this post. You must evaluate, and bear all risks associated with, the use of any information provided hereunder, including any reliance on the accuracy, completeness, safety or usefulness of such information. This information is not intended to be used as the primary basis of investment decisions. It should not be construed as financial or other advice or as an offer to sell or the solicitation of an offer to buy any security.
Nov 27, 2012 | Uncategorized
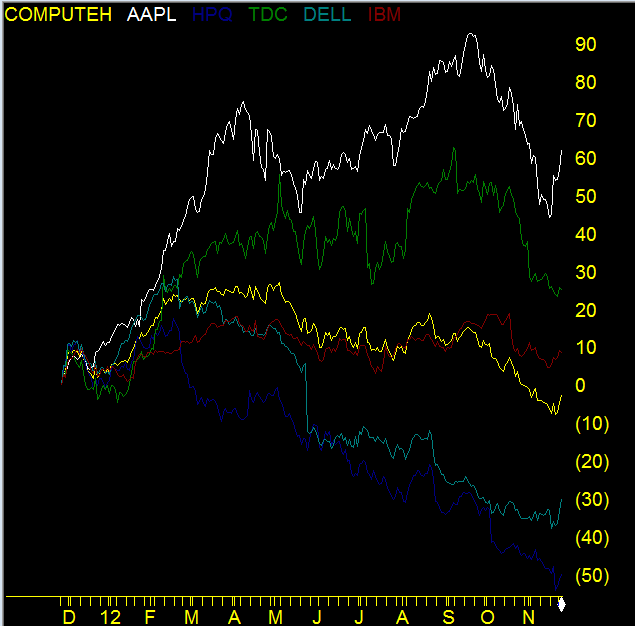
The ever changing landscape in computer technology hardware makes for a rough ride for some tech stocks. Take a look at this one year comparison chart of the S & P 500 Computer Hardware Group (yellow). The display shows the percentage change starting from one year ago. It’s down 3-4 %.
The component stocks tell a mixed tale. Apple (white) despite the recent pullback is still up over 60% from a year ago. Terradata (green) is also fairing well up around 25% and even IBM (red) is up near 10%. IBM and Terradata make a a good deal of profit from non-hardware sources.
The reason the group is down overall is a reflection of the poor performance of the 2 heavyweight PC goliaths, Dell and Hewlett Packard. Dell (light green) is down nearly 30% and HPQ (blue) down 50%. The 2 year comparison chart (not displayed here) shows HPQ down 70%, as the worse performer, with AAPL up 90% as the best performer in the group.
Nov 26, 2012 | Uncategorized
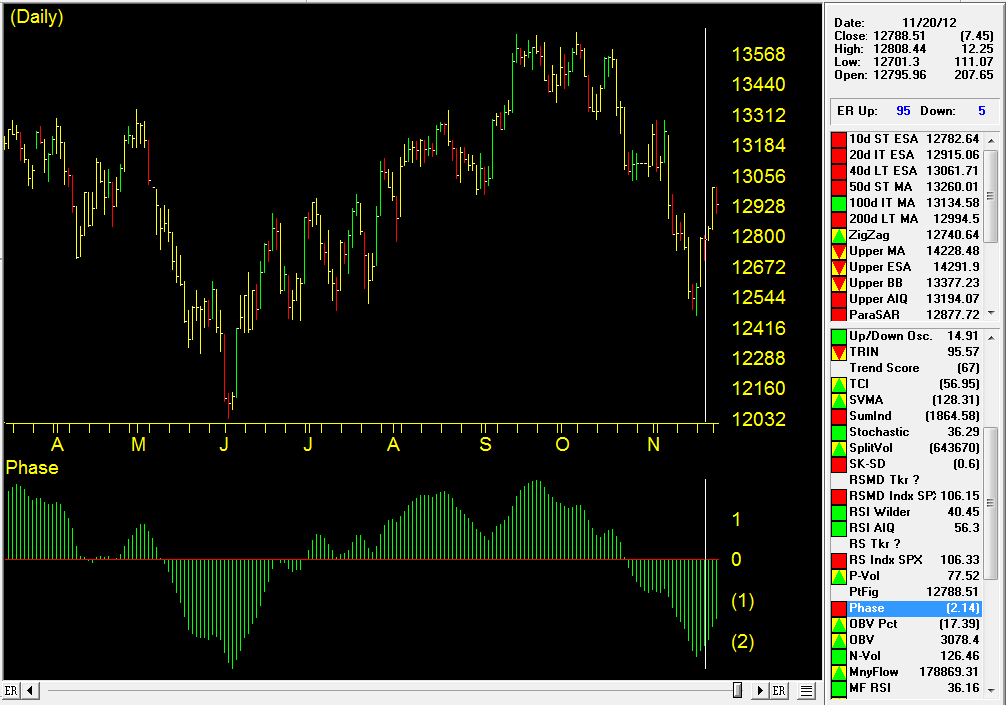
The AIQ Expert rating fired on the Dow Jones on November 20th, it was a confirmed signal as measured by the Phase indicator. So far so good. I would be looking at call options on the index from here into the year end rally. Q1 call options would have enough time value. So far so good.
Richard Muller