42 year log chart of the Dow
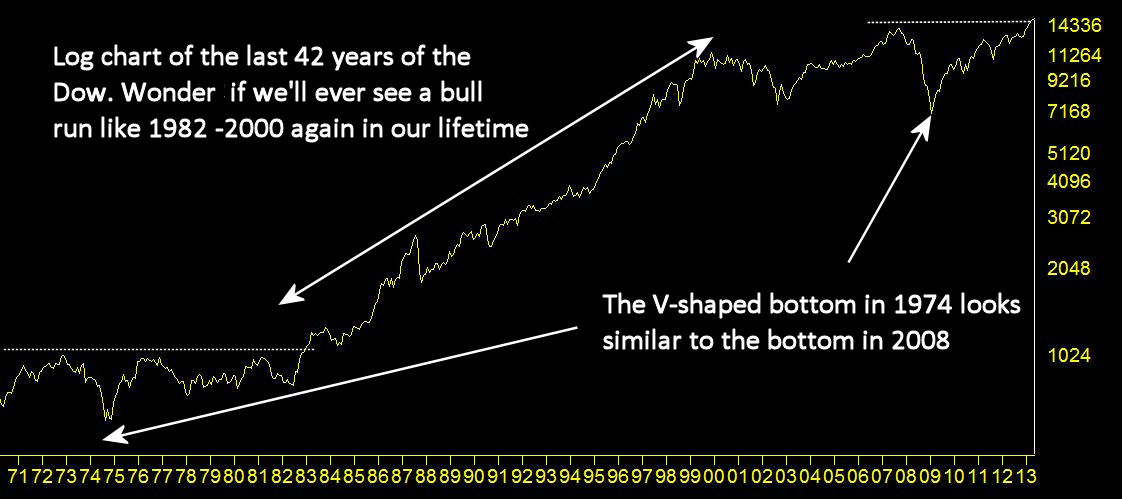

| by Hank Swiencinski, AIQ TradingExpert Pro client for over 20 years, founder of ‘The Professor’s One Minute Guide to Stock Management’. DON’T MISS OUT, AIQ and The Professor are coming to New York…. LEARN MORE “With the Dow up over 130 points, The Professor proves to be yet another valuable tool for short-term traders. Two days ago The Professor had 55 new longs, confirming the two VIX Buy Signals. Then last night, he maintained his positive bias with 21 new longs and only 3 shorts. So today, we’re up 130 points. Pretty cool, huh?” “Anyhow I thought I would remind you that odds are that we’re still in a triangle, and the top should be near the 14,800+ level. We’re at 14, 706 as I write this. In other words, IF you took advantage of the DDM trade I mentioned yesterday, you might want to manage your money as we start to approach these higher levels. I’m starting to take profits NOW! Remember, no stock, no matter how good, goes to heaven. And this applies even more so when we’re in a triangle.” “The 11:00am run of The Professor shows that the number of new longs has increased to 30. This tells me that we should see the Dow trading close to the 14, 800+ level before the next leg down starts to develop. In other words, I expect more upside in the next few days, but to get there, we should expect some very choppy trading. Because of this, I’m gonna take a few bucks off the table, and leave some on to see if we can approach 14,800 as this leg completes.” “Managing my money, TWID, h “ |
| All of the commentary expressed in this site and any attachments are opinions of the author, subject to change, and provided for educational purposes only. Nothing in this commentary or any attachments should be considered as trading advice. Trading any financial instrument is RISKY and may result in loss of capital including loss of principal. Past performance is not indicative of future results. Always understand the RISK before you trade. |
The AIQ code for finding head & shoulders (H&S) patterns based on Giorgos Siligardos’ article in the May issue of Stocks & Commodities, “Head & Shoulders, Algorithmically (Part 2),” is provided at the following website: www.TradersEdgeSystems.com/traderstips.htm.
I did not directly translate the code given in Siligardos’ article into AIQ EDS code because the AIQ program has chart pattern recognition built in. The code I am providing will find H&S patterns — as well as many other patterns — for either completed or emerging patterns.
In Figure 5, I show an example of a completed H&S topping pattern with the sell signal (red down arrow). The bars after the signal indicate that this trade was immediately profitable. In Figure 2, I show an example of a completed inverse H&S bottoming pattern with a buy signal (red up arrow). The bars after the signal indicate that this trade was immediately profitable.
The code and EDS file can be downloaded from www.TradersEdgeSystems.com/traderstips.htm, and is shown below.
!DETECTING HEAD & SHOULDERS ALGORITHMICALLY
!Author: Giorgos E. Siligardos TASC May 2013
!Coded by: Richard Denning 3/17/2013
!USER DEFINED FUNCTIONS:
C is [close].
Name is description().
!COMPLETED HEAD & SHOULDERS PATTERN-TOPPING:
HS is [Head and Shoulders].
HS_breakoutup if HS > 0.
HS_breakoutdn if HS < 0.
!COMPLETED HEAD & SHOULDERS PATTERN-INVERTED:
iHS is [Inv Head and Shoulders].
iHS_breakoutup if iHS > 0.
iHS_breakoutdn if iHS < 0.
!EMERGING HEAD & SHOULDERS PATTERN-TOPPING:
e_HS is [eHead and Shoulders].
e_HSemerge if e_HS > 0 or e_HS < 0.
!EMERGING HEAD & SHOULDERS PATTERN-INVERTED:
e_iHS is [eInv Head and Shoulders].
e_iHSemerge if e_iHS > 0 or e_iHS < 0.
!REPORTS TO LIST ALL HEAD & SHOULDERS PATTERS:
ShowAll if C>0 and (HS <> 0 or iHS <> 0
or e_HS <> 0 or e_iHS <>0).
For the last few years, traders and investors in Jacksonville, Florida have had legendary trader and AIQ TradingEpert Pro client, Hank Swiencinski all to themselves. No longer.
The Professor, as he is known by his clients, will be joining Steve Hill in New York to present “The Professor’s One Minute Guide to Stock Management” in person in one action packed 4 hour seminar.
This remarkable course is usually taught in four sessions of 2 hours, and only recently been available outside the walls of the University of Northern Florida in Jacksonville, FL.
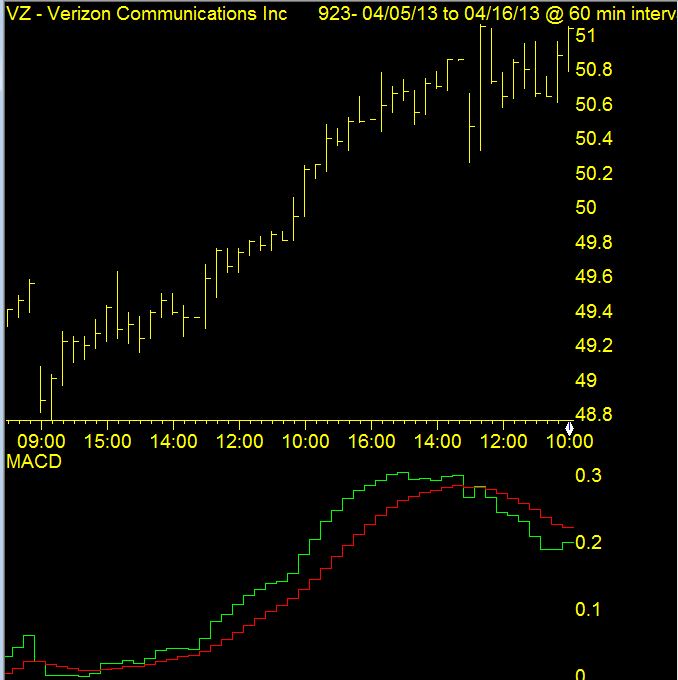
MACD divergence is a tried and tested technical tool. If you look at the daily price chart of Verizon below, you can clearly see the recent high on 4-12-2013. Note the MACD is well below the indicator peak back in the middle of March.

MACD divergence is a tried and tested technical tool. If you look at the daily price chart of Verizon below, you can clearly see the recent high on 4-12-2013. Note the MACD is well below the indicator peak back in the middle of March.