Jul 2, 2013 | Uncategorized
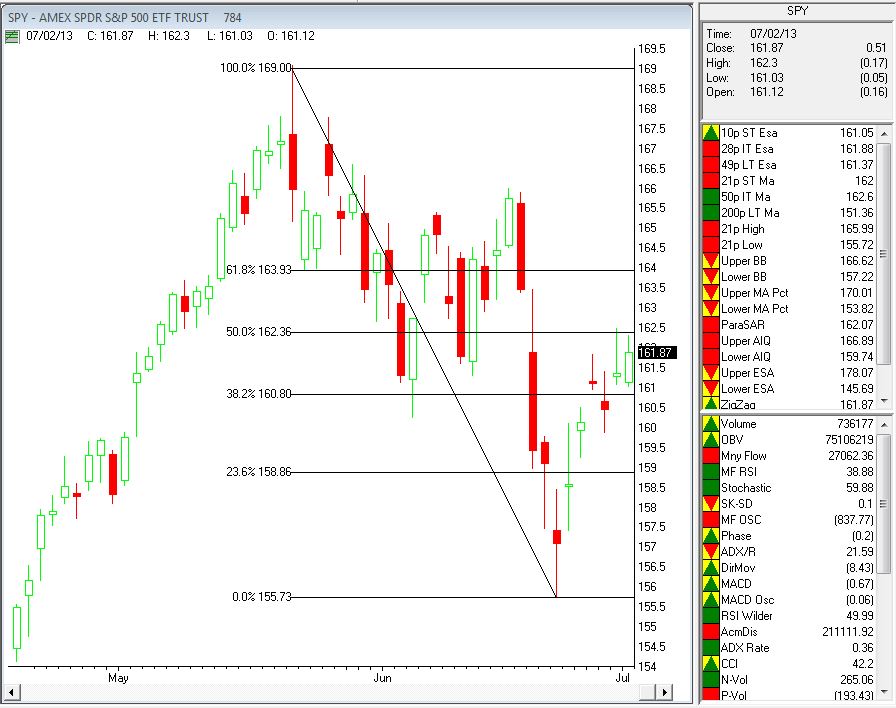
One of my favorite chart tools is Fibonacci Retracements. I find it really useful on retracements both from a high and from a low point.
Here’s what I mean on the SPY July 2, 2013 chart below.
I’ve run the retracement from the high of May 20, 2013 to the recent low on June 24, 2013. The levels generated provide possible resistance levels to the rally from the low. I find the 50% and 61.8% levels most useful. In this example the market is struggling to break through the 50% retracement of this down move at around $162.5. If it does break out, the next level of resistance is at 61.8% or when SPY is around $164. if the rally fails at the 50% retracement then I consider the retracement pattern completed.
Incidentally, I drew this retracement 2 days after the low on June 24, 2013.
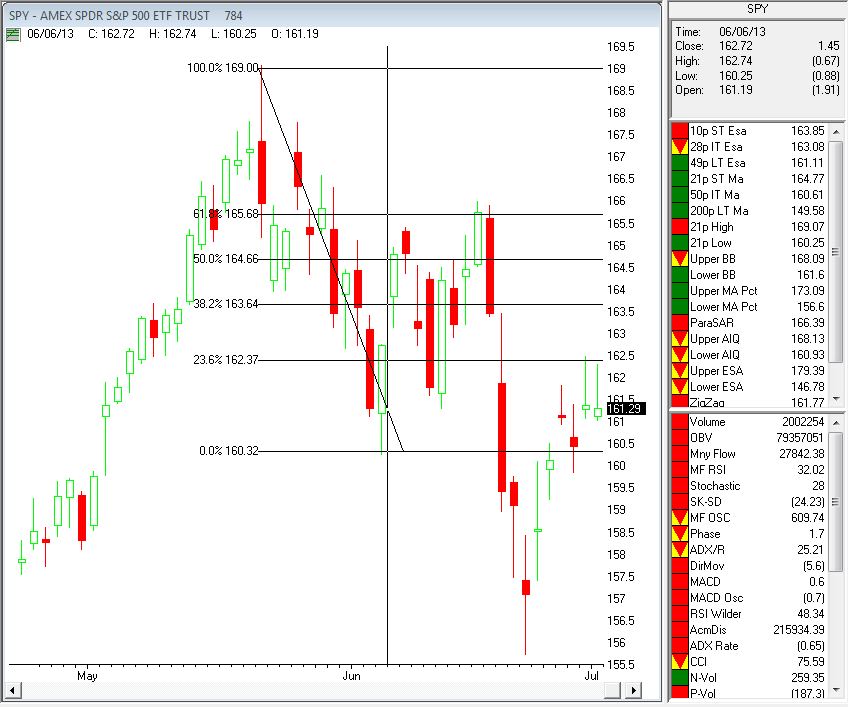
This was not the first Fibonacci Retracement I’ve drawn since the high of May 20, 2013. On June 6, 2013 when prices reached a low of $160.25 and rallied up from there. I drew the Fibonacci Retracements from the high of May 20, 2013 to the low of June 6, 2013. In this instance, as you can see in the chart below, the SPY struggled with the 61.8% retracement, before falling away. Again once the prices fall away from the retracement level, I consider that pattern over.
Jun 29, 2013 | Uncategorized
Original article by Marsha Stokes
AIQ Code by Richard Denning
For this month’s Stocks and Commodities issue, I did not do the selected article on the step candle pattern, but instead I provide code for an indicator discussed in the Bonus Issue 2013 article, “Balancing Your Indicators”, by Martha Stokes.
In the article, the author discusses several indicators but focuses on the price versus volume rate of change. She suggests that we use these two to find divergences in price versus volume changes. She does not give specific formulas or describe how the indicators should be constructed nor how the diverge could be mechanized. She only shows examples of the indicators and gives interpretations on one stock.
To code the indicators, I used linear regression (LR) of the price compared to linear regression of the volume. We need to get the rate of change of each in order to normalize so that we can compare and get the divergence. I get the LR rate of change of each indicator by using the end points of the LR line (end point divided by beginning point -1). I use the slope to be sure the sign is correct. In other words if the linear regression slope is positive, then the rate of change must be positive. If negative then it must be negative. Next I get the standard deviation (STD) of the difference (DIFF) between the LR percent rate of change of volume minus the LR percent rate of change of price. By then dividing the current DIFF by the STD, I get a measure of how much divergence is currently happening. When the divergence exceeds the input value, buy and sell signals can be generated.
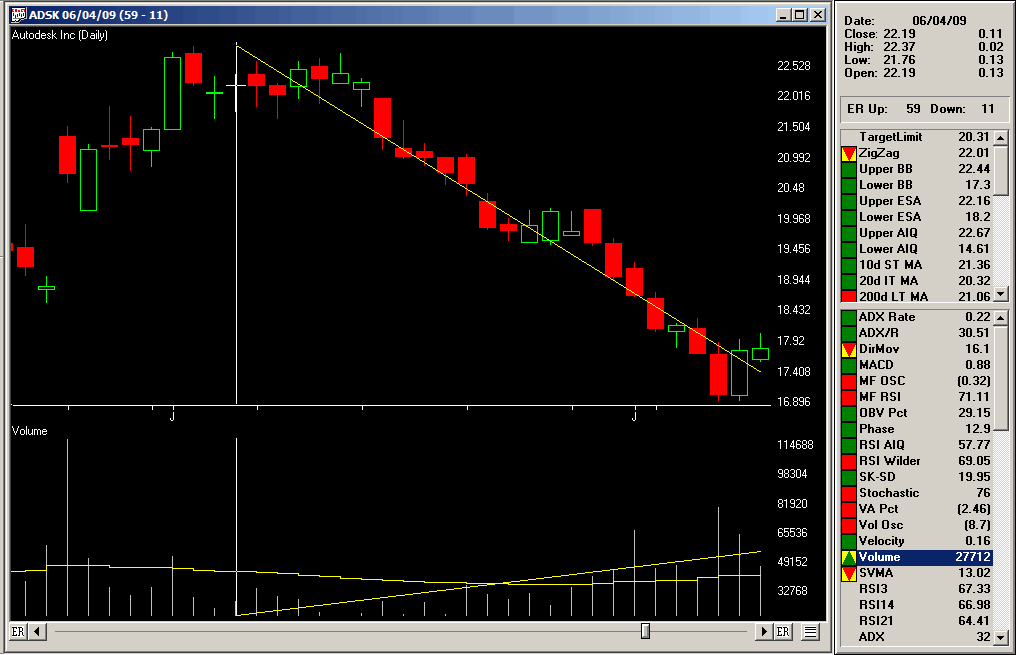
Chart of ADSK on date of positive divergence signal (7/9/09) with LR lines on price and volume.
The chart of ADSK with the linear regression lines drawn in on the price and the volume. We see that price has a negative rate of change and volume has a positive rate of change. The divergence indicator exceeded the 2 STD positive level on 7/9/09 for a buy signal. Holding for 10 trading days the trade generated a profit of 23.69%.
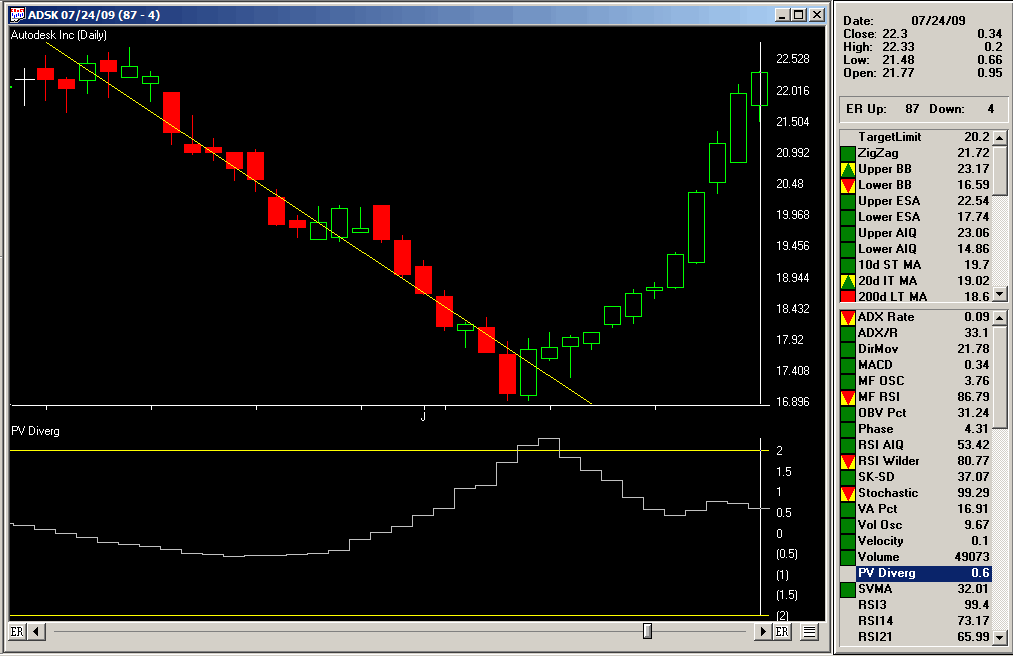
Chart of ADSK on date of trade exit (7/24/09) with divergence indicator and the 2 STD signal lines. When the indicator crossed above the upper signal line on 7/9/09, a buy signal is indicated. This trade was entered on 7/10/09 at the open and exited on 7/24/09 at the open.
In this chart I show the divergence indicator on ADSK with the date shifted to the exit date. I picked this trade because it was a clear example of how the indicator can work, however there were many other trades that did not work as well as this one. The code provided is not meant to be a complete trading system as it lacks exits rules and position sizing. More testing should be done to determine the appropriate inputs, etc.
The AIQ EDS code is below
!APPLYING QUANTITY AND TIME INDICATORS
!Substituted for the July 2013 Traders’ Tips Article
!Author: Martha Stokes, TASC Bonus Issue 2013
!Coded by: Richard Denning 5/12/13
!INPUTS:
ROCLEN is 24.
MYINDICATOR1 is [volume].
MYINDICATOR2 is [close].
STDLEN is 200.
DEVIATION_STD_MULT is 2.
!LINEAR REGRESSION RATE OF CHANGE INDICATOR1 (VOLUME):
!GET SLOPE AND INTERCEPT OF LINEAR REGRESSION LINE 1:
b is slope2(MYINDICATOR1,ROCLEN).
intercept is sum(MYINDICATOR1,ROCLEN)/
ROCLEN – (b * (ROCLEN + 1) / 2).
!END POINT OF LINEAR REGRESSION LINE 1:
LRV is intercept + (ROCLEN*b).
!BEGINNING POINT OF LINEAR REGRESSION LINE 1:
LRVrocLen is intercept + ((ROCLEN-ROCLEN)*b).
!LINEAR REGRESSION RATE OF CHANGE IN INDICATOR1:
rocLRind1 is iff(b>0,abs((LRV / LRVrocLen – 1)),
-abs((LRV / LRVrocLen – 1))) * 100.
!LINEAR REGRESSION RATE OF CHANGE INDICATOR2 (PRICE):
!GET SLOPE AND INTERCEPT OF LINEAR REGRESSION LINE 2:
b2 is slope2(MYINDICATOR2,ROCLEN).
intercept2 is sum(MYINDICATOR2,ROCLEN)/
ROCLEN – (b2 * (ROCLEN + 1) / 2).
!GET END POINT OF LINEAR REGRESSION LINE 2:
LRV2 is intercept2 + (ROCLEN*b2).
!GET BEGINNING POINT OF LINEAR REGRESSION LINE 2:
LRVrocLen2 is intercept2 + ((ROCLEN-ROCLEN)*b2).
!GET LINEAR REGRESSION RATE OF CHANGE IN INDICATOR2:
rocLRind2 is iff(b2>0,abs((LRV2 / LRVrocLen2 – 1)),
-abs((LRV2 / LRVrocLen2 – 1))) * 100.
!GET DIVERGENCE BETWEEN ROC OF INDICATOR1 VS INDICATOR2:
DIFF is rocLRind1 – rocLRind2.
stdDIFF is sqrt(variance(DIFF,STDLEN)).
numSTD is DIFF/stdDIFF. !PLOT
!START DATE FOR LINEAR REGRESSION LINE:
startDate is setdate(ROCLEN).
!REPORTS:
ShowValues if [volume] > 3000 and [close] > 5
and hasdatafor(max(ROCLEN,STDLEN)+10)>=max(ROCLEN,STDLEN).
PosDiverg if DIFF > 0
and numSTD >= DEVIATION_STD_MULT and ShowValues.
NegDiverg if DIFF < 0
and numSTD <= -DEVIATION_STD_MULT and ShowValues.
Jun 29, 2013 | Uncategorized
Original article by Marsha Stokes
AIQ Code by Richard Denning
For this month’s Stocks and Commodities issue, I did not do the selected article on the step candle pattern, but instead I provide code for an indicator discussed in the Bonus Issue 2013 article, “Balancing Your Indicators”, by Martha Stokes.
In the article, the author discusses several indicators but focuses on the price versus volume rate of change. She suggests that we use these two to find divergences in price versus volume changes. She does not give specific formulas or describe how the indicators should be constructed nor how the diverge could be mechanized. She only shows examples of the indicators and gives interpretations on one stock.
To code the indicators, I used linear regression (LR) of the price compared to linear regression of the volume. We need to get the rate of change of each in order to normalize so that we can compare and get the divergence. I get the LR rate of change of each indicator by using the end points of the LR line (end point divided by beginning point -1). I use the slope to be sure the sign is correct. In other words if the linear regression slope is positive, then the rate of change must be positive. If negative then it must be negative. Next I get the standard deviation (STD) of the difference (DIFF) between the LR percent rate of change of volume minus the LR percent rate of change of price. By then dividing the current DIFF by the STD, I get a measure of how much divergence is currently happening. When the divergence exceeds the input value, buy and sell signals can be generated.
Chart of ADSK on date of positive divergence signal (7/9/09) with LR lines on price and volume.
The chart of ADSK with the linear regression lines drawn in on the price and the volume. We see that price has a negative rate of change and volume has a positive rate of change. The divergence indicator exceeded the 2 STD positive level on 7/9/09 for a buy signal. Holding for 10 trading days the trade generated a profit of 23.69%.
Chart of ADSK on date of trade exit (7/24/09) with divergence indicator and the 2 STD signal lines. When the indicator crossed above the upper signal line on 7/9/09, a buy signal is indicated. This trade was entered on 7/10/09 at the open and exited on 7/24/09 at the open.
In this chart I show the divergence indicator on ADSK with the date shifted to the exit date. I picked this trade because it was a clear example of how the indicator can work, however there were many other trades that did not work as well as this one. The code provided is not meant to be a complete trading system as it lacks exits rules and position sizing. More testing should be done to determine the appropriate inputs, etc.
The AIQ EDS code is below
!APPLYING QUANTITY AND TIME INDICATORS
!Substituted for the July 2013 Traders’ Tips Article
!Author: Martha Stokes, TASC Bonus Issue 2013
!Coded by: Richard Denning 5/12/13
!INPUTS:
ROCLEN is 24.
MYINDICATOR1 is [volume].
MYINDICATOR2 is [close].
STDLEN is 200.
DEVIATION_STD_MULT is 2.
!LINEAR REGRESSION RATE OF CHANGE INDICATOR1 (VOLUME):
!GET SLOPE AND INTERCEPT OF LINEAR REGRESSION LINE 1:
b is slope2(MYINDICATOR1,ROCLEN).
intercept is sum(MYINDICATOR1,ROCLEN)/
ROCLEN – (b * (ROCLEN + 1) / 2).
!END POINT OF LINEAR REGRESSION LINE 1:
LRV is intercept + (ROCLEN*b).
!BEGINNING POINT OF LINEAR REGRESSION LINE 1:
LRVrocLen is intercept + ((ROCLEN-ROCLEN)*b).
!LINEAR REGRESSION RATE OF CHANGE IN INDICATOR1:
rocLRind1 is iff(b>0,abs((LRV / LRVrocLen – 1)),
-abs((LRV / LRVrocLen – 1))) * 100.
!LINEAR REGRESSION RATE OF CHANGE INDICATOR2 (PRICE):
!GET SLOPE AND INTERCEPT OF LINEAR REGRESSION LINE 2:
b2 is slope2(MYINDICATOR2,ROCLEN).
intercept2 is sum(MYINDICATOR2,ROCLEN)/
ROCLEN – (b2 * (ROCLEN + 1) / 2).
!GET END POINT OF LINEAR REGRESSION LINE 2:
LRV2 is intercept2 + (ROCLEN*b2).
!GET BEGINNING POINT OF LINEAR REGRESSION LINE 2:
LRVrocLen2 is intercept2 + ((ROCLEN-ROCLEN)*b2).
!GET LINEAR REGRESSION RATE OF CHANGE IN INDICATOR2:
rocLRind2 is iff(b2>0,abs((LRV2 / LRVrocLen2 – 1)),
-abs((LRV2 / LRVrocLen2 – 1))) * 100.
!GET DIVERGENCE BETWEEN ROC OF INDICATOR1 VS INDICATOR2:
DIFF is rocLRind1 – rocLRind2.
stdDIFF is sqrt(variance(DIFF,STDLEN)).
numSTD is DIFF/stdDIFF. !PLOT
!START DATE FOR LINEAR REGRESSION LINE:
startDate is setdate(ROCLEN).
!REPORTS:
ShowValues if [volume] > 3000 and [close] > 5
and hasdatafor(max(ROCLEN,STDLEN)+10)>=max(ROCLEN,STDLEN).
PosDiverg if DIFF > 0
and numSTD >= DEVIATION_STD_MULT and ShowValues.
NegDiverg if DIFF < 0
and numSTD <= -DEVIATION_STD_MULT and ShowValues.
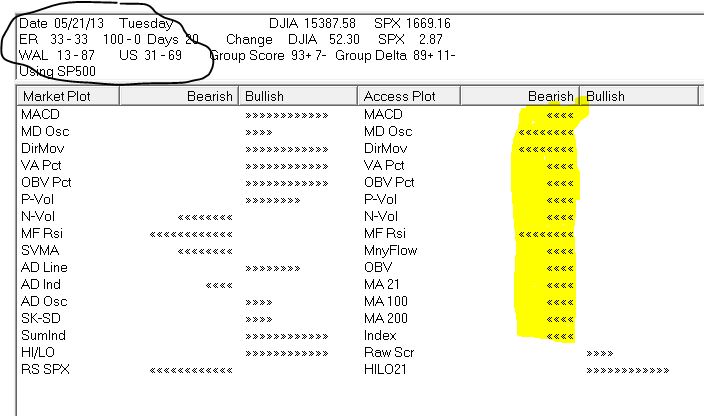
May 23, 2013 | Uncategorized
AIQ TradingExpert Pro’s Market Log provides traders with a daily snapshot of market conditions and how the market segments are performing. I’ll explain some of the elements here;
Days since the first Expert Rating to the up or down side – currently 20 days into an up rating of 100 – 0. The current rating is 33 – 33 and only ratings of 95 – 0 or 0 – 95 are significant.
Group Score is trending up vs trending down groups in S & P 500 – currently 93 % up.
WAL 13 – 87 and US 31 – 69 are a percentage measure of any stocks in the S & P 500 receiving expert ratings to the upside vs downside. Definitely more down than up ratings.
Market Plot measures the bullish and bearish readings of a basket of indicators for the Dow 30 Index.
Access Plot measures the bullish and bearish readings of a basket of indicators for each of the S & P 500 stocks. It’s the average reading for all 500 stocks for each indicator. This area I highlighted for it’s bearish technical look.
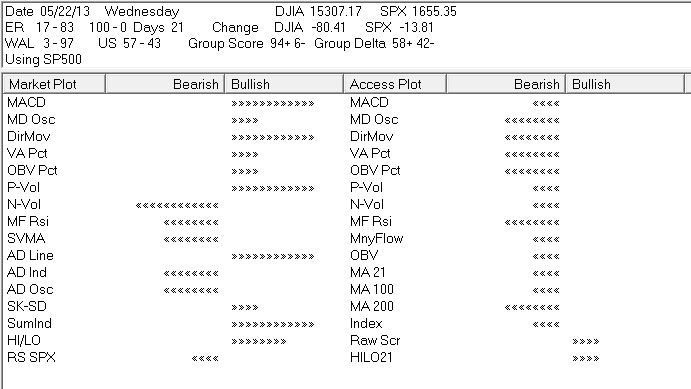
The Dow 30 Index is technically more bullish than the S & P 500 stocks. Next day Wednesday May 22nd, 2013 the Dow fell 80 some points, but the S & P 500 Index fell nearly 14 points. The market Log for 5/22/2013 shows the continued technical weakness in the stocks but less so in the Dow 30 Index.
May 23, 2013 | Uncategorized
AIQ TradingExpert Pro’s Market Log provides traders with a daily snapshot of market conditions and how the market segments are performing. I’ll explain some of the elements here;
Days since the first Expert Rating to the up or down side – currently 20 days into an up rating of 100 – 0. The current rating is 33 – 33 and only ratings of 95 – 0 or 0 – 95 are significant.
Group Score is trending up vs trending down groups in S & P 500 – currently 93 % up.
WAL 13 – 87 and US 31 – 69 are a percentage measure of any stocks in the S & P 500 receiving expert ratings to the upside vs downside. Definitely more down than up ratings.
Market Plot measures the bullish and bearish readings of a basket of indicators for the Dow 30 Index.
Access Plot measures the bullish and bearish readings of a basket of indicators for each of the S & P 500 stocks. It’s the average reading for all 500 stocks for each indicator. This area I highlighted for it’s bearish technical look.
The Dow 30 Index is technically more bullish than the S & P 500 stocks. Next day Wednesday May 22nd, 2013 the Dow fell 80 some points, but the S & P 500 Index fell nearly 14 points. The market Log for 5/22/2013 shows the continued technical weakness in the stocks but less so in the Dow 30 Index.
May 7, 2013 | Uncategorized