Jan 4, 2017 | ETFs, jay kaeppel, stock market, trading strategies
Before moving on to 2017 I want to revisit a couple of “old” ideas I wrote about recently.
One 9/23/16 I wrote
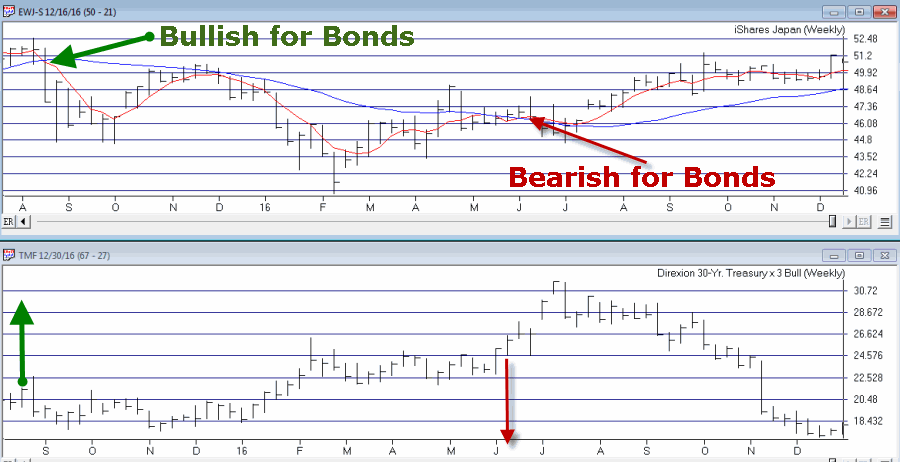
this article detailing a very aggressive bond trading strategy. The model detailed essentially combined two other models that I have used for a number of years – one a “timing” model, the other a “seasonal” model. If either model is bullish then ticker TMF (a triple leveraged long-term treasury bond fund) is held.
As shown in Figure 1, the first model turns:
*Bullish for Bonds when the 5-week moving average for ticker EWJ drops below the 30-week moving average for ticker EWJ
*Bearish for Bonds when the 5-week moving average for ticker EWJ rises above the 30-week moving average for ticker EWJ
Figure 1 – Bond Bull and Bear signals using ticker EWJ (Courtesy
TradingExpert)
The second model simply holds bonds during the last 5 trading days of each month
The rules for Jay’s Very Risky Bond Model (JVRBM) are as follows:
Bullish for TMF if:
*Ticker EWJ 5-week MA < Ticker EWJ 30-week MA, OR
*Today is one of the last 5 trading days of the month
Bearish for TMF if:
*EWJ 5-week MA > EWJ 30-week MA AND today IS NOT one of the last 5 trading days of the month
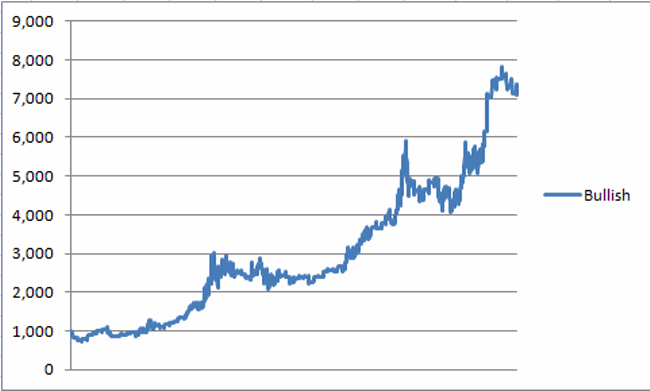
Figure 2 displays the growth of $1,000 invested in TMF if the bullish conditions above apply since 4/16/2009 (when TMF started trading).
Figure 2 – Growth of $1,000 invested in ticker TMF when JVRBM is Bullish (4/16/2009-12/30/2016)
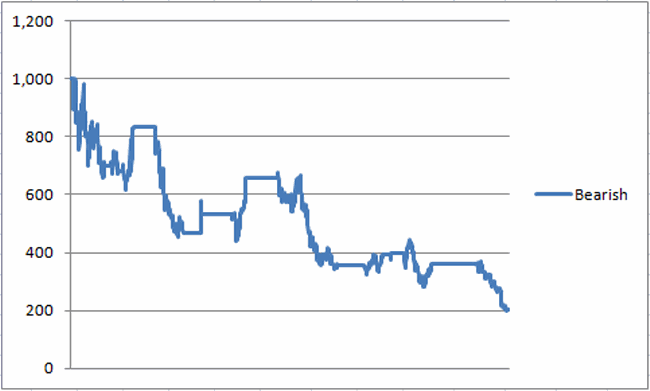
Figure 3 displays the growth of $1,000 invested in TMF is the bearish conditions above apply since 4/16/2009 (when TMF started trading).
Figure 3 – Growth of $1,000 invested in ticker TMF when JVRBM is Bearish (4/16/2009-12/30/2016)
For the record:
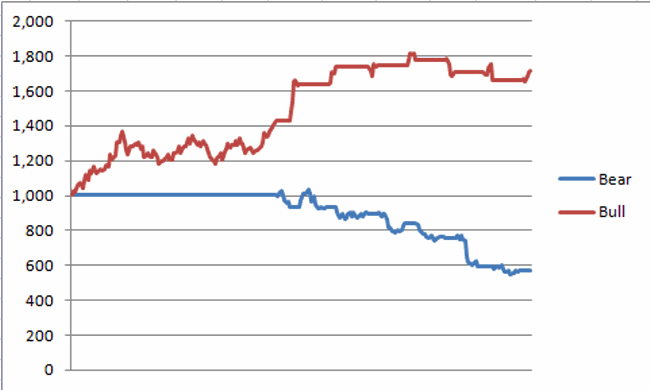
*During the Bullish periods in 2016 ticker TMF gained +72%
*During the Bearish periods in 2016 ticker TMF lost -43%
Figure 4 displays the growth of $1,000 invested in ticker TMF during the Bullish versus Bearish periods in 2016.
Figure 4 – Growth of $1,000 invested in TMF during Bullish versus Bearish periods (12/31/2015-12/31/2016)
All in all not a bad year (Just don’t forget high degree of risk).
Summary
Make no mistake, this is a trading method that entails a great deal of risk. One can reasonably ask if a long position in a triple leveraged fund of any kind is really a good idea.
But, hey, the phrase “high risk, high reward” exists for a reason.
Dec 22, 2016 | educational newsletters, group and sector, jay kaeppel, stock market
In my last piece I note that the U.S. stock market presently stands alone in terms of recent performance. While virtually every major U.S. stock market average has run to new highs in the last several weeks, not one other individual country has really even come close. While this might induce spontaneous chants of “USA, USA”, the truth is that this may not necessarily be a good thing.
This current disconnect will likely be resolved in one of two ways:
A) The USA will drag the rest of the world screaming and kicking to enjoy in our newfound prosperity (assuming of course that we finally stumble upon that actual newfound prosperity that the stock market is telling us we should be celebrating).
B) The USA fails to pull up the rest of the world and the US stock market gets “dragged down” with the rest of the world’s bourses.
This is the part in the article where a skilled market analyst would offer up a clear and concise opinion of what will happen next and why. And if one happens to stop by the office in the next few minutes or so I will ask him or her what they think. All I know is that at the moment the US stock market is in an uptrend and that the majority of the rest of the world’s stock markets are fair to middling at best (with many looking much worse).
Until something changes I will stick to the US market, thank you very much.
A Little “Worldly” Perspective
What follows is essentially the world (stock markets) in pictures. The purpose is simply to provide you with some perspective regarding the state of the markets around the globe.
The key thing to note is:
*Figure 1 shows U.S. stocks making new highs
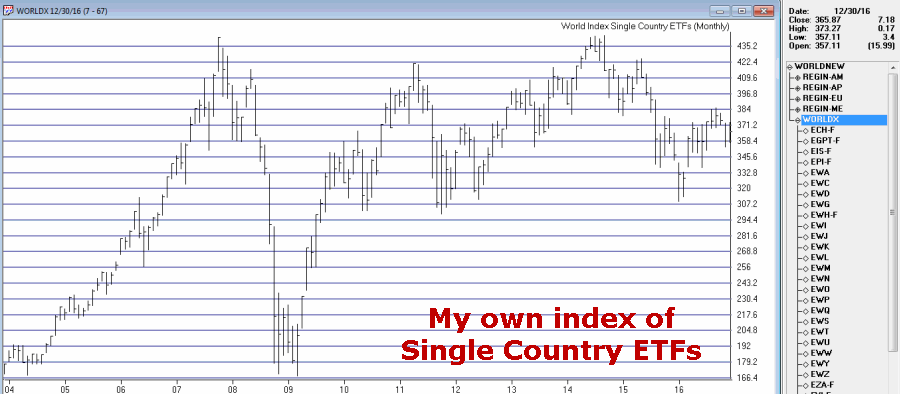
*Figures 2 through 6 show the rest of the world’s stock markets lagging far behind
Click Figures 1 through 6 to enlarge
Figure 1 – U.S. Stocks soaring to new highs (Courtesy
TradingExpert )
Figure 2 – My Own Index of Single Country ETFs; -17% below 2014 high (Courtesy
TradingExpert )
Editor’s note: information on creating your own index of ETFs or any other tickers in TradingExpert can be found here http://www.aiqsystems.com/Feb06%20OBM.pdf on page 5, titled Ability to Create Industry Groups for Your Special Trading Needs….
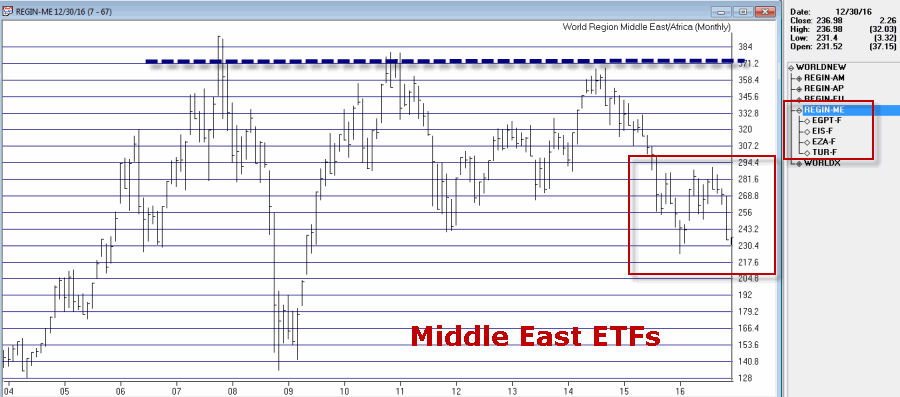
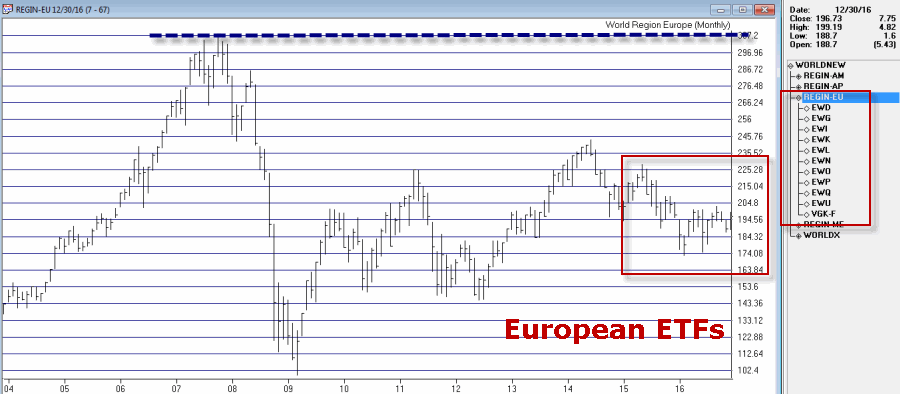
In Figures 3 through 6 note that the overall “stock market malaise” is not limited to one portion of our earth, but rather stretches pretty far East, West, North, South and pretty much all points in between.
Figure 3 – Middle East Stocks; -40% below 2007 high (Courtesy
TradingExpert )
Figure 4 – European Stocks; -36% below 2007 high (Courtesy
TradingExpert )
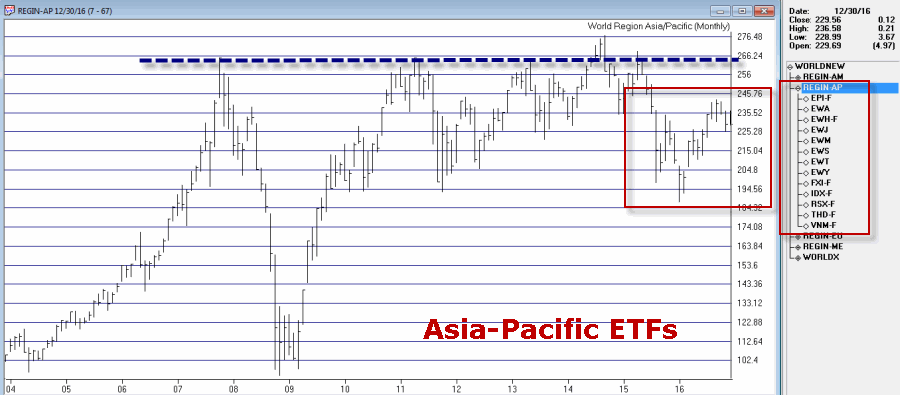
Figure 5 – Asia-Pacific Stocks;-17% below 2014 high (Courtesy
TradingExpert )
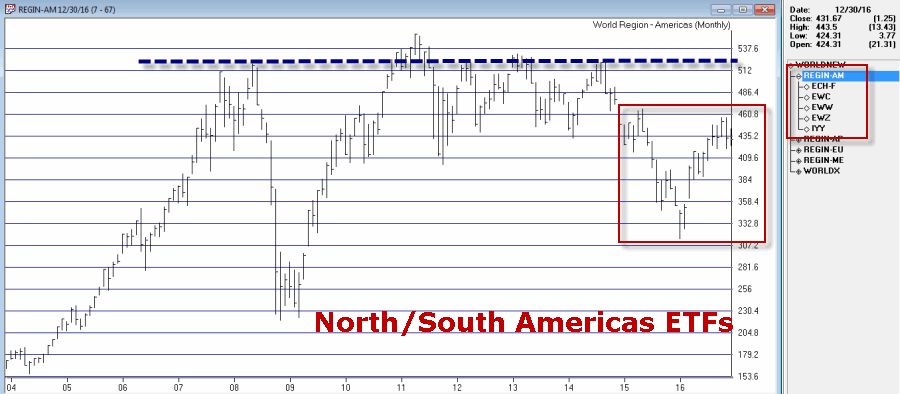
Figure 6 – North/South America Stocks; -22% below 2011 high (Courtesy
TradingExpert )
Wishing you (please choose any or all of the following that are applicable):
*Merry Christmas
*Happy New Year
*Happy Holidays
*Joy
*Peace on Earth
*[Some other phrase that you do not find offensive here]
Jay Kaeppel
Chief Market Analyst at JayOnTheMarkets.com and TradingExpert Pro client. http://jayonthemarkets.com/
Dec 21, 2016 | educational newsletters, ETFs, jay kaeppel, stock market
In this seemingly ever more divided and ever more electronic age, “perspective” is not a word (or action) that gets mentioned (or employed) with as much frequency as it used to. The default approach for a lot of things appears to be:
a) Decide ones opinion
b) Take to the internet to shout categorically that said opinion is the only possible “correct” opinion
c) Excoriate anyone who disagrees
Well, sure that is one approach. But when it comes to investing it is fairly important to raise one’s head and take a look around every once in awhile.
Hey, how about now?
The U.S. Stock Market Post Election
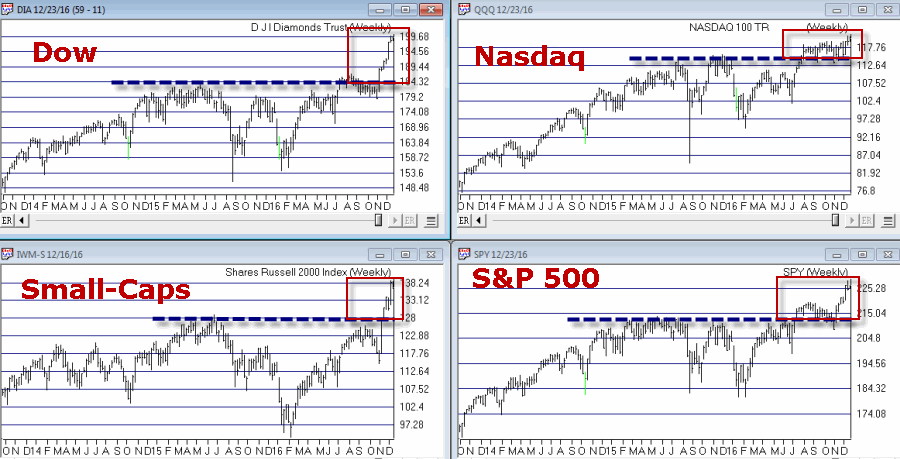
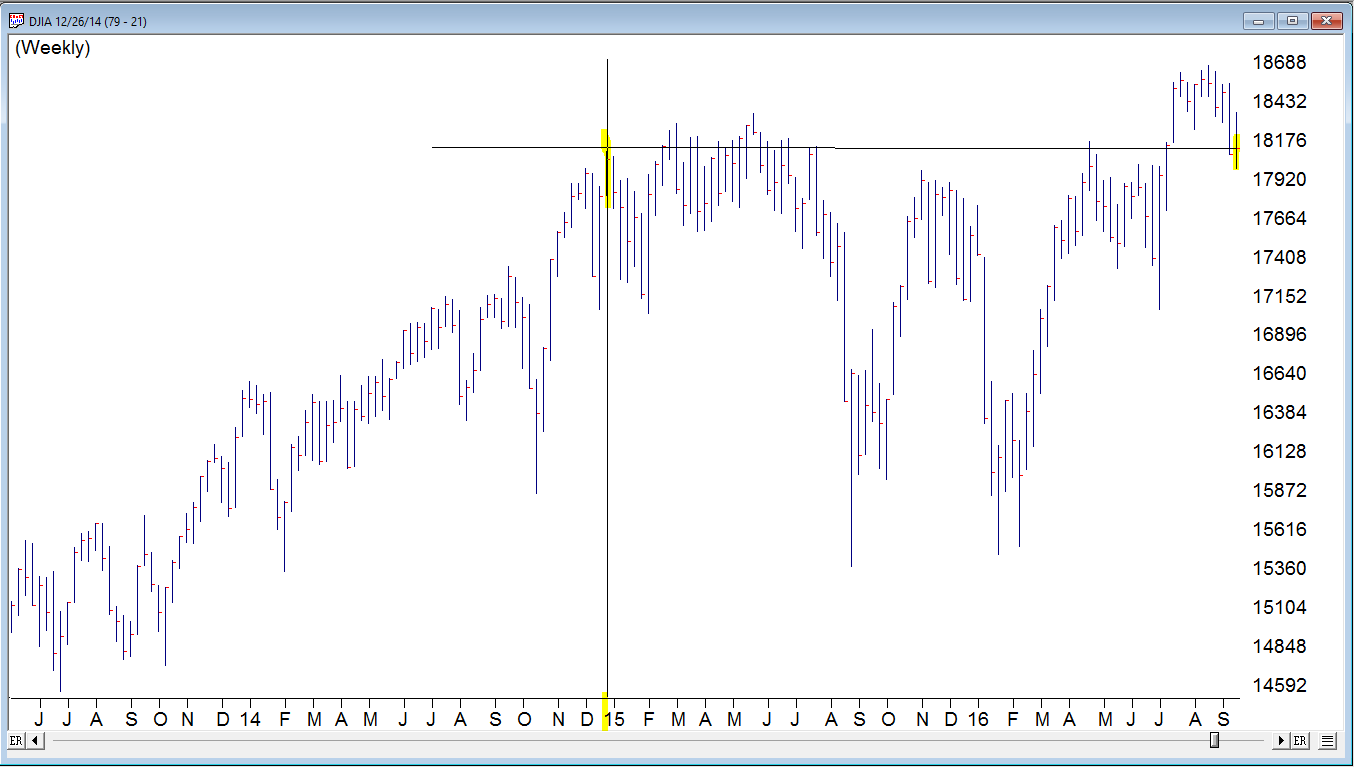
Since the election in November the U.S. stock market has been on a quite a tear, with the major market averages breaking out to new all-time highs as seen in Figure 1.
Figure 1 – Major market U.S. averages breakout to new highs (Courtesy
TradingExpert)
Now per a, b and c above, some will argue that this is a testament to the booming economy that #44 is leaving #45 while others will argue that it is a sign of new hope for the U.S. economy under a new adminstration.
My response: Whatever
Don’t get me wrong, I am all for a bull market. I hung in there all year despite a lot of doubts mostly because my trend-following indicators just kept staying bullish. And they remain thus. But like I said before a little perspective can sometimes go a long way.
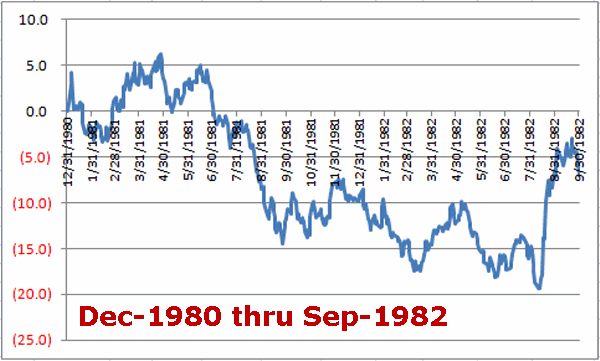
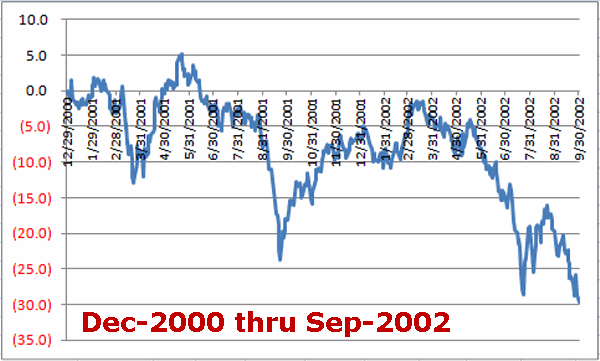
A New (Republican) Administration
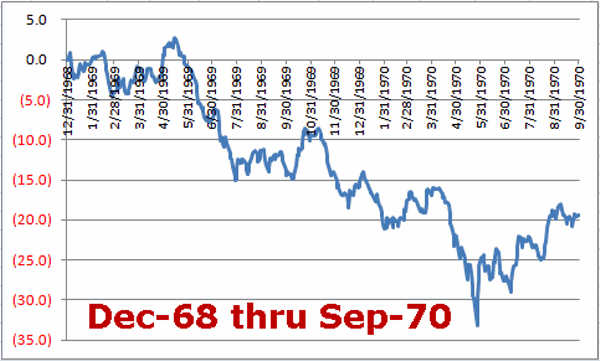
The historical fact is that the last 3 Republican administrations that followed Democratic administrations (Nixon, Reagan, Bush 43) did not experience great “stock market joy” during their first two years in office. Specifically, the first 21 months of the new four-year election cycle (i.e., starting on Dec. 31st of the election year through the end of September of the mid-term year) for each of these prior administrations witnessed a fair amount of “pain.”
Peruse Figures 2, 3 and 4 (which displays the % gain or loss for the Dow Jones Industrials Average for 21 months starting on December 31st of the election year) and see if you notice a trend.
Figure 2 – Dow % +(-); Dec-1968 thru Sep-1970 (Nixon – 1st 21 months)
Figure 3 – Dow % +(-); Dec-1980 thru Sep-1982 (Reagan – 1st 21 months)
Figure 4 – Dow % +(-); Dec-2000 thru Sep-2002 (Bush 43 – 1st 21 months)
The Good News is that there is no reason why this history has to repeat itself this time around. The Bad News is….that it very well could.
The Current Euphoria
As I stated earlier, when it comes to bull markets, I vote “YES”. I will take one anytime I can get it. And I also try to avoid being one of those “know it all types” (in the interest of full disclosure I am actually more one of those “sneaky” types who tries to intimate that he actually does know it all by trying not to act like a know it all – which is technically probably worse. But, hey, at least now you know) who routinely “talks down” a bull market (“Oh sure, things are great now but just you wait….” And so on). That “just you wait” stuff gets really old after a short while.
So here we stand. The major U.S. averages are bursting forth to new highs – so who am I to be a naysayer? Still, there is that pesky “perceptive” thing I mentioned earlier. Before getting too carried away with bullish euphoria please sear Figures 2, 3 and 4 above somewhere into the back of your brain – just in case.
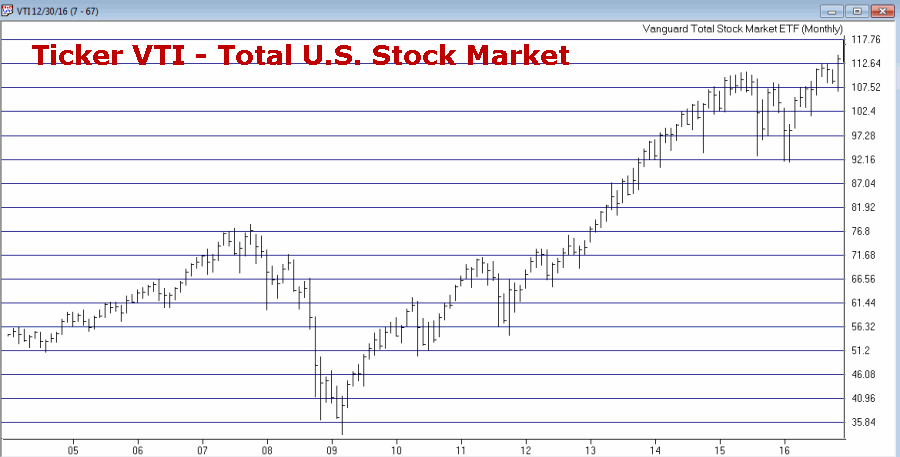
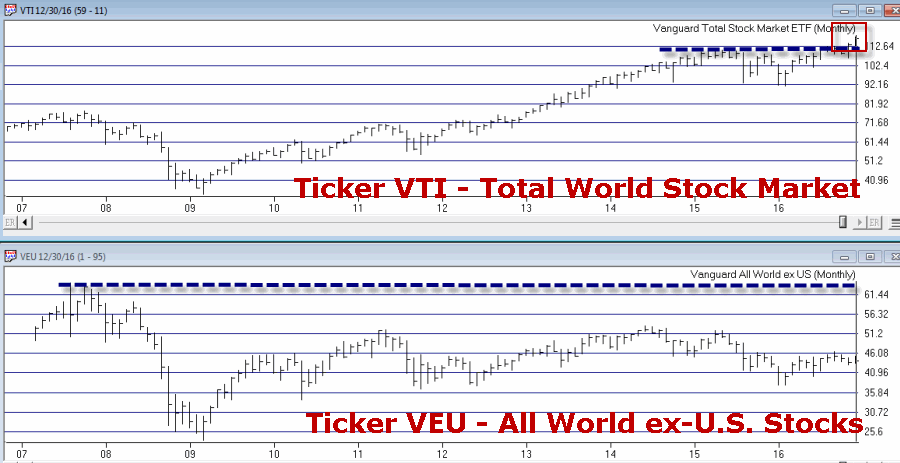
Also note that the U.S. stock market is virtually alone in the world in terms of making new highs. Figure 5 displays:
Ticker VTI – Vanguard Total (U.S.) Stock Market ETF
Ticker VEU – Vanguard All World ex-U.S. Stock Market ETF
To be clear, ticker VTI essentially covers the entire U.S. stock market. Ticker VEU covers a broad array of major world stock markets BUT does not include U.S. stocks.
Figure 5 – U.S. Total Stock Market = New Highs; World Total Stock Market = NOT New Highs (Courtesy
TradingExpert)
Note that the U.S. market has broken out strongly to new highs while the “whole world” of markets is nowhere close to doing so. Certainly one can adopt the “What, me worry?” approach and argue that “the U.S. market will lead the other world markets to reach new highs.” And maybe that will prove to be the case.
But as I will highlight soon – and as reflected by tickers VTI and VEU – the U.S. stock market looks great while virtually the rest of the markets around the globe look pretty not so great. So please check back for Part II soon
In the meantime, enjoy the rally and the Holidays – I know I will.
Sep 19, 2016 | group and sector, indexes, stock market, Stock trading
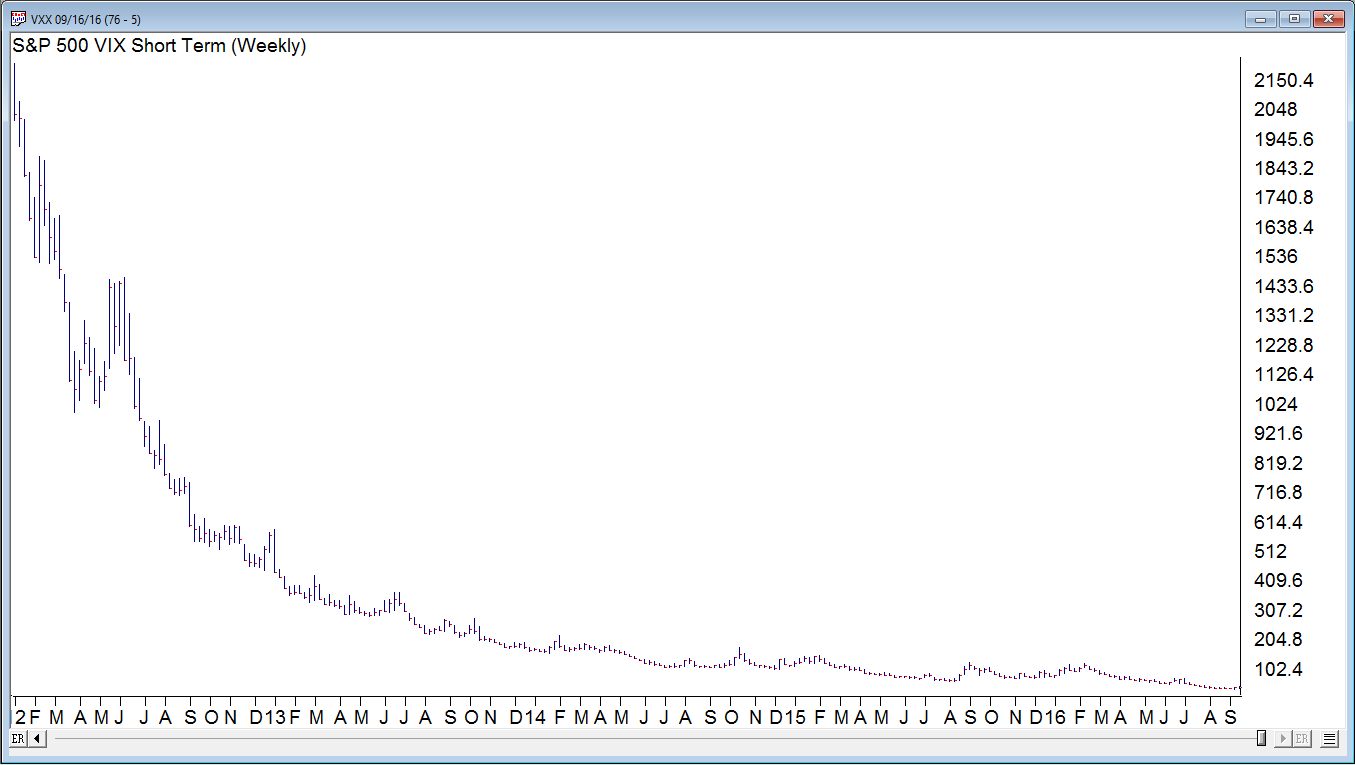
The markets have been shall we say been less than inspiring recently. Brexit came and went with a brief hiccup in the action and only in the last week or so has the volatility picked up. The Dow as you can see in this weekly chart is back the same level as December 2014
The VXX shows clearly the decline in volatility since the high back in 2011
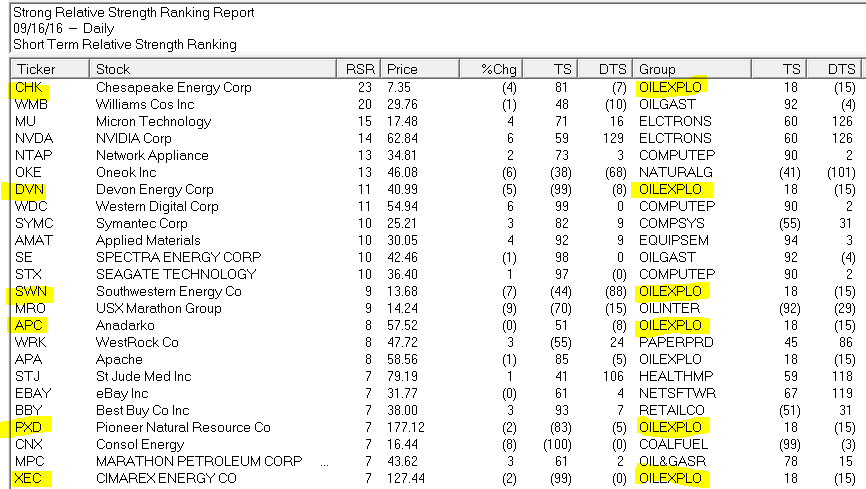
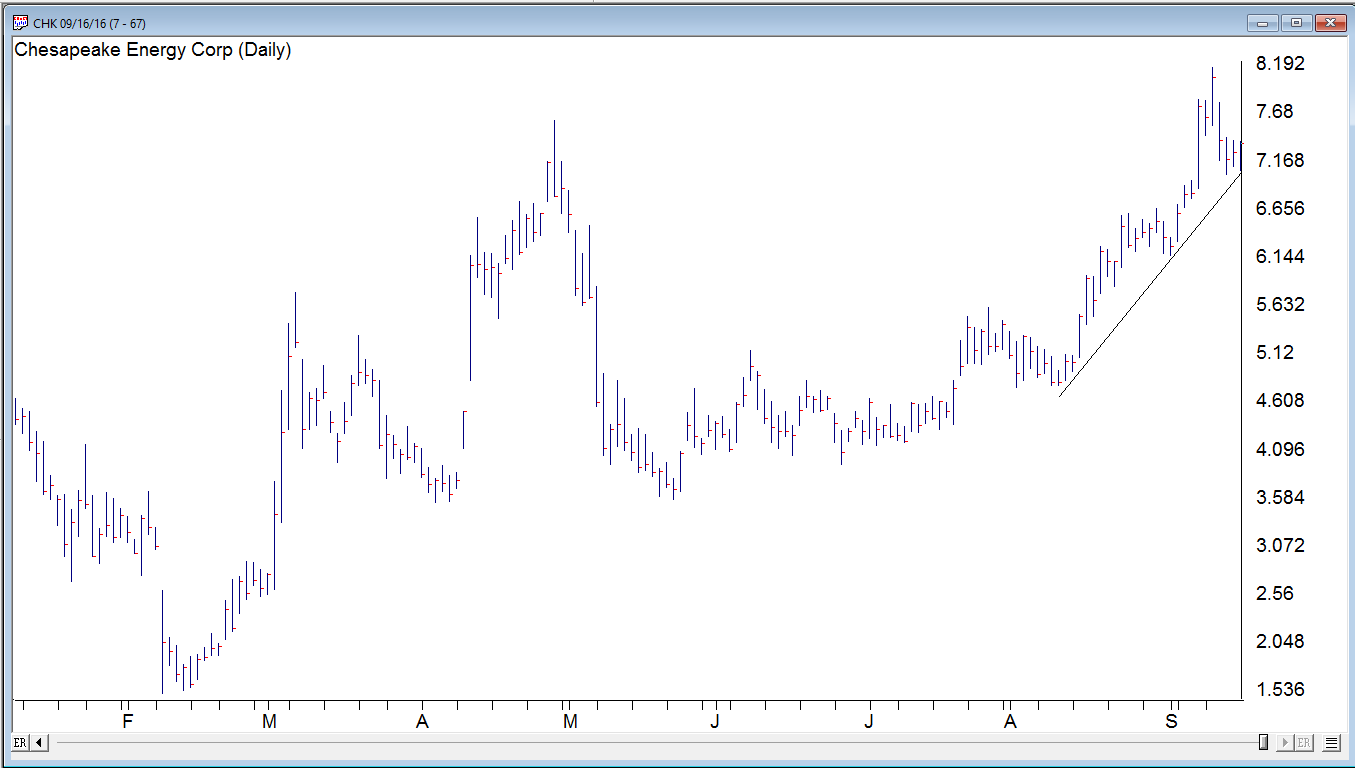
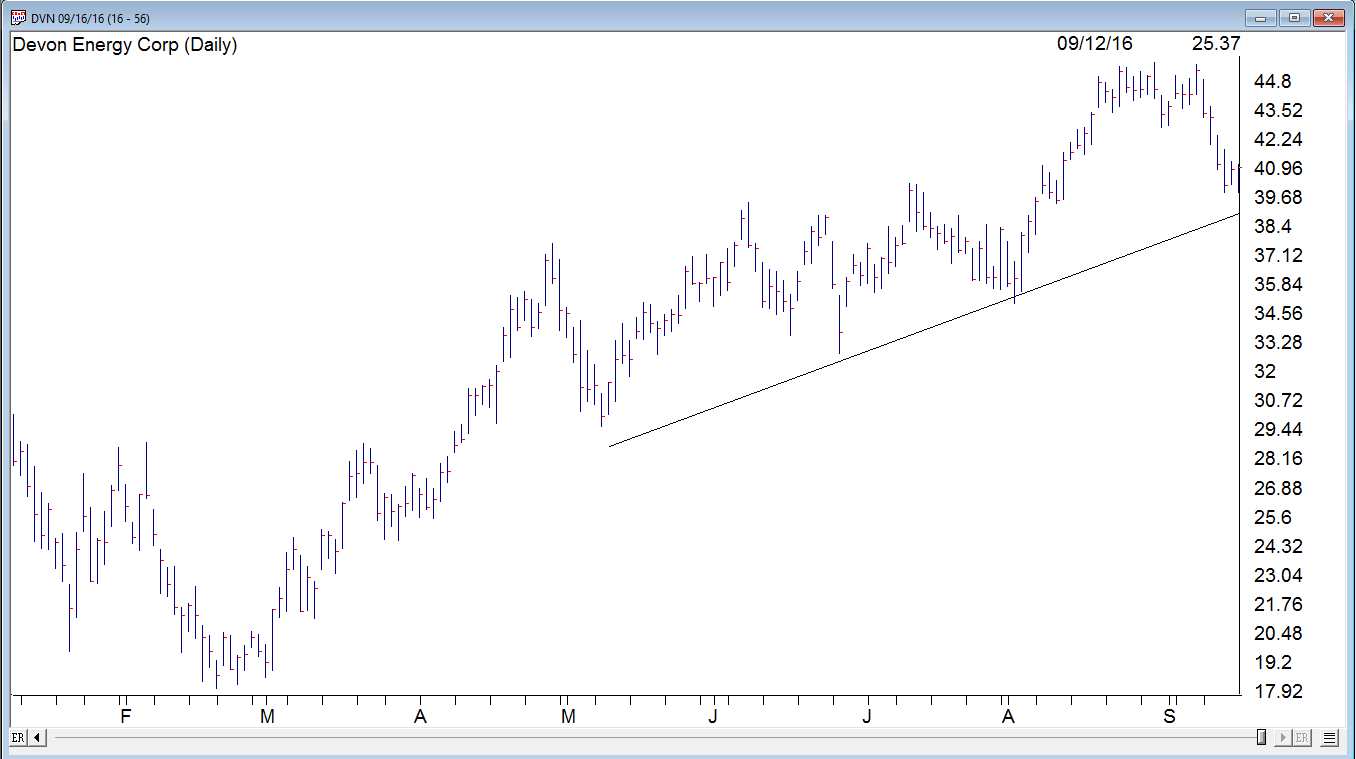
The summer doldrums may be over, but during periods when the market is range bound, segments within the market are often performing very well or very poorly. One AIQ Report that can show the strength within segments is the Relative Strength Strong – Short Term. This report shows stocks in 3 month trend up and is a great report for those who trade with ‘the trend is your friend’. Here is Friday 9-16-2016 report. The report is ranked by the stocks with the best trend.
I highlighted 6 stocks in the top of this report. All have good trends in place, and all in the Oil and Exploration S&P 500 group. The group has performed quite well recently. The top 2 OILEXPO stocks CHK and DVN have both had a small pullback to their uptrend line. We’ll see how they do this week.
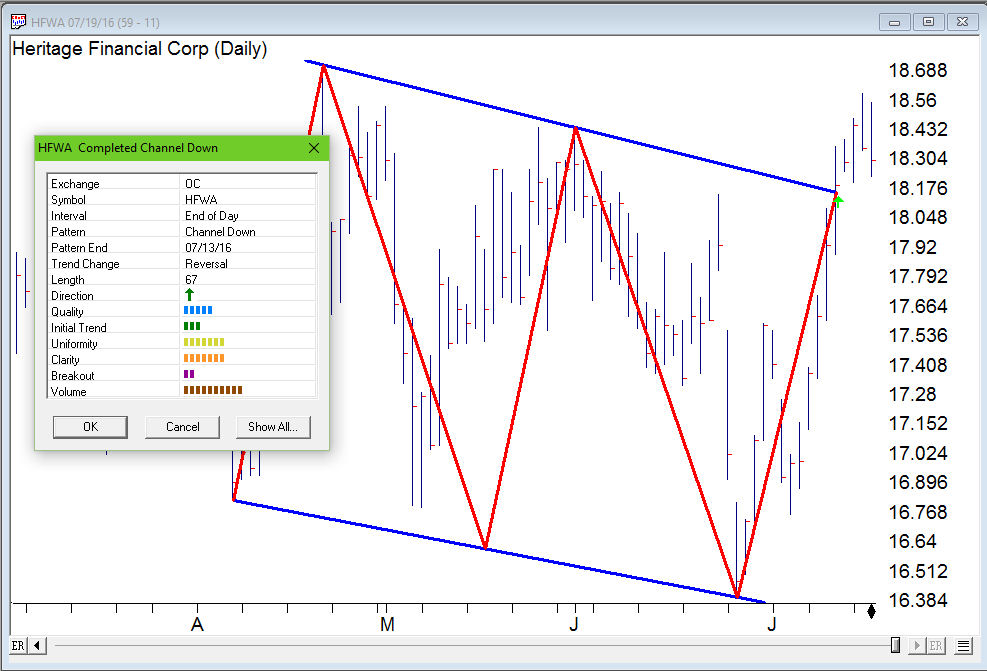
Jul 26, 2016 | chart patterns, EDS, stock market
Why add Chart Pattern to your TradingExpert Pro?
- 16 different patterns tracked
- 6 gauges of each pattern's quality
- Automatically generate report every night
- Built in EDS file so you can backtest and add to your own strategy
- Completed and emerging patterns
OR CALL AIQ SALES on 1-800-332-2999 or 775-832-2798
LOCK in 2008 pricing
If you order before July 31, 2016
you'll get the 2008 pricing!
OR CALL AIQ SALES on 1-800-332-2999 or 775-832-2798