It’s been a couple of months since we last looked at the Market Timing AI Expert System. Since that time the 400 rules that make up this AI system have generated a cluster of 3 down signals, followed by a buy signal and then most recently another down signal.
In this 7 minute video Steve Hill, CEO of AIQ Systems explores the signals and the confirmation techniques used to verfiy the ratings, together with the primary rules that fired.
This video on the Market Timing signals in AIQ is also applicable for our WinWayCharts TradingExpert Market Timing. Check it out.
Market volatility continues. In this update we’ll take a look at the current AI signals on the Dow Jones. For folks less familiar with our AI engine here’s a recap of what we do.
TradingExpert Pro uses two AI knowledge bases, one specifically designed to issue market timing signals and the other designed to issue stock timing signals.
Each contains approximately 400 rules, but only a few “fire” on any given day. In the language of expert systems, those rules that are found to be valid on a particular day are described as having “fired”.
Rules can fire in opposite directions. When this happens, the bullish and bearish rules fight it out. It’s only when bullish rules dominate that the Expert Rating signal is bullish, or when bearish rules dominate that the Expert Rating signal is bearish.
The Expert Rating consists of two values.
The upside rating is the value on the left and the downside rating is on the right. Expert Ratings are based on a scale of 0 to 100. An Expert Rating of 95 to 100 is considered a strong signal that the Stock or market may change direction.
An Expert Rating below 90 is considered meaningless. A low rating means that there is not enough consistency in the rules that fired to translate to a signal. The expert system has not found enough evidence to warrant a change from the last strong signal.
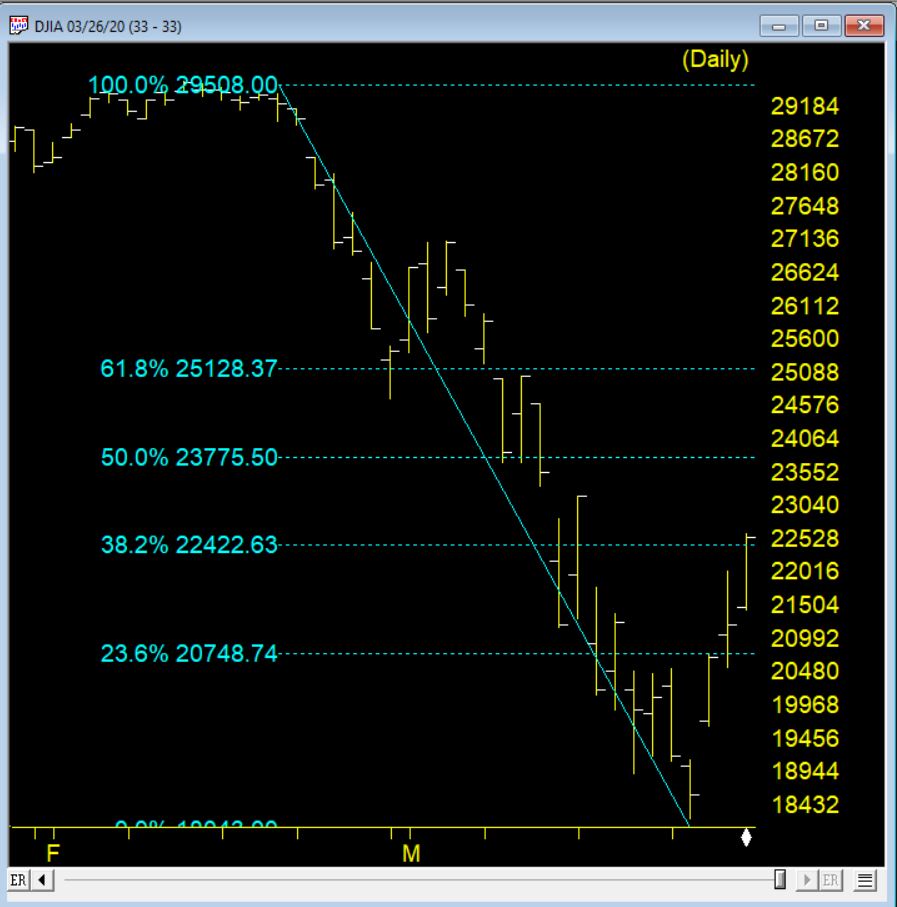
3-26-20 saw the market on the third day of a rebound from the low of 18213 on 3-23-20. The chart below shows the Fibonacci retracements from the recent high to this low. Since that time prices have been a narrow range for this volatile market
The retracement hit the 38.2% level and this level can offer resistance. The market is down again and could be we are headed down to retest at or near the last low.
If we rally passes the 38.2% the next resistance level will be at 23775 or so at the 50% retracement level.
Market Timing signals
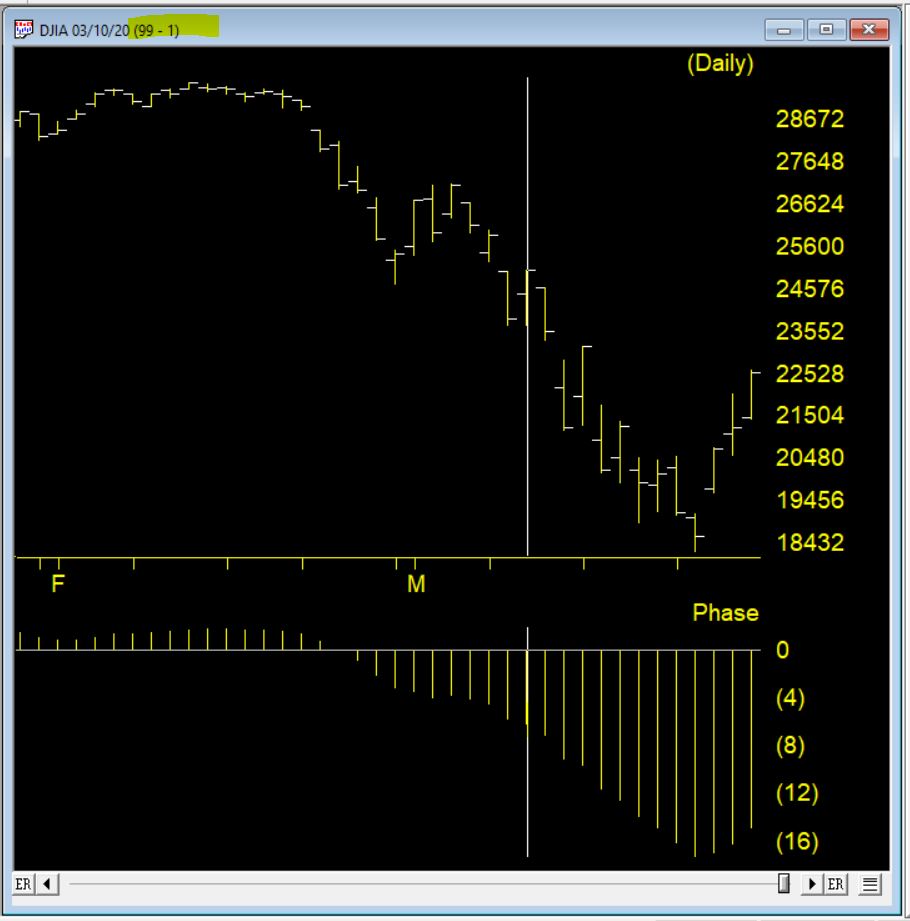
The Market Timing system issued a 99-1 up signal on 3-10-20, the chart below shows the signal. The Phase indicator changing direction in the direction of the signal (moving down then moves up) provides confirmation market Timing signals. IN this case that didn’t happen.
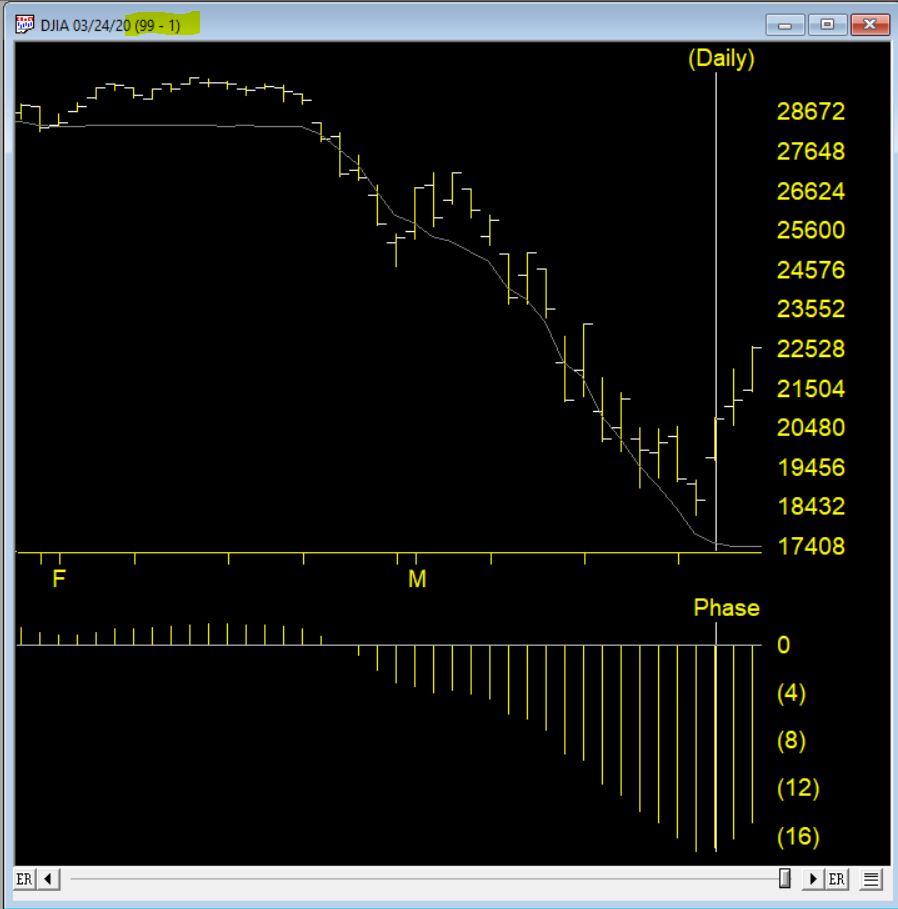
Another up signal 99-1 fired on 3-24-20 and this time the phase turned up the same day and confirmed the signal.
Here are 3 of the bullish rules that fired to create this high up signal
The 21 day stochastic has advanced and crossed the 20% line and the price phase indicator is also increasing. In this weakly downtrending market this is taken as a strong bullish signal suggesting an increase in prices.
Volume accumulation percentage is increasing and the 21 day stochastic has moved above the 20% line. In this downtrending market, this is taken as a strong bullish signal that could be followed by an upward price movement.
The price phase indicator is negative but volume accumulation has started to advance. This is a non-conformation that, regardless of the type of market, is a bullish signal which usually results in an upward movement of the market.
The counter trend AI system that generates these signals can be early in their firing. While the market moved up 2000 a nice move in most markets, in prior trading environments this would have taken a number of weeks, in our current volatility the market moved from the up signal in 2 days.
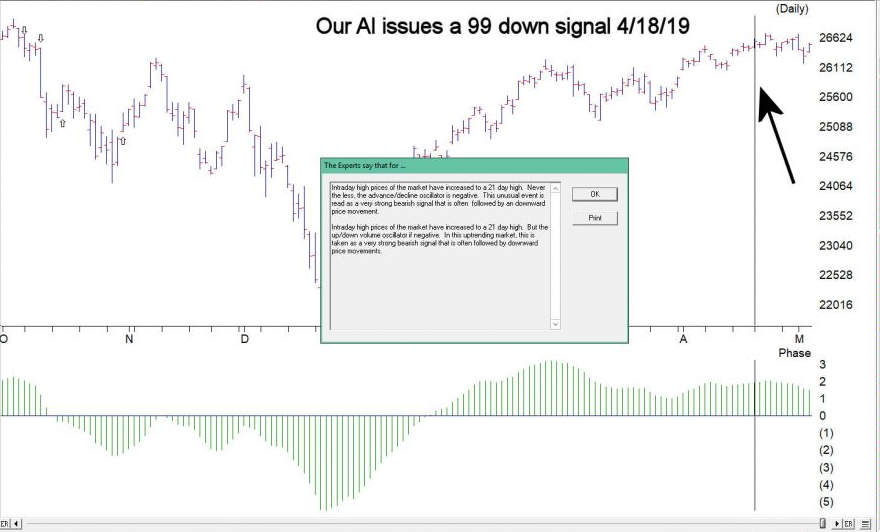
WinWay Charts AI issued a market down signal of 99 on April 18, 2019. Price Phase, our custom indicator that we use to confirm ratings turned down 4 days after the rating. Usually we like to see this indicator turn down closer to the rating, but the AI Expert system is often a little early.
The two significant rules rules that fired on this 99 down are below
“Intraday high prices of the market have increased to a 21 day high. Never the less, the advance/decline oscillator is negative. This unusual event is read as a very strong bearish signal that is often followed by an downward price movement. “
“Intraday high prices of the market have increased to a 21 day high. But the up/down volume oscillator if negative. In this uptrending market, this is taken as a very strong bearish signal that is often followed by downward price movements. “
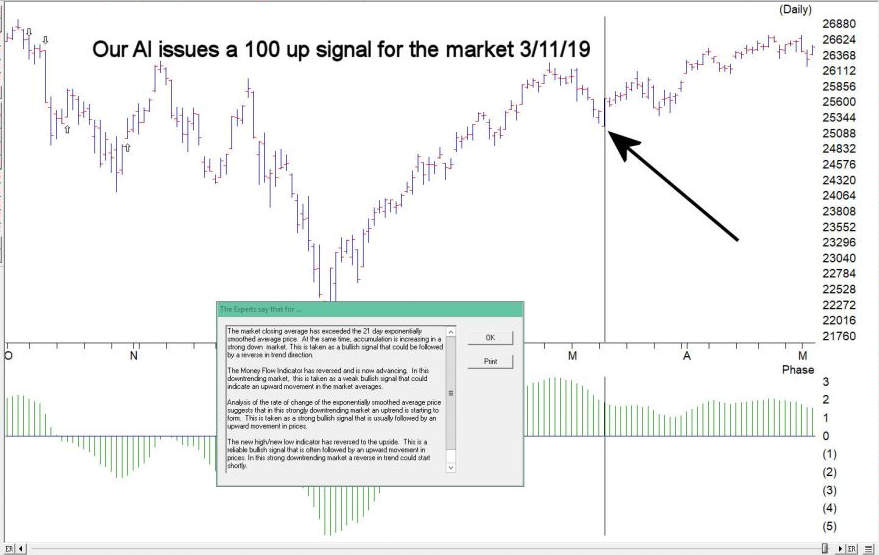
The prior AI rating on the market was a 100 up on March 11, 2019 the market moved up over 850 points to the April down signal. Here are the AI rules that fired for this rating
“The market closing average has exceeded the 21 day exponentially smoothed average price. At the same time, accumulation is increasing in a strong down market. This is taken as a bullish signal that could be followed by a reverse in trend direction. “ “The Money Flow Indicator has reversed and is now advancing. In this downtrending market, this is taken as a weak bullish signal that could indicate an upward movement in the market averages. “ “Analysis of the rate of change of the exponentially smoothed average price suggests that in this strongly downtrending market an uptrend is starting to form. This is taken as a strong bullish signal that is usually followed by an upward movement in prices. “ “The new high/new low indicator has reversed to the upside. This is a reliable bullish signal that is often followed by an upward movement in prices. In this strong downtrending market a reverse in trend could start shortly. “
Ultimately any AI down signal is a note of caution in this market.
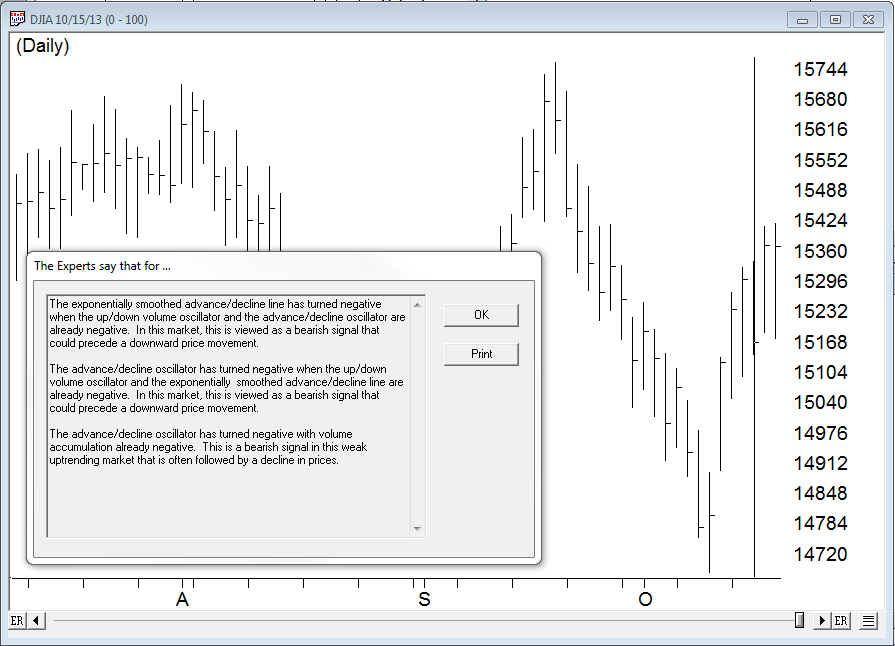
On Tuesday 10-15-2013 our AI market expert system fired a 0-100, that indicates a heavy weighting to the downside on the technical indicators. This is what the AI said
“The exponentially smoothed advance/decline line has turned negative wh…en the up/down volume oscillator and the advance/decline oscillator are already negative. In this market, this is viewed as a bearish signal that could precede a downward price movement.
The advance/decline oscillator has turned negative when the up/down volume oscillator and the exponentially smoothed advance/decline line are already negative. In this market, this is viewed as a bearish signal that could precede a downward price movement.
The advance/decline oscillator has turned negative with volume accumulation already negative. This is a bearish signal in this weak uptrending market that is often followed by a decline in prices. “