Feb 25, 2010 | Uncategorized
I was looking through some old tradings scans the other day, and came across a really basic scan that still works well today. Here’s the nuts and bolts.
1. Look for stocks with todays volume that is twice the 21 days ESA of volume.
2. Close today has to be greater than the mid point between the high and low today.
3. The 14-day RSI Wilder today has to be less than 30.
4. Go long at next days open.
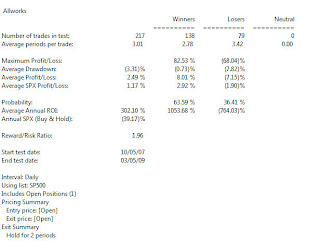
I tested this on Sp500 stocks with a simple holding period of 2 days, no other capital protection or exit strategy. Very interesting results. The test below was from 10/07/2007 – 03/05/2009. I wanted to cover a protracted pullback in the market (SP500 index was -39.17% for the period). The table below shows encouraging results.
The winners outnumbered the losers by 138 to 79 with an average profit/loss for all trades of 2.49%. Key points to note. With a holding period of 2 days, some positions take a big loss, some have hard drawdown (even in 2 days). You’d need a strong stomach to ride these positions. Scanning the positions in this strategy, there was one period where 25 new positions would have been established in one trading day. While not insurmountable, existing cash in an account would have been spread thinly if your capital was less than $50,000.
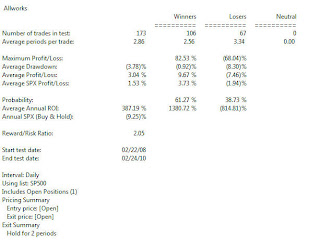
I ran this startegy for the last 24 months with similar results below. Again same key points on drawdown and new positions applied to this test.
In the next article, I’ll run this through the Portfolio Simulator with ‘real’ money for a complete real life test.
Feb 25, 2010 | Uncategorized
Trading is based on being positioned to profit if the stock, or the market, does the usual thing in a given situation. Since stocks often bounce from support, candidates with a larger distance to support from the entry are more attractive because they have more ‘room to run.
I apply the concepts of support, resistance, and accumulation to the market itself to determine if trading is appropriate. If I am trading shorts and the market is approaching support I become cautious. The reason is that the market often bounces or bases near support and thus shorts would be less attractive. When the market is clearly trending and well away from support I will use larger position sizes in my trades than when the market is approaching a support level. I cannot influence what the market does, but I can react to it and reduce my risks by taking smaller position sizes when the market is approaching a support level.
The upper Bollinger Band will often act as resistance to market moves, particularly in trading range markets. This tendency to retrace from the upper band during trading range conditions is something that can be used as part of a traders money management strategy. In strongly trending markets the market may ‘ride the bands’, but it is quite common for the market to base or retrace when hitting the upper band during a trading range environment. Since I always want to be positioned to profit when the market does the normal, or usual, thing I take profits on positions when they approach the upper band during a trading range environment.
There are a variety of interesting pullback systems for traders. Pullbacks are one of the bread and butter techniques of trading because they occur frequently and can be found in most market conditions. Most traders should have more than one pullback system in their trading tool box. There are interesting pullback systems based on the percentage of retracement, pullbacks to key moving averages, pullbacks for a specific number of days, and pullbacks with specific volume patterns.
Volume analysis is an important part of trading. Volume measures the interest in a move. It isn’t necessarily the absolute level of the volume that is key, it is often the volume pattern or the recent changes in volume that tell the story. My youngest daughter played soccer through high school and college, we attended a lot of interesting soccer games. If I was talking to someone at the game and all of a sudden the crowd noise increased significantly, we both know to quickly look on the field because something important was happening. For stocks, volume is like the crowd noise. The level of noise, or volume, changes depending on the importance of what is going on in the game.
Strong stocks tend to move up to lots of cheering, or volume; and they tend to retrace or pullback on light volume. The light volume pullback is not necessarily a significant change in behavior, which is noted by the quiet crowd or low volume. As stocks go through a rhythmic cycle up upward movement followed by brief retracements and then a continuation of the upward movement, we can use volume clues to determine of the retracements are a normal part of the stocks rhythm, or the beginning of a change in trend.
.
Steve Palmquist a full time trader who invests his own money in the market every day. He has shared trading techniques and systems at seminars across the country; presented at the Traders Expo, and published articles in Stocks & Commodities, Traders-Journal, The Opening Bell, and Working Money. Steve is the author of, “Money-Making Candlestick Patterns, Backtested for Proven Results’, in which he shares backtesting research on popular candlestick patterns and shows what actually works, and what does not. Steve is the publisher of the, ‘Timely Trades Letter’ in which he shares his market analysis and specific trading setups for stocks and ETFs. To receive a sample of the ‘Timely Trades Letter’ send an email to sample@daisydogger.com. Steve’s website:www.daisydogger.com provides additional trading information and market adaptive trading techniques. Steve teaches a weekly web seminar on specific trading techniques and market analysis through Power Trader Tools.
…
Feb 18, 2010 | Uncategorized
Bearing some resemblance to mutual funds, the ETF is actually in a class of its own. Rather than purchasing an individual stock, an ETF is a manner of automatic diversification, without the capital demands of individual stock purchase, yet all the while allowing the benefits of direct stock appreciation.
Mutual funds will have a daily valuation that will apply to all transactions on that day, as the unit price is altered to reflect the funds asset value; the advantage to the short term trader is minimized. ETF’s on the other hand are quite able to be traded intra-day, as the price will dynamically respond to the ordinary markets forces of demand and supply, and are able to trade at a discount or a premium to the underlying instrument they are hinged upon. This of course will take into account numerous fundamental variables, not the least of which is the cash and carry premium that is inherent in synthetics to reflect the absence of physically carrying the underlying instrument or commodity. Importantly, short selling is possible with ETF’s, and so trading on margin also adds to the inherent leverage that this type of synthetic instrument allows.
ETFs are available on numerous underlying instruments including indices, industry sectors, regional sectors, commodities, and in fact a plethora of niche markets that marvelously, even extend to fixed interest income streams. In a bid to maximize every possible return, this type of flexibility allows investors to tailor their portfolios to unprecedented accuracy. With ETF’s, any composition is quickly able to be implemented and adjusted when the need arises.
Often a mutual fund will charge fees up to 3% p.a. while an ETF will rarely exceed 1%. Still given a liquid ETF market exists, the bid ask spread will contribute to an investors expense and will detract from any return accruing. This is the one aspect of ETF trading that may dissuade smaller investors from redirecting investments from similar leveraged instruments such as mutual funds. Larger institutional traders on the other hand can cover their exposures easily in large volumes, which are far easier to execute than in individual markets.
There also exists a certain tax advantage concomitant to ETF’s. Capital gain will be realized and tax will accrue upon the conversion of equity through an exit trade. Additionally, some ETF’s upon equity will allow an exchange for physical stock, and similarly enabling the deferral of tax. Mutual funds however, must purchase and redeem shares of stocks as they are created within the fund, and then distribute the capital gain each quarter. This declaration is subject to an immediate tax liability, a nuance that an ETF does not lend itself to.
Feb 15, 2010 | Uncategorized
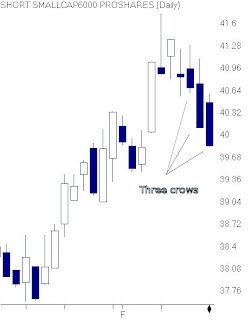
Three Black Crows consists of three consecutive long black real bodies occurring in an uptrend, each one uccessively lower than the candle prior. The first black candle typically opens above the prior day’s close. The two candles that follow are characterized by an open within the prior day’s real body and a close at or near the prior day’s low, creating a downward stairstep pattern. The Three Black Crows also translate into one very long black candle, sending a message of trend reversal.
Friday February 12, 2010 saw this classic bearish pattern on SBB, ProShares Short Small Cap 6000
Feb 8, 2010 | Uncategorized
When the market is falling and the charts look terrible, your emotions want you to sell. Conversely, when the market is rallying and the news is good, your emotions want you to buy. Unfortunately, this can lead to selling at the low or buying at the high. One way of controlling your emotions is to set some market timing rules based on AIQ’s US score, a unique indicator that can be found on the Market Log report.While the Expert Ratings on an individual stock can be suspect, the Expert Ratings taken from a large database (in this case the SP500) of stocks are effective in classifying the health of the market.
That is, when a lot of stocks are giving AIQ Expert Rating buy signals, a market rally may be near. Conversely, when a large number of stocks are giving AIQ sell signals, a market decline may be approaching.
Expert Ratings are either “confirmed” or “unconfirmed.” A confirmed buy signal occurs when a stock has a recent Expert Rating up signal of 95 or greater along with an increasing Phase indicator. The opposite is true for confirmed sell signals. Unconfirmed signals, however, occur when there is an Expert Rating of 95 or greater but the Phase indicator fails to move in the direction of the signal. It is the unconfirmed signals that you should be interested in.
AIQ’s Market Log report lists the percentage of stocks giving unconfirmed signals (US). The US score is found near the top of the report. The percentage of stocks giving unconfirmed AIQ buy signals appears to the left of the hyphen and the percentage of stocks giving unconfirmed AIQ sell signals appears on the right side of the hyphen. As of Friday February 5th, 2010, of the stocks giving unconfirmed signals, 93% are on the buy side and 7% are on the sell side.
To open the Market Log report, go to Reports and double-click Summary Reports and then Market Log. It is important to keep in mind that AIQ Expert Ratings fire against the trend. As the market declines, the percentage of stocks giving unconfirmed AIQ buy signals increases. As the market rallies, few stocks give buy signals and more stocks register sell signals. The US score serves as an overbought/oversold indicator for the market. That is, when the US score shows 85% or more on the buy side, then that implies the market has recently experienced a sharp decline, is oversold, and due for a rally. Conversely, when the US score shows 85% or more on the sell side, then the market has rallied and is overbought.
Some AIQ users immediately enter the market when the US score moves to 85% or more on the buy side. They exit anytime the US score is 85% or more on the sell side. I don’t recommend this approach because the market can stay overbought or oversold for quite some time. Instead, it may be best to wait for a trend-following indicator such as the Directional Movement Index to confirm the new trend direction.
Rather than using the US score as a strict market timing model, use it as a simple tool to keep your emotions in check. It helps you avoid buying high or selling low. Here is the rule: Don’t turn bearish on the market and sell positions when the US score shows 85% or more buy signals. Similarly, never turn bullish or add positions when the US score shows 85% or more sell signals.
The rule sounds simple but your emotions will tell you otherwise. When the US score has a high percentage of buy signals, the market has fallen and news reports are gloomy. That’s when your emotions tell you to bail. You may be selling right at a low, however. You either should have already sold or you should wait until the market rallies enough to where the US score is no longer giving a bullish reading.
When the market rallies it gets easier to buy. News reports are better and you think you may miss a big rally if you don’t immediately buy. Your emotions tell you to buy more but the US score can counteract your emotions. Don’t buy until the market pulls back enough to bring the US score out of bearish territory. Preferably, wait until the US score turns bullish.
Feb 5, 2010 | Uncategorized
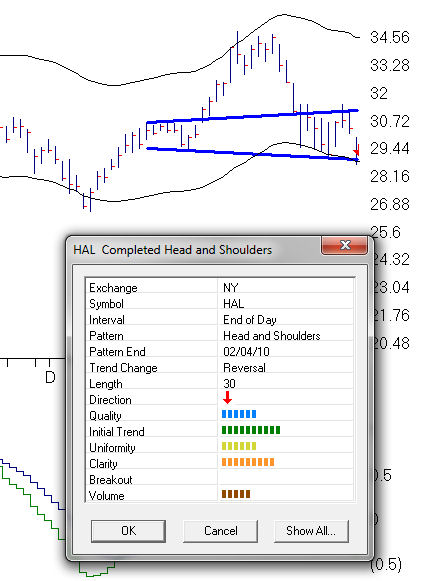
11 head and shoulder patterns show completing in SP1500 last night. Halliburton [HAL] breaking down below the neckline today. $28.11 at 3:30 eastern
Feb 4, 2010 | Uncategorized
In bull markets everyone suddenly becomes an expert when their investments appreciate. What a marvelous turn of events. It is however that small segment of traders who have traded both sides of the divide using an informed trading procedure that will appreciate the irony of having the Midas touch.
The kind of protégés the bull market produces are deluded into believing in their rapidly acquired expertise, while engaging in the rampant growth investing demanded by Efficient Markets Theory. They are deprived of any opportunity to undertake any fundamental analysis to speak of, and a rarely called upon to exercise any discipline. Their clearly profitable trading process will most likely avoid review.
Security of property and resources is fundamental to Maslow’s Hierarchy of Needs, and in the pursuit of self interest, a human being will rarely find anything remotely attractive about a loss. Still, the inability to appreciate something ought not to be determinant of its existence, and a small loss will most definitely endure to be preferred over a large one.
Ultimately, no one participant is bigger than the market however, some individuals such as Warren Buffet standout with alarmingly consistent success. In response to how he became so wealthy A.J. Rockefeller merely replied ‘I guess I took my profits too soon’. The premise that traders such as these are simply lucky is ludicrous.
Integral to a trader’s systemic process is self realization. Unless traders can identify Maslow’s Hierarchy at work in themselves, they will be at continual risk of the inherent emotion that the Market feeds upon. For this reason, a non-reflective person will provide an easy target in the routine short covering rally, or the institutional sell-off that triggers all but the Governor’s stop loss order. Greed will cause such a person to watch a profitable position dissolve and crystallize into a loss; a traumatizing experience. Similarly, when looking into the abyss of capital loss, rather than finding character, such a person finds the fortitude to demand their preferred exit price. In the face of a disastrous inflation figure or even a war, this is the kind of stuff that nightmares are made off.
When a trader knows themselves, and caters for their idiosyncratic limitations within a considered trading process, they will find that taking responsibility for that process and the decisions therein, actually sets one free – free to trade again with undivided attention. When taking a loss, take it all at once, it only hurts for a little while.
Feb 4, 2010 | trading strategies
In bull markets everyone suddenly becomes an expert when their investments appreciate. What a marvelous turn of events. It is however that small segment of traders who have traded both sides of the divide using an informed trading procedure that will appreciate the irony of having the Midas touch.
The kind of protégés the bull market produces are deluded into believing in their rapidly acquired expertise, while engaging in the rampant growth investing demanded by Efficient Markets Theory. They are deprived of any opportunity to undertake any fundamental analysis to speak of, and a rarely called upon to exercise any discipline. Their clearly profitable trading process will most likely avoid review.
Security of property and resources is fundamental to Maslow’s Hierarchy of Needs, and in the pursuit of self interest, a human being will rarely find anything remotely attractive about a loss. Still, the inability to appreciate something ought not to be determinant of its existence, and a small loss will most definitely endure to be preferred over a large one.
Ultimately, no one participant is bigger than the market however, some individuals such as Warren Buffet standout with alarmingly consistent success. In response to how he became so wealthy A.J. Rockefeller merely replied ‘I guess I took my profits too soon’. The premise that traders such as these are simply lucky is ludicrous.
Integral to a trader’s systemic process is self realization. Unless traders can identify Maslow’s Hierarchy at work in themselves, they will be at continual risk of the inherent emotion that the Market feeds upon. For this reason, a non-reflective person will provide an easy target in the routine short covering rally, or the institutional sell-off that triggers all but the Governor’s stop loss order. Greed will cause such a person to watch a profitable position dissolve and crystallize into a loss; a traumatizing experience. Similarly, when looking into the abyss of capital loss, rather than finding character, such a person finds the fortitude to demand their preferred exit price. In the face of a disastrous inflation figure or even a war, this is the kind of stuff that nightmares are made off.
When a trader knows themselves, and caters for their idiosyncratic limitations within a considered trading process, they will find that taking responsibility for that process and the decisions therein, actually sets one free – free to trade again with undivided attention. When taking a loss, take it all at once, it only hurts for a little while.


