Nov 11, 2013 | Uncategorized
In “Reversing MACD: The Sequel” in the November 2013 issue of Stocks and Commodities, author Johnny Dough presents functions that return price values for the MACD indicators. I am providing AIQ code for the following functions based on the AmiBroker code given in Dough’s article:
- PMACDsignal returns price where the MACD crosses its signal line or where there is an MACD histogram cross of the zero line
- PMACDlevel returns price where the MACD is equal to the level value
- PMACDeq returns price where the MACD is equal to the previous bar MACD.
I created some additional rules to show reports that display the price values of the functions:
- The ShowValues rule will display all function values for stocks that are over the minPrice level input
- The NearXO rule will list only those stocks that are less than or equal to the average range percentage of crossing over of the MACD oscillator
- The PMACxup rule lists cross-ups today on the MACD oscillator using the PMACDsignal price
- The PMACxdn “if” rule lists cross-downs today on the MACD oscillator using the PMACDsignal price.
The NearXO report is useful if you want to enter a position on a buy or sell stop-on-close when the MACD oscillator crosses zero. This report sorts by the MACD oscillator. The ones with a positive MACD oscillator amounts calculate the price that would be used to go short at the close for a cross-down on the oscillator. The ones with negative MACD oscillator amounts calculate the price that would be used to go long at the close for a cross-up on the oscillator.
I ran the NearXO report on September 10, 2013 using the NASDAQ 100 list of stocks. There were 12 that showed up on the report, meaning they were near a cross-up or cross-down of the MACD oscillator.
In Figure 5, I show a chart of Qiagen NV (QGEN), which appeared on the report. The report showed that a next day’s close price of 20.72 or higher would cause the MACD oscillator to go from negative to positive. On September 11, 2013, QGEN closed at 20.98 and the MACD oscillator moves to a positive number.
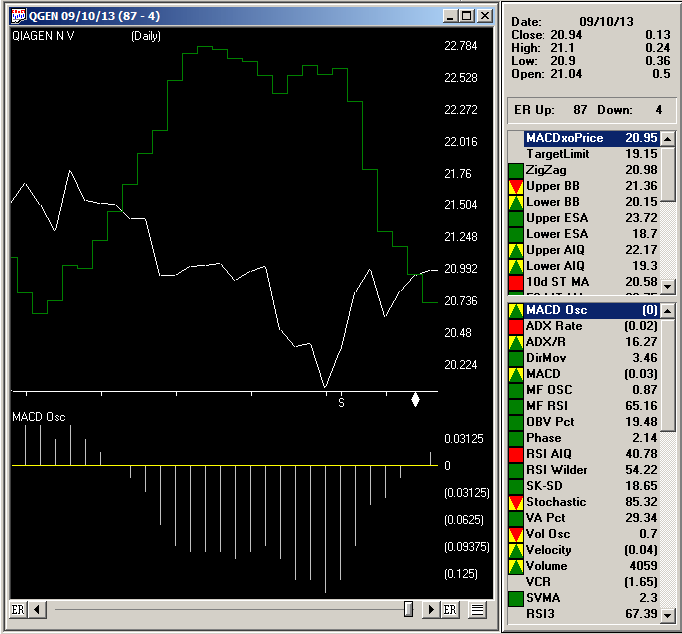
FIGURE 5: AIQ. Here’s a sample chart of QGEN with the MACD oscillator, looking for closing price (white line) and price to make a cross up or cross down on the oscillator (dark green line).
The AIQ code and EDS file can be downloaded from www.TradersEdgeSystems.com/traderstips.htm.
!REVERSING MACD: THE SEQUEL
!Author: Johnny Dough, TASC November 2013
!Coded by: Richard Denning 9/9/2013
!www.TradersEdgeSystems.com
!INPUTS:
price is [close].
period_X is 12.
period_Y is 25.
period_Z is 9.
level is 0.
minPrice is 10.
rangeFactor is 1.
!PMACDsignal returns price where MACD crosses signal line
! or MACD histogram cross of 0:
alphaX is 2 / ( 1 + period_X ).
alphaY is 2 / ( 1 + period_Y ).
alphaZ is 2 / ( 1 + period_Z ).
One_alphaX is 1 – alphaX.
One_alphaY is 1 – alphaY.
One_alphaZ is 1 – alphaZ.
MACDvalue is expavg( price, period_X ) – expavg( price, period_Y ).
MACDvalue_1 is valresult(MACDvalue,1).
MACDsignal is expavg( MACDvalue, period_Z ).
PMACDsignal is ( MACDsignal – expavg( price, period_X ) * one_alphaX
+ expavg( price, period_Y ) * one_alphaY ) / ( alphaX – alphaY ).
!PMACDlevel returns price where MACD is equal to level value
! e.g. PMACDlevel(0, C, 12, 16) would return the series
! where next price would make MACD=0
PMACDlevel is (Level + expavg( price, period_Y ) * one_alphaY
– expavg( price, period_X )* one_alphaX ) / ( alphaX – alphaY ).
!PMACDeq returns price where MACD is equal to previous bar MACD
PMACDeq is ( expavg( price, period_X ) * alphaX
– expavg( price, period_Y )* alphaY ) / ( alphaX – alphaY ).
!ADDITIONAL CODE NOT PROVIDED BY AUTHOR:
PMACDsignal_1 is valresult(PMACDsignal,1). !PLOT-OFFSET BY ONE DAY
MACDosc_1 is val([MACD osc],1). !Prior day’s MACD oscillator value
!RULES FOR GENERATING REPORTS:
PMACxup if price > PMACDsignal_1
and valrule(price <= PMACDsignal_1,1) and price > minPrice.
PMACxdn if price < PMACDsignal_1
and valrule(price >= PMACDsignal_1,1) and price > minPrice.
PMACDsigPct is (PMACDsignal / [close] – 1) * 100.
AvgRangePct is simpleavg(([high]/[low]-1)*100,200).
NearXO if price > minPrice and abs(PMACDsigPct) <= AvgRangePct*rangeFactor.
ShowValues if price > minPrice.
—Richard Denning
info@TradersEdgeSystems.com
for AIQ Systems
Nov 11, 2013 | indicators, MACD, trading strategies
In “Reversing MACD: The Sequel” in the November 2013 issue of Stocks and Commodities, author Johnny Dough presents functions that return price values for the MACD indicators. I am providing AIQ code for the following functions based on the AmiBroker code given in Dough’s article:
-
PMACDsignal returns price where the MACD crosses its signal line or where there is an MACD histogram cross of the zero line
-
PMACDlevel returns price where the MACD is equal to the level value
-
PMACDeq returns price where the MACD is equal to the previous bar MACD.
I created some additional rules to show reports that display the price values of the functions:
- The ShowValues rule will display all function values for stocks that are over the minPrice level input
- The NearXO rule will list only those stocks that are less than or equal to the average range percentage of crossing over of the MACD oscillator
- The PMACxup rule lists cross-ups today on the MACD oscillator using the PMACDsignal price
- The PMACxdn “if” rule lists cross-downs today on the MACD oscillator using the PMACDsignal price.
The NearXO report is useful if you want to enter a position on a buy or sell stop-on-close when the MACD oscillator crosses zero. This report sorts by the MACD oscillator. The ones with a positive MACD oscillator amounts calculate the price that would be used to go short at the close for a cross-down on the oscillator. The ones with negative MACD oscillator amounts calculate the price that would be used to go long at the close for a cross-up on the oscillator.
I ran the NearXO report on September 10, 2013 using the NASDAQ 100 list of stocks. There were 12 that showed up on the report, meaning they were near a cross-up or cross-down of the MACD oscillator.
In Figure 5, I show a chart of Qiagen NV (QGEN), which appeared on the report. The report showed that a next day’s close price of 20.72 or higher would cause the MACD oscillator to go from negative to positive. On September 11, 2013, QGEN closed at 20.98 and the MACD oscillator moves to a positive number.
FIGURE 5: AIQ. Here’s a sample chart of QGEN with the MACD oscillator, looking for closing price (white line) and price to make a cross up or cross down on the oscillator (dark green line).
The AIQ code and EDS file can be downloaded from www.TradersEdgeSystems.com/traderstips.htm.
!REVERSING MACD: THE SEQUEL
!Author: Johnny Dough, TASC November 2013
!Coded by: Richard Denning 9/9/2013
!www.TradersEdgeSystems.com
!INPUTS:
price is [close].
period_X is 12.
period_Y is 25.
period_Z is 9.
level is 0.
minPrice is 10.
rangeFactor is 1.
!PMACDsignal returns price where MACD crosses signal line
! or MACD histogram cross of 0:
alphaX is 2 / ( 1 + period_X ).
alphaY is 2 / ( 1 + period_Y ).
alphaZ is 2 / ( 1 + period_Z ).
One_alphaX is 1 – alphaX.
One_alphaY is 1 – alphaY.
One_alphaZ is 1 – alphaZ.
MACDvalue is expavg( price, period_X ) – expavg( price, period_Y ).
MACDvalue_1 is valresult(MACDvalue,1).
MACDsignal is expavg( MACDvalue, period_Z ).
PMACDsignal is ( MACDsignal – expavg( price, period_X ) * one_alphaX
+ expavg( price, period_Y ) * one_alphaY ) / ( alphaX – alphaY ).
!PMACDlevel returns price where MACD is equal to level value
! e.g. PMACDlevel(0, C, 12, 16) would return the series
! where next price would make MACD=0
PMACDlevel is (Level + expavg( price, period_Y ) * one_alphaY
– expavg( price, period_X )* one_alphaX ) / ( alphaX – alphaY ).
!PMACDeq returns price where MACD is equal to previous bar MACD
PMACDeq is ( expavg( price, period_X ) * alphaX
– expavg( price, period_Y )* alphaY ) / ( alphaX – alphaY ).
!ADDITIONAL CODE NOT PROVIDED BY AUTHOR:
PMACDsignal_1 is valresult(PMACDsignal,1). !PLOT-OFFSET BY ONE DAY
MACDosc_1 is val([MACD osc],1). !Prior day’s MACD oscillator value
!RULES FOR GENERATING REPORTS:
PMACxup if price > PMACDsignal_1
and valrule(price <= PMACDsignal_1,1) and price > minPrice.
PMACxdn if price < PMACDsignal_1
and valrule(price >= PMACDsignal_1,1) and price > minPrice.
PMACDsigPct is (PMACDsignal / [close] – 1) * 100.
AvgRangePct is simpleavg(([high]/[low]-1)*100,200).
NearXO if price > minPrice and abs(PMACDsigPct) <= AvgRangePct*rangeFactor.
ShowValues if price > minPrice.
—Richard Denning
info@TradersEdgeSystems.com
for AIQ Systems
Nov 6, 2013 | Uncategorized
This post is more of an FYI than a specific call to action, still a reasonably good trend is a reasonably good trend.
As many investors know by now the November 1st into May time period has historically been very good for the stock market. One of the better performing sectors during this time period has tended to be the semiconductor/electronics sectors. Among tickers worthy of analysis are:
-FSELX (Fidelity Select Electronics mutual fund)
-SMH (HOLDRs Semiconductor ETF)
In a nutshell, the semiconductor/electronics sectors tend to perform well between October 31st and April 30th. The results for FSELX since October 1994 appear in Figure 1.
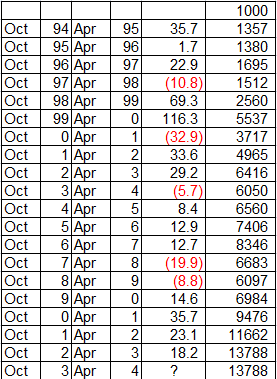
Figure 1 – FSELX Performance October 31 to April 30
A chart of the annual growth of $1,000 appears in Figure 2.
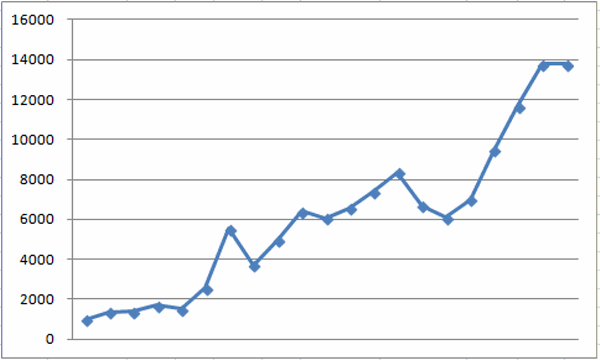
Figure 2 – $1,000 invested in FSELX 10/31 through 4.30 since 10/1994
In a nutshell:
-FSELX has been up 14 times (74%) and down 5 times (26%).
-The average gain was +18.7% and the median gain was +13.7%.
-The worst declines were -32.9% during 2000 to 2001 and -19.9% during 2007 to 2008, so remember that there is definitely risk involved
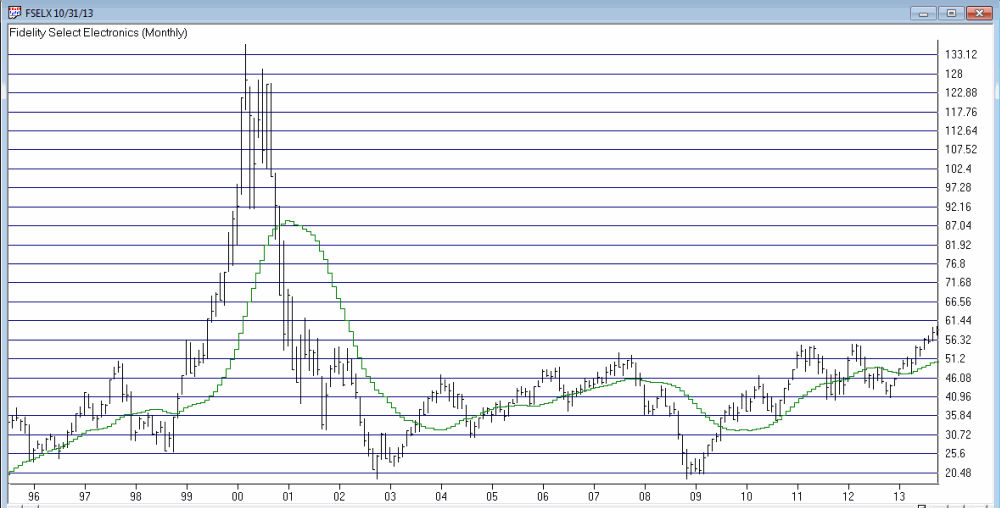 Figure 3 – Fidelity Select Electronics (Ticker FSELX) (Courtesy: AIQ TradingExpert)
Summary
Please do not read this post and think “Aha, semiconductor/electronic stocks are sure to rally.” That is not the implication I am trying to make. Simply remember that the “trend is your friend” and that this sector tends to perform well during this time period. As long as these stocks act well it may be wise to give the bullish case the benefit of the doubt.
ay Kaeppel
Chief Market Analyst at JayOnTheMarkets.com and AIQ TradingExpert Pro (http://aiq.com) client
Jay has published four books on futures, option and stock trading. He was Head Trader for a CTA from 1995 through 2003. As a computer programmer, he co-developed trading software that was voted “Best Option Trading System” six consecutive years by readers of Technical Analysis of Stocks and Commodities magazine. A featured speaker and instructor at live and on-line trading seminars, he has authored over 30 articles in Technical Analysis of Stocks and Commodities magazine, Active Trader magazine, Futures & Options magazine and on-line at www.Investopedia.com.
Nov 6, 2013 | Seasonality, sector funds, trading strategies
This post is more of an FYI than a specific call to action, still a reasonably good trend is a reasonably good trend.
As many investors know by now the November 1st into May time period has historically been very good for the stock market. One of the better performing sectors during this time period has tended to be the semiconductor/electronics sectors. Among tickers worthy of analysis are:
-FSELX (Fidelity Select Electronics mutual fund)
-SMH (HOLDRs Semiconductor ETF)
In a nutshell, the semiconductor/electronics sectors tend to perform well between October 31st and April 30th. The results for FSELX since October 1994 appear in Figure 1.
Figure 1 – FSELX Performance October 31 to April 30
A chart of the annual growth of $1,000 appears in Figure 2.
Figure 2 – $1,000 invested in FSELX 10/31 through 4.30 since 10/1994
In a nutshell:
-FSELX has been up 14 times (74%) and down 5 times (26%).
-The average gain was +18.7% and the median gain was +13.7%.
-The worst declines were -32.9% during 2000 to 2001 and -19.9% during 2007 to 2008, so remember that there is definitely risk involved
Figure 3 – Fidelity Select Electronics (Ticker FSELX) (Courtesy: AIQ TradingExpert)
Summary
Please do not read this post and think “Aha, semiconductor/electronic stocks are sure to rally.” That is not the implication I am trying to make. Simply remember that the “trend is your friend” and that this sector tends to perform well during this time period. As long as these stocks act well it may be wise to give the bullish case the benefit of the doubt.
ay Kaeppel
Chief Market Analyst at JayOnTheMarkets.com and AIQ TradingExpert Pro (http://aiq.com) client
Jay has published four books on futures, option and stock trading. He was Head Trader for a CTA from 1995 through 2003. As a computer programmer, he co-developed trading software that was voted “Best Option Trading System” six consecutive years by readers of Technical Analysis of Stocks and Commodities magazine. A featured speaker and instructor at live and on-line trading seminars, he has authored over 30 articles in Technical Analysis of Stocks and Commodities magazine, Active Trader magazine, Futures & Options magazine and on-line at www.Investopedia.com.
Nov 1, 2013 | Uncategorized
A lot of U.S investors have come to realize in recent years that there are many trading opportunities outside the USA. This creates something of a bad news, good news, bad news, good news situation.
-The bad news is that picking individual stocks is never an easy thing even if you focus only on domestic U.S. companies. For the average investor to successfully pick and choose among individual stocks around the globe is simply too much to expect.
-The good news is that the proliferation of international ETFs – Single country funds, regional funds, global funds, etc. – has made it much easier for investors to diversify across the globe than it used to be.
-The bad news is that the proliferation of ETFs has also reached a point where choosing an international ETF is getting to be almost as confusing as choosing a phone plan.
-The good news is that there are ways to simplify and systematize things.
So let’s take a look at “one way” to play the international stocks game.
BRIC vs. SPX
BRIC refers to an index comprised of stocks from Brazil, Russia, India and China. For the purposes of this article I will demonstrate a simple method for switching between BRIC and the S&P 500 Index.
The Vehicles:
For calculating switches I will use:
1) An index I created using AIQ TradingExpert. I refer to it as BRICINDX and it is comprised of single-country ETF tickers EWZ (Brazil), RSX (Russia), INP (India) and FXI (China).
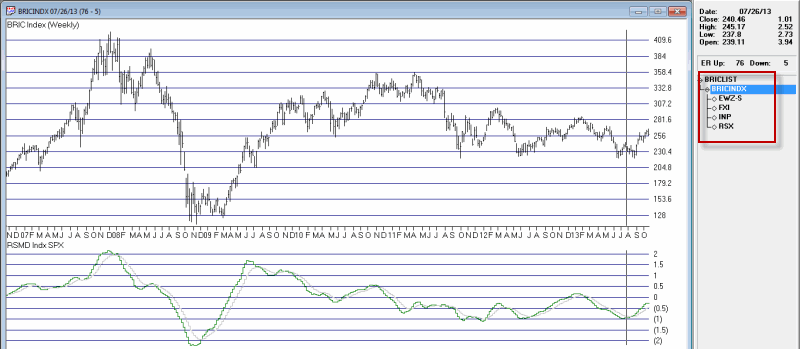
Figure 1 – Jay’s BRICINDEX
2) Ticker SPX (i.e., the S&P 50 Index)
For actual trading purposes there are a few choices that I will discuss a little later.
The Method:
I will use a method I learned a long time ago from David Vomund, President of Vomund Investment Management, LLC and the author of “ETF Strategies Revealed.” The measure calculates the relative strength between two assets on a weekly basis. When the trend of relative strength reverses in a particular direction for two consecutive weeks it signals a switch into the stronger index.
The Test:
We start our test on 10/26/01 simple because that is the first time we can get a good reading using back data. Each week we look at the relative strength of my BRICINDX versus the S&P 500 Index (ticker SPX). If the RSMD rises for two consecutive weeks we want to switch into the BRICINDX and if the RSMD declines for two consecutive weeks we want to switch into the S&P 500 Index.
Figure 2 displays the switches over the past several years.
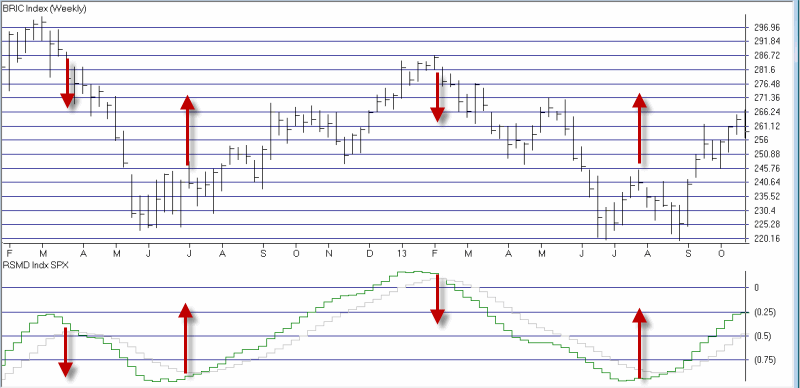
Figure 2 – BRICINDEX (vs. SPX; lower clip)
When an “Up” arrow occurs in Figure 2, the system switches into BRICINDX, when a “Down” arrow occurs in Figure 2 the system switches into ticker SPY. The results of this “System” are displayed in Figure 3. Note the two columns at the far right:
Switch: The growth of $1,000 using the system
Split: The growth of $1,000 split evenly between BRICINDX and SPY.
|
|
|
BRIC |
SPY |
Switch |
Split |
Switch |
Split |
| Date |
Date |
Index |
%+(-) |
%+(-) |
%+(-) |
%+(-) |
$1,000 |
$1,000 |
| 10/26/01 |
2/8/02 |
BRIC |
20.9 |
3.7 |
20.9 |
12.3 |
1,209 |
1,123 |
| 2/8/02 |
2/22/02 |
SPY |
13.9 |
0.0 |
0.0 |
7.0 |
1,209 |
1,201 |
| 2/22/02 |
5/10/02 |
BRIC |
(12.6) |
(3.2) |
(12.6) |
(7.9) |
1,057 |
1,106 |
| 5/10/02 |
7/19/02 |
SPY |
(25.0) |
(23.8) |
(23.8) |
(24.4) |
806 |
837 |
| 7/19/02 |
8/2/02 |
BRIC |
(14.1) |
1.9 |
(14.1) |
(6.1) |
692 |
786 |
| 8/2/02 |
11/1/02 |
SPY |
(0.8) |
8.8 |
8.8 |
4.0 |
753 |
817 |
| 11/1/02 |
6/27/03 |
BRIC |
45.0 |
7.1 |
45.0 |
26.0 |
1,091 |
1,030 |
| 6/27/03 |
8/29/03 |
SPY |
18.3 |
5.3 |
5.3 |
11.8 |
1,000 |
1,000 |
| 8/29/03 |
11/14/03 |
BRIC |
10.9 |
2.1 |
10.9 |
6.5 |
1,109 |
1,065 |
| 11/14/03 |
12/12/03 |
SPY |
11.9 |
2.5 |
2.5 |
7.2 |
1,137 |
1,142 |
| 12/12/03 |
1/23/04 |
BRIC |
16.4 |
7.7 |
16.4 |
12.1 |
1,324 |
1,280 |
| 1/23/04 |
7/2/04 |
SPY |
(18.5) |
(3.4) |
(3.4) |
(10.9) |
1,279 |
1,140 |
| 7/2/04 |
11/5/04 |
BRIC |
29.0 |
4.7 |
29.0 |
16.8 |
1,650 |
1,331 |
| 11/5/04 |
12/3/04 |
SPY |
9.0 |
1.8 |
1.8 |
5.4 |
1,679 |
1,403 |
| 12/3/04 |
12/31/04 |
BRIC |
(0.2) |
0.9 |
(0.2) |
0.3 |
1,675 |
1,408 |
| 12/31/04 |
2/11/05 |
SPY |
5.4 |
0.3 |
0.3 |
2.9 |
1,681 |
1,449 |
| 2/11/05 |
3/25/05 |
BRIC |
(4.3) |
(2.8) |
(4.3) |
(3.5) |
1,609 |
1,398 |
| 3/25/05 |
7/1/05 |
SPY |
8.1 |
2.7 |
2.7 |
5.4 |
1,653 |
1,473 |
| 7/1/05 |
10/21/05 |
BRIC |
13.9 |
(0.4) |
13.9 |
6.7 |
1,882 |
1,572 |
| 10/21/05 |
1/13/06 |
SPY |
18.3 |
7.6 |
7.6 |
12.9 |
2,024 |
1,776 |
| 1/13/06 |
3/17/06 |
BRIC |
9.6 |
1.6 |
9.6 |
5.6 |
2,219 |
1,876 |
| 3/17/06 |
4/28/06 |
SPY |
9.0 |
(0.0) |
(0.0) |
4.5 |
2,219 |
1,961 |
| 4/28/06 |
5/26/06 |
BRIC |
(13.5) |
(3.3) |
(13.5) |
(8.4) |
1,920 |
1,796 |
| 5/26/06 |
8/4/06 |
SPY |
9.2 |
1.5 |
1.5 |
5.4 |
1,948 |
1,892 |
| 8/4/06 |
9/1/06 |
BRIC |
2.1 |
2.9 |
2.1 |
2.5 |
1,988 |
1,939 |
| 9/1/06 |
10/20/06 |
SPY |
4.2 |
4.4 |
4.4 |
4.3 |
2,076 |
2,023 |
| 10/20/06 |
2/16/07 |
BRIC |
23.4 |
6.2 |
23.4 |
14.8 |
2,561 |
2,322 |
| 2/16/07 |
4/13/07 |
SPY |
5.2 |
0.5 |
0.5 |
2.8 |
2,573 |
2,387 |
| 4/13/07 |
8/17/07 |
BRIC |
5.0 |
(1.4) |
5.0 |
1.8 |
2,700 |
2,430 |
| 8/17/07 |
9/7/07 |
SPY |
11.2 |
0.8 |
0.8 |
6.0 |
2,722 |
2,576 |
| 9/7/07 |
12/21/07 |
BRIC |
35.8 |
2.4 |
35.8 |
19.1 |
3,696 |
3,067 |
| 12/21/07 |
4/25/08 |
SPY |
(9.3) |
(6.4) |
(6.4) |
(7.9) |
3,458 |
2,826 |
| 4/25/08 |
6/13/08 |
BRIC |
(3.0) |
(2.4) |
(3.0) |
(2.7) |
3,353 |
2,749 |
| 6/13/08 |
12/5/08 |
SPY |
(57.0) |
(35.5) |
(35.5) |
(46.2) |
2,164 |
1,478 |
| 12/5/08 |
6/26/09 |
BRIC |
53.1 |
5.4 |
53.1 |
29.3 |
3,314 |
1,911 |
| 6/26/09 |
10/2/09 |
SPY |
20.4 |
12.2 |
12.2 |
16.3 |
3,719 |
2,223 |
| 10/2/09 |
11/6/09 |
BRIC |
9.6 |
5.3 |
9.6 |
7.5 |
4,076 |
2,388 |
| 11/6/09 |
4/9/10 |
SPY |
5.6 |
9.3 |
9.3 |
7.5 |
4,454 |
2,567 |
| 4/9/10 |
4/23/10 |
BRIC |
(2.0) |
1.3 |
(2.0) |
(0.3) |
4,365 |
2,558 |
| 4/23/10 |
6/18/10 |
SPY |
(6.2) |
(8.2) |
(8.2) |
(7.2) |
4,008 |
2,374 |
| 6/18/10 |
11/19/10 |
BRIC |
11.7 |
7.9 |
11.7 |
9.8 |
4,475 |
2,606 |
| 11/19/10 |
3/11/11 |
SPY |
(0.1) |
8.2 |
8.2 |
4.0 |
4,843 |
2,712 |
| 3/11/11 |
5/6/11 |
BRIC |
(0.4) |
3.6 |
(0.4) |
1.6 |
4,823 |
2,755 |
| 5/6/11 |
6/10/11 |
SPY |
(1.9) |
(5.2) |
(5.2) |
(3.6) |
4,571 |
2,656 |
| 6/10/11 |
7/15/11 |
BRIC |
(1.7) |
2.3 |
(1.7) |
0.3 |
4,494 |
2,664 |
| 7/15/11 |
11/4/11 |
SPY |
(11.7) |
(3.3) |
(3.3) |
(7.5) |
4,344 |
2,463 |
| 11/4/11 |
12/16/11 |
BRIC |
(15.3) |
(4.7) |
(15.3) |
(10.0) |
3,678 |
2,216 |
| 12/16/11 |
1/20/12 |
SPY |
16.0 |
9.4 |
9.4 |
12.7 |
4,024 |
2,497 |
| 1/20/12 |
3/23/12 |
BRIC |
2.4 |
7.6 |
2.4 |
5.0 |
4,121 |
2,623 |
| 3/23/12 |
7/6/12 |
SPY |
(15.3) |
(4.4) |
(4.4) |
(9.9) |
3,938 |
2,363 |
| 7/6/12 |
2/1/13 |
BRIC |
17.5 |
10.5 |
17.5 |
14.0 |
4,628 |
2,694 |
| 2/1/13 |
7/26/13 |
SPY |
(15.2) |
12.7 |
12.7 |
(1.3) |
5,216 |
2,660 |
| 7/26/13 |
|
BRIC |
13.1 |
4.4 |
13.1 |
8.8 |
5,900 |
2,893 |
Figure 3 – BRICINDX vs. SPY
Figure 4 displays the trade-by-trade result in graphical form.
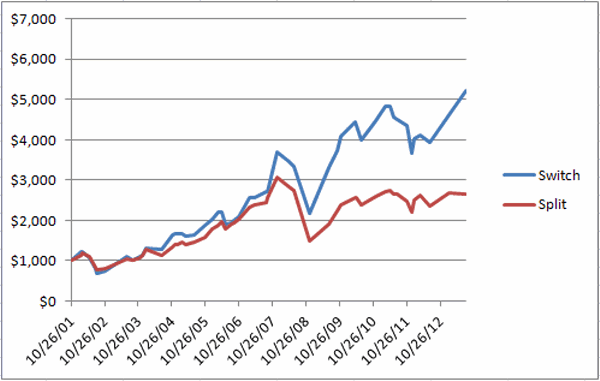
Figure 4 – Jay’s BRIC/SPY System (blue line) versus Split/Buy-and-Hold
A Few Performance Notes
-An investor who had split $1,000 between BRICINDX and SPY in 2001 would now have $2,893, a gain of 189.3%
-An investor who had utilized this switching system starting with $1000 in 2001 would now have $5,900, a gain of 490%.
So you clearly see the potential long-term benefit.
-Long-term is the key phrase. While the system clearly outperformed over time, over any trade or series of trades there is no guarantee that that will be the case.
-One other thing to note is that this particular system is allows long the stock market, either foreign or domestic. This means that if there is a global bear market (such as 2008) this system will suffer. Therefore, aggressive investors might consider building in some sort of market timing in order to avoid some of the downside.
A Few Trading Notes
For actual trading purposes a trader can emulate my BRICINDEX by splitting money between the four ETFs that comprise the index. There are other, easier alternatives including:
-Ticker VWO: Vanguard Emerging Markets ETF does not track these four funds exactly but has a correlation of roughly 97% with the BRICINDX and enjoys active trading volume.
-Ticker BKF: iShares BRIC Index Fund is the fund most closely correlated to my BRICINDX, however, trading is very thin.
-Ticker DXELX: This is the Direxion 2x leveraged Emerging Markets open end mutual fund. The leverage creates more profit potential (with commensurate downside risk) and this is a good choice for someone who would rather trade a standard mutual fund than an ETF.
-Ticker EDC: I am leery of 3x leveraged ETFs, but someone looking to “go for the gusto”, -Direxion Emerging Markets 3x ETF offers a lot of upside potential (but also a great deal of downside risk)
Summary
The “system” I’ve detailed here isn’t necessarily something that you should rush out and start trading right this very minute. Still, it does illustrate a few things:
-It is possible to “beat the market” (in this case, the “market” is defined as a portfolio evenly split between foreign and domestic stock indexes) over time using a mechanical approach.
-It is possible to profit from global stock market trends without becoming an expert in Chinese stocks or Russian stocks (or whatever country’s stocks).
-Demonstrating the discipline to follow an objective approach to investing is one of the keys to long-term success.
All in all it’s just another, well, you can sing the rest of it yourself……
Jay Kaeppel
Chief Market Analyst at JayOnTheMarkets.com and AIQ TradingExpert Pro (http://aiq.com) client
Jay has published four books on futures, option and stock trading. He was Head Trader for a CTA from 1995 through 2003. As a computer programmer, he co-developed trading software that was voted “Best Option Trading System” six consecutive years by readers of Technical Analysis of Stocks and Commodities magazine. A featured speaker and instructor at live and on-line trading seminars, he has authored over 30 articles in Technical Analysis of Stocks and Commodities magazine, Active Trader magazine, Futures & Options magazine and on-line at www.Investopedia.com.

 English