
Advance-Decline data is calculated from daily issues reported on the New York Stock exchange. The Basic formula for calculating the Advance-Decline is the difference between the number of Advancing Issues and the number of Declining Issues per day, and adding it to or subtracting it from the previous day’s total.
In simple terms, the AdvanceDecline Line shows the direction in which the majority of stocks are headed. In a more important sense, it can show whether buying enthusiasm during a rally is spread across a broad number of stocks (a positive indication), or whether buying is narrowly focused on just a few industry groups or sectors (a generally negative sign).
An Advance-Decline Line is a contract/expanding/short-term market indicator. It is also referred to as an “order of magnitude” indicator because it provides a quick estimate of the market’s internal strength by showing how the overall market (or a specific sector) is trading in relation to a moving average.
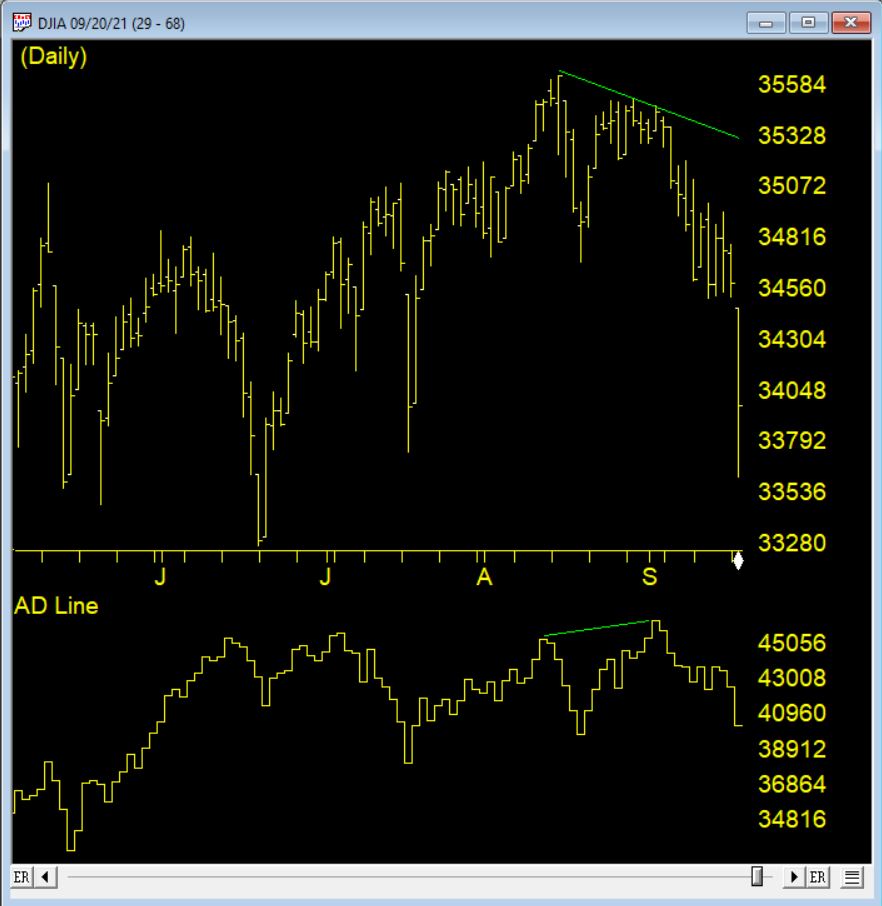
One of the most popular ways of judging the market strength of the overall market is by using the advancedecline line (ADVs), also known as the “AD Line.” This metric is calculated by subtracting the number of decliners from the number of advancers in a market index. During a strong bull market (when a bull market begins), an AD line that is rising indicates growing market breadth (better market breadth) and indicates that money is continuing to move into the market. Conversely, falling AD lines indicate shrinking market breadth (worse market breadth) and indicate that money is leaving the broader market.
Because of its elegant simplicity, and the valuable insights it has provided at market turning points, the AD Line has become a highly prized indicator by both fundamentalists and technicians throughout the decades. But, in recent years, something seems to have gone astray.
How could the time-tested Advance-Decline Line give off such obviously false signals? The answer is simple, but not easily seen. The change has occurred, not in the indicator, but in the data it measures. Over the past 3 decades, the New York Stock Exchange has allowed trading in a growing number of issues that are not, or do not trade like, domestic common stocks.
The truth is that most of the issues currently listed on the NYSE are not really stocks, at least not what investors generally define as stocks. Their inclusion has created turbulence in the sea of securities that has been amplified by the Advance-Decline Line. These stock-like issues include closed end funds (CEFs), American Depository Receipts (ADRs), and exchange-traded funds (ETFs).
In other words, the common stock components of the Advance-Decline Line offset one another, while the bond-related components were rising strongly, giving the Advance-Decline Line a positive bias. In other words, during those periods, the Advance-Decline Line was, in essence, measuring the strength of the bond market, not the stock market. It’s no wonder that the signals were misleading!