It’s the beginning of the month and time to check the seasonal patterns for July. First off some background.
Our study looks at 7 years of historical data and looks at the returns for all optionable stocks for the month of July from 2006 to 2013.
We filter to find two sets of criteria
– Stocks with gains in all 7 years during July
– Stocks with losses in all 7 years in July
We do make an assumption that the month is 21 trading days and work our way back from the last day of the month. July also has the July 4th holiday and a half day trading on July 3rd. if the last day of the month falls on a weekend, then we use the first trading day prior to that date.
We make no assumptions for drawdown, nor do we look at the fundamentals behind such a pattern. We do compare the stock to the market during the same period and look at the average SPY gain/loss vs. the average stock gain/loss. This helps filter out market influence.
Finally we look at the median gain/loss and look for statistical anomalies, like meteoric gains/loss in one year.
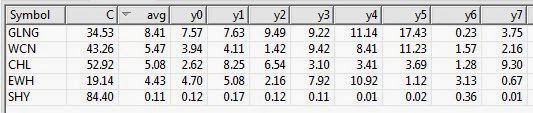
So here are the tickers that met the scan on the gain side, There was only 1 stock on the loss side. So we’ll look at the gainers only.

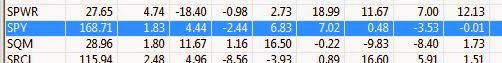
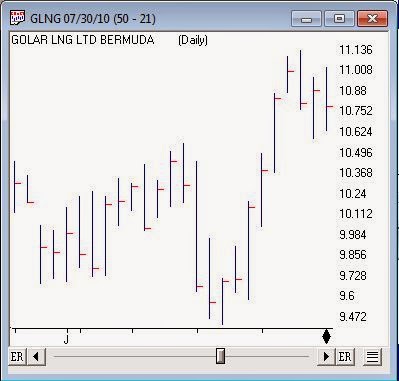
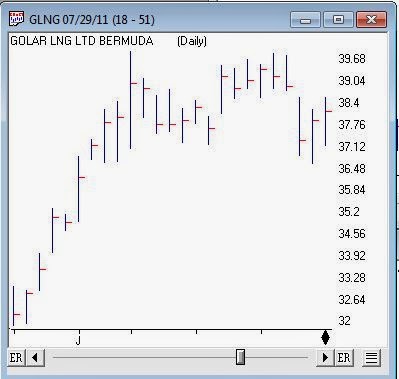
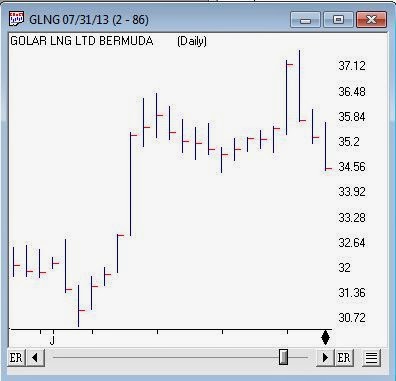
Figure 3 is a chart of GLNG seasonal pattern for the last 7 years in July. The solid black line is the average for the 7 years, these are percentage change day to day. Each line represents a prior year of GLNG.