TradingExpert Pro features
Exclusive UK Group/Sectors, Strategy creation and testing
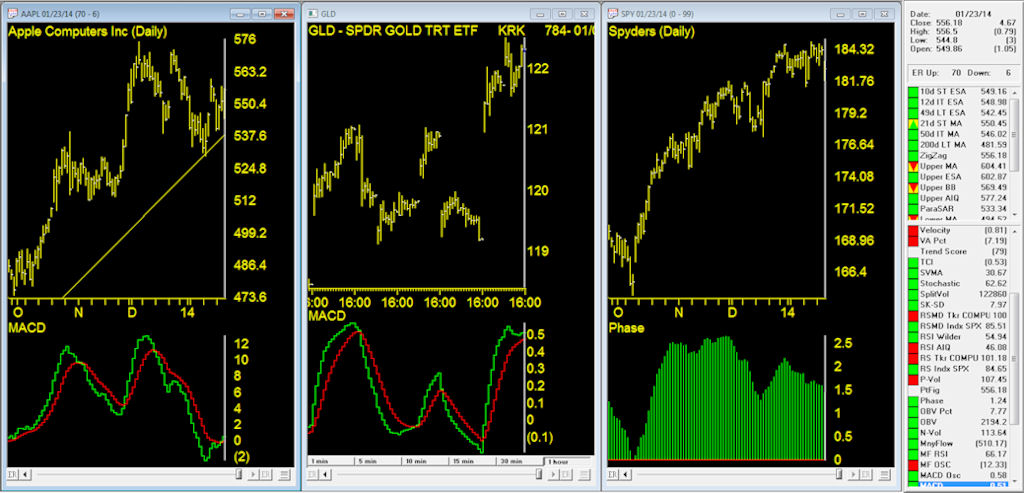
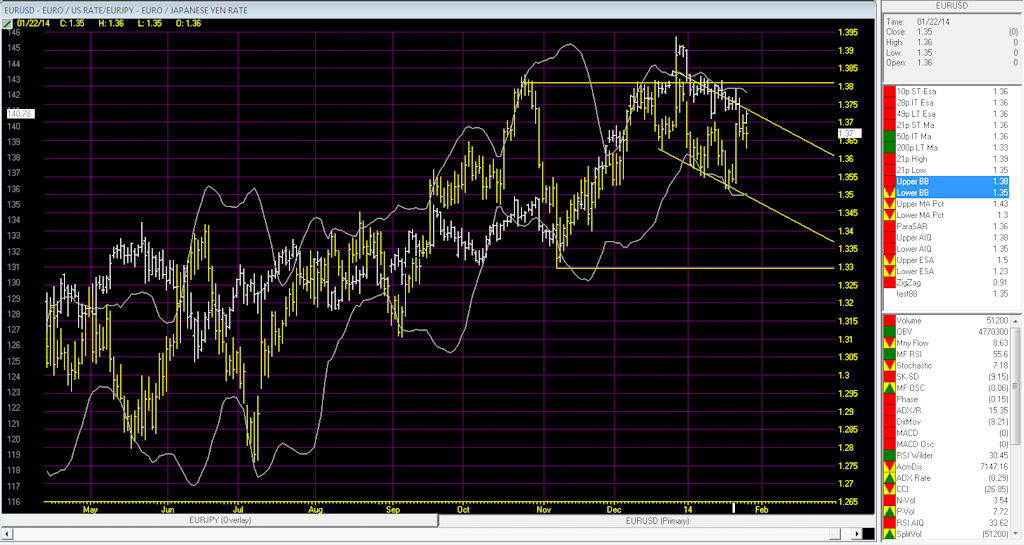
- State-of-the-art charting
- Market Timing
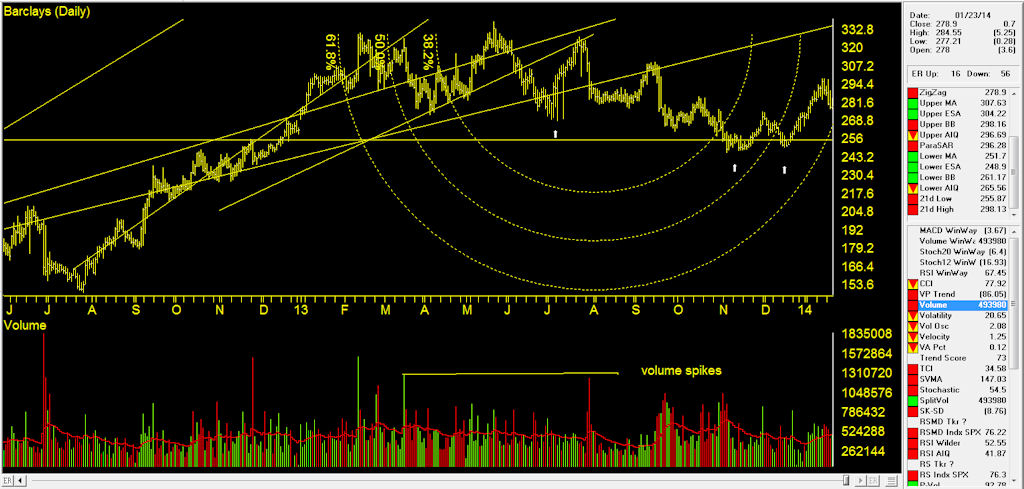
- Advanced drawing tools
- Spreads, overlays and zoom
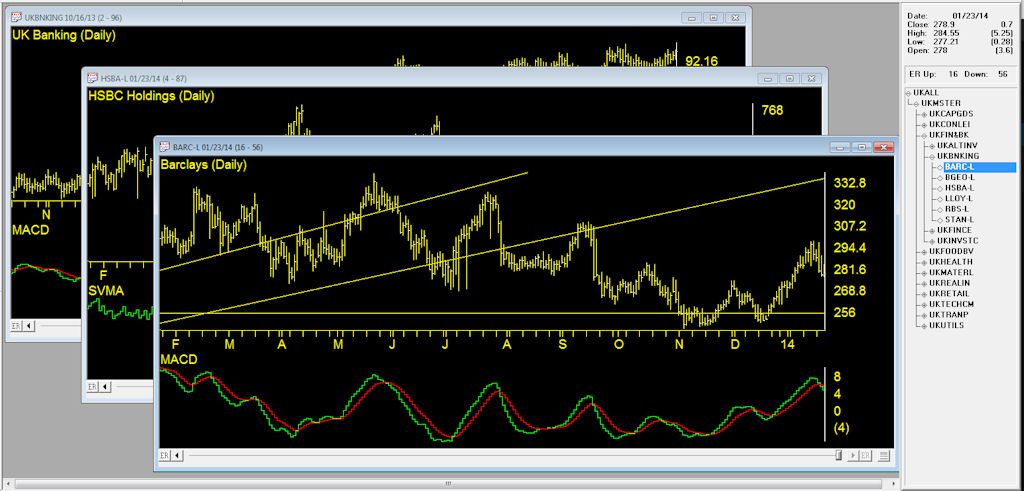
- Exclusive UK Groups/Sectors
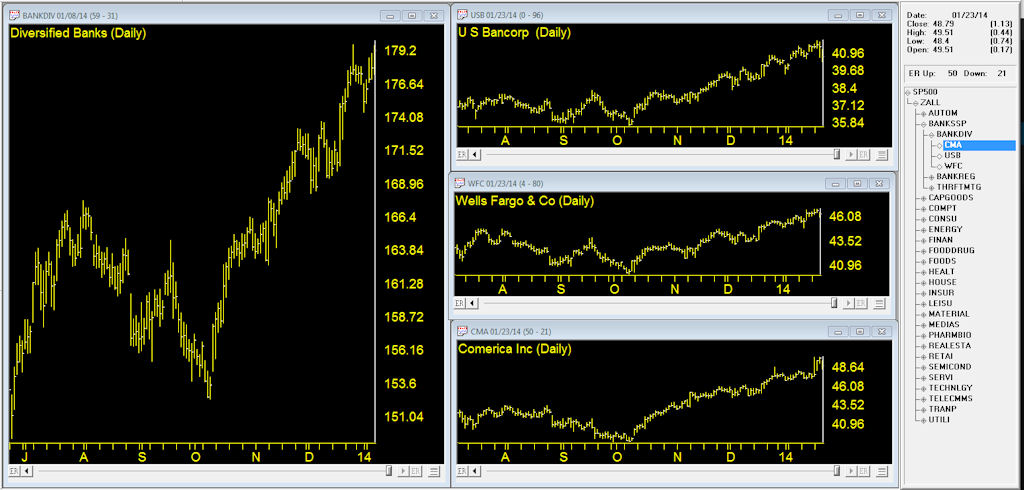
- Group and Sector Rotation
-
Stock charts, FOREX charts, Futures charts, candlesticks, daily, weekly
-
Unique color barometer with a snapshot of every indicator
-
Build lists of tickers to chart from simple to complex
-
Overlay one ticker on another
-
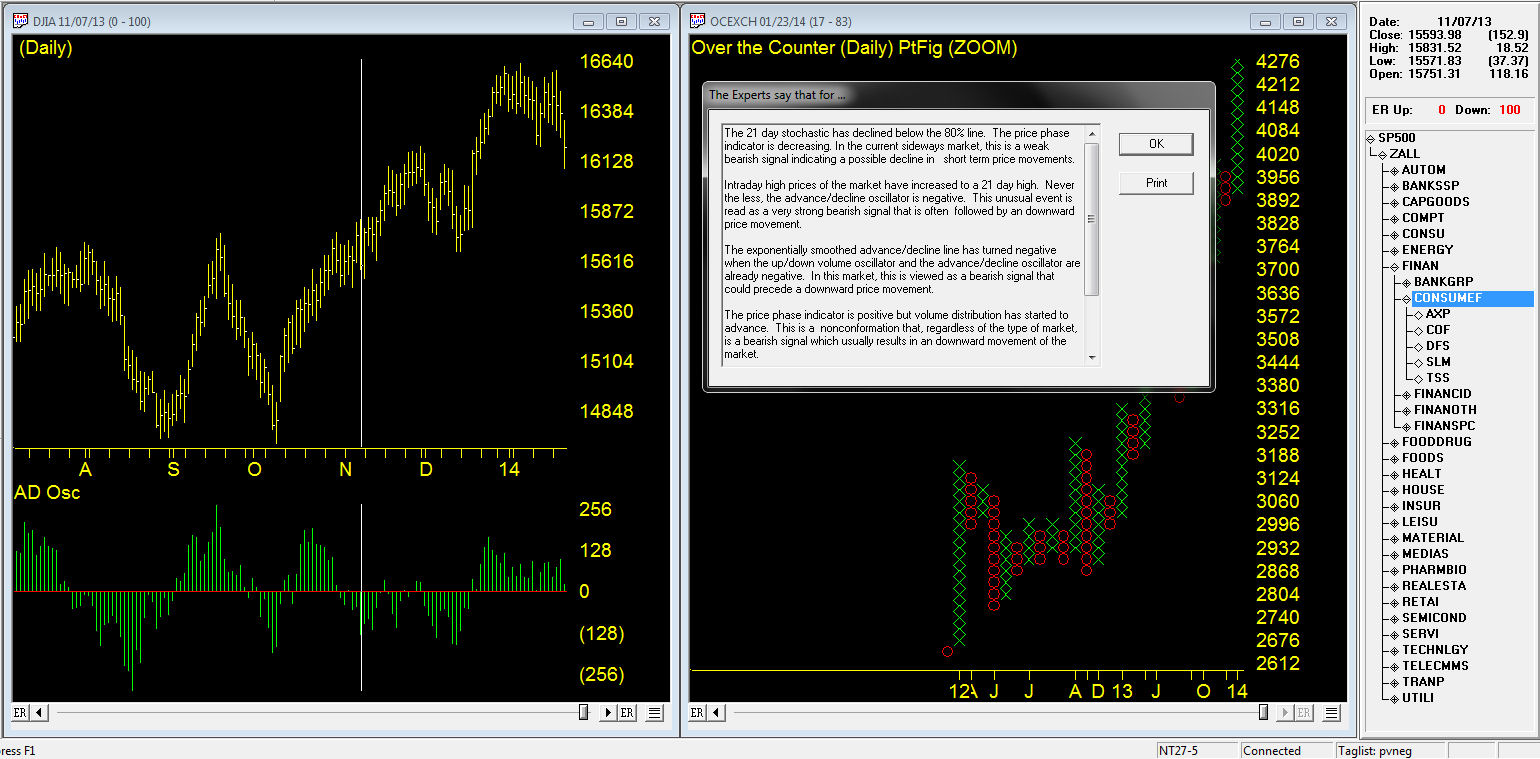
WinWay TradingExpert’s Market Timing uses hundreds of indicator-based rules running through an artificial intelligence-based inference engine to generate timely expert opinion on stock markets
The most advanced traders toolbox you’ll ever need
-
Trend lines
-
Parallel lines
-
Gann
-
Fibonacci
-
Regression
-
Add text and arrows
-
For close in analysis WinWay TradingExpert offers 2 types of zoom tool
-
Expanding drawing tools into the right hand side of the chart for what/if scenarios.
-
Add an overlay and then perform spread analysis between 2 stock charts, FOREX charts or Futures charts.
-
View charts of any of the UK350 stocks
-
One click from any of the UK350 stocks to view a chart of it’s industry group
-
One click from any of the 33 UK industry group charts to view it’s parent industry sector chart
-
Explore all the UK stock charts in a UK industry group with one click
-
Nothing compares to WinWay TradingExpert’s Group and Sector tools. From charting a stock right to its parent group to dozens of Built-in reports, tracking the hot and cold groups has never been easier.
-
Defining, creating and testing a Trading strategy has never been easier. WInWay TradingExpert’s Expert Design Studio and Portfolio Simulator allow both novice and expert investors to fine-tune their Trading strategy real time or end of day.
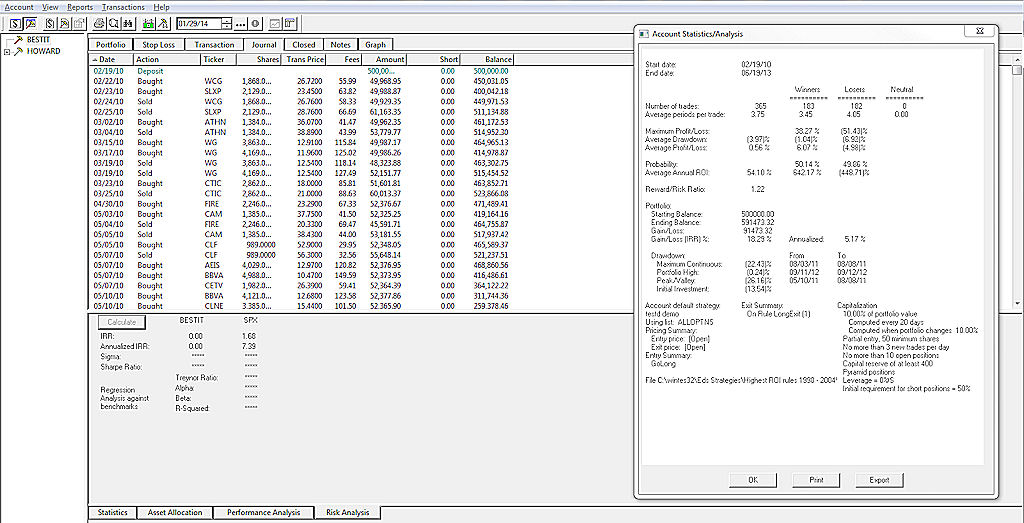
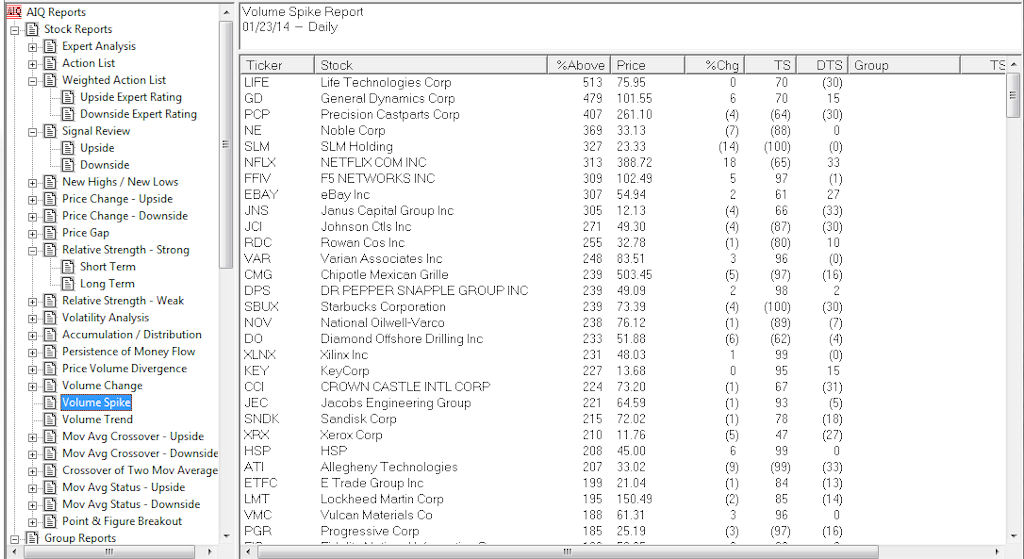
Over one hundred built-in reports, unparalleled power at your fingertips, including
-
Relative Strength
-
Persistence of Money Flow
-
Moving Average Crossover
-
Volume Spike
-
Volatility analysis
-
Group and sector analysis
-
In depth market analysis.
-
Imagine being able to identify tickers that move together or completely opposite to each other or making groups of stocks that all move together, that’s WinWay TradingExpert’s Matchmaker.

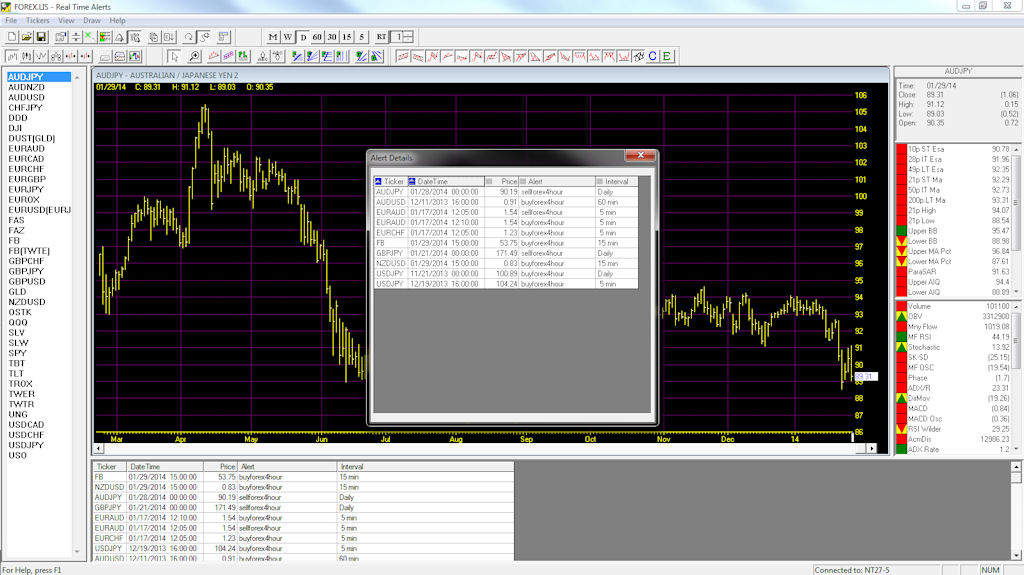
Features available in TradingExpert Pro Real-time version
-
Multiple Trading systems, multiple time frames.
-
Alerts play an audio file.
-
Build color studies
-
Define your own indicators.
-
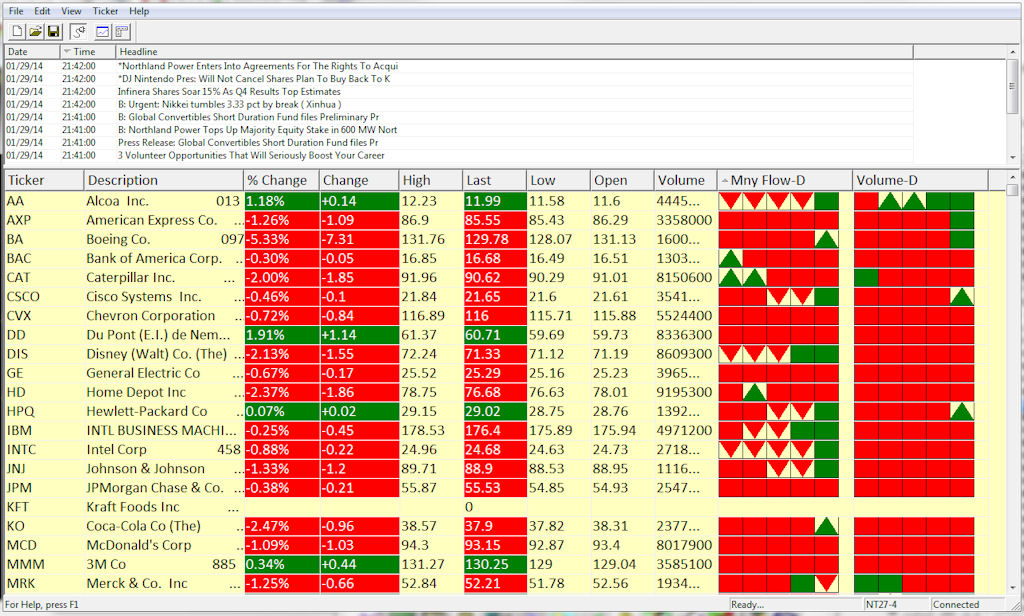
Easily apply Trading systems, alerts or studies to a whole monitor of tickers. Just watch the barometer change color when your tickers hit the buy/sell rules. As you’d expect from a premier package, quote monitors, news by ticker or headline.